[Question]
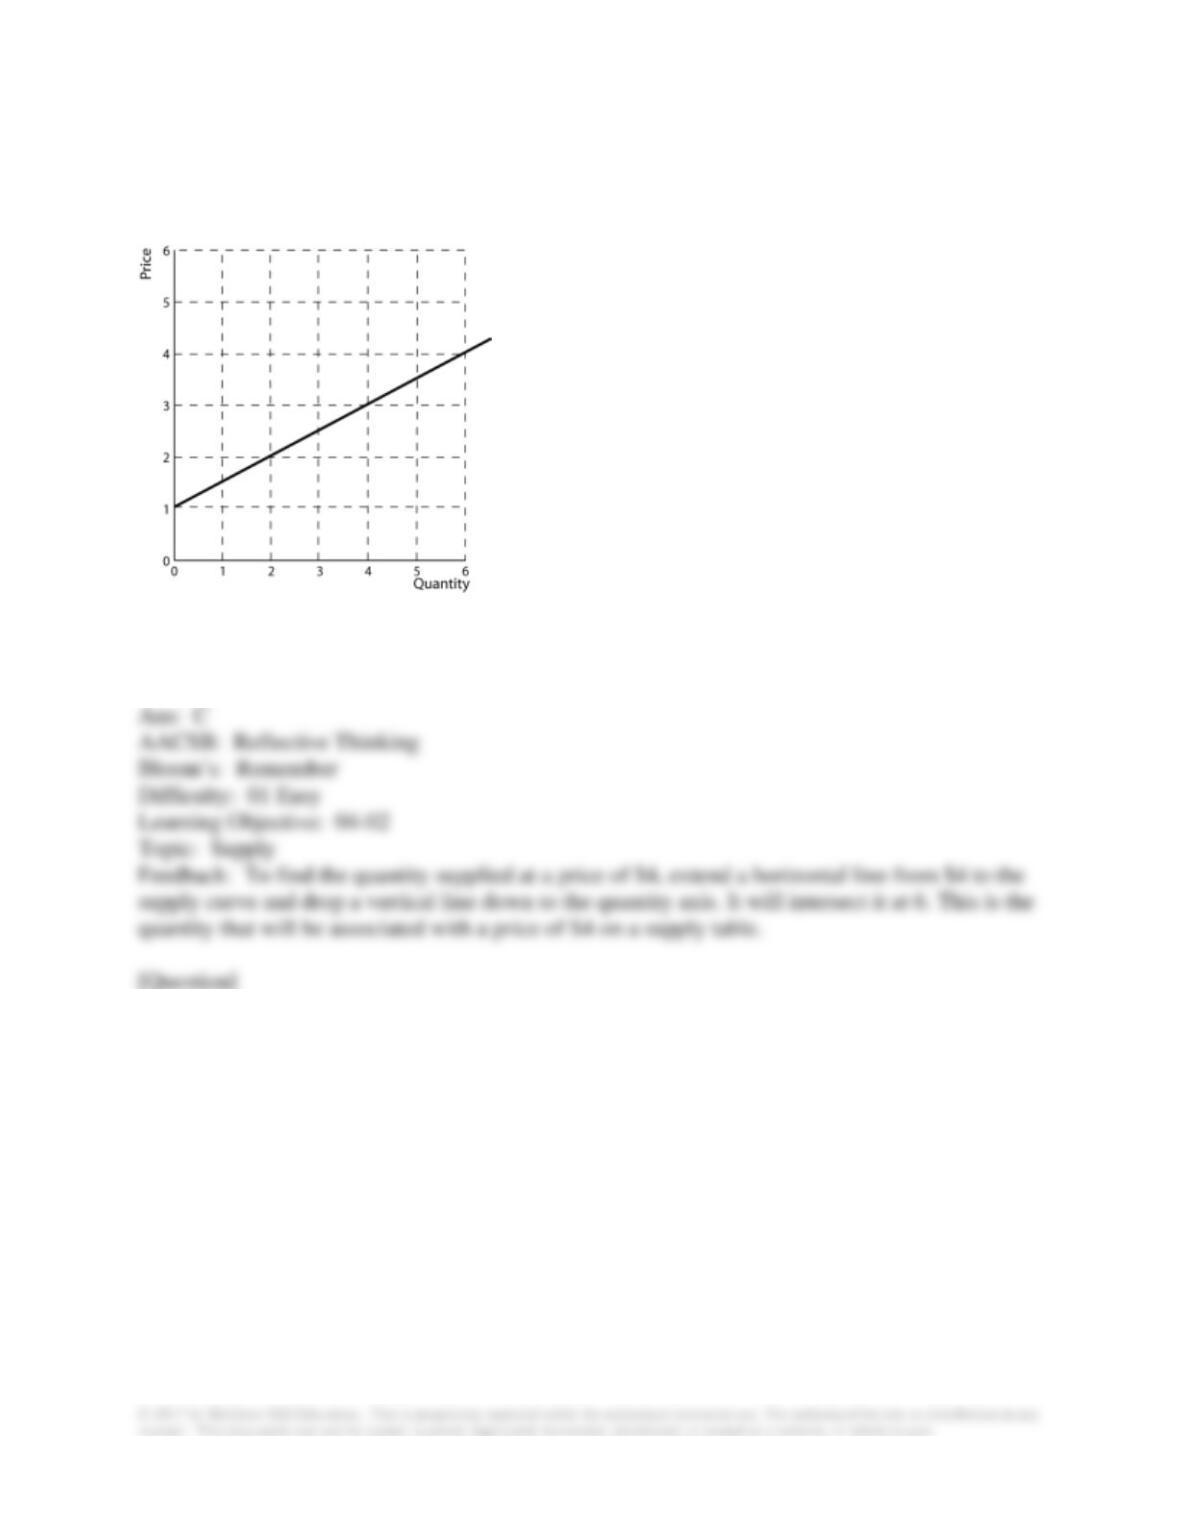
87. Given the graph shown, the quantity that would be associated with the price of $4 in a
supply table would be:
A. 2.
B. 4.
C. 6.
D. 8.
88. Given the graph shown, the quantity that would be associated with the price of $1 in a
supply table would be:
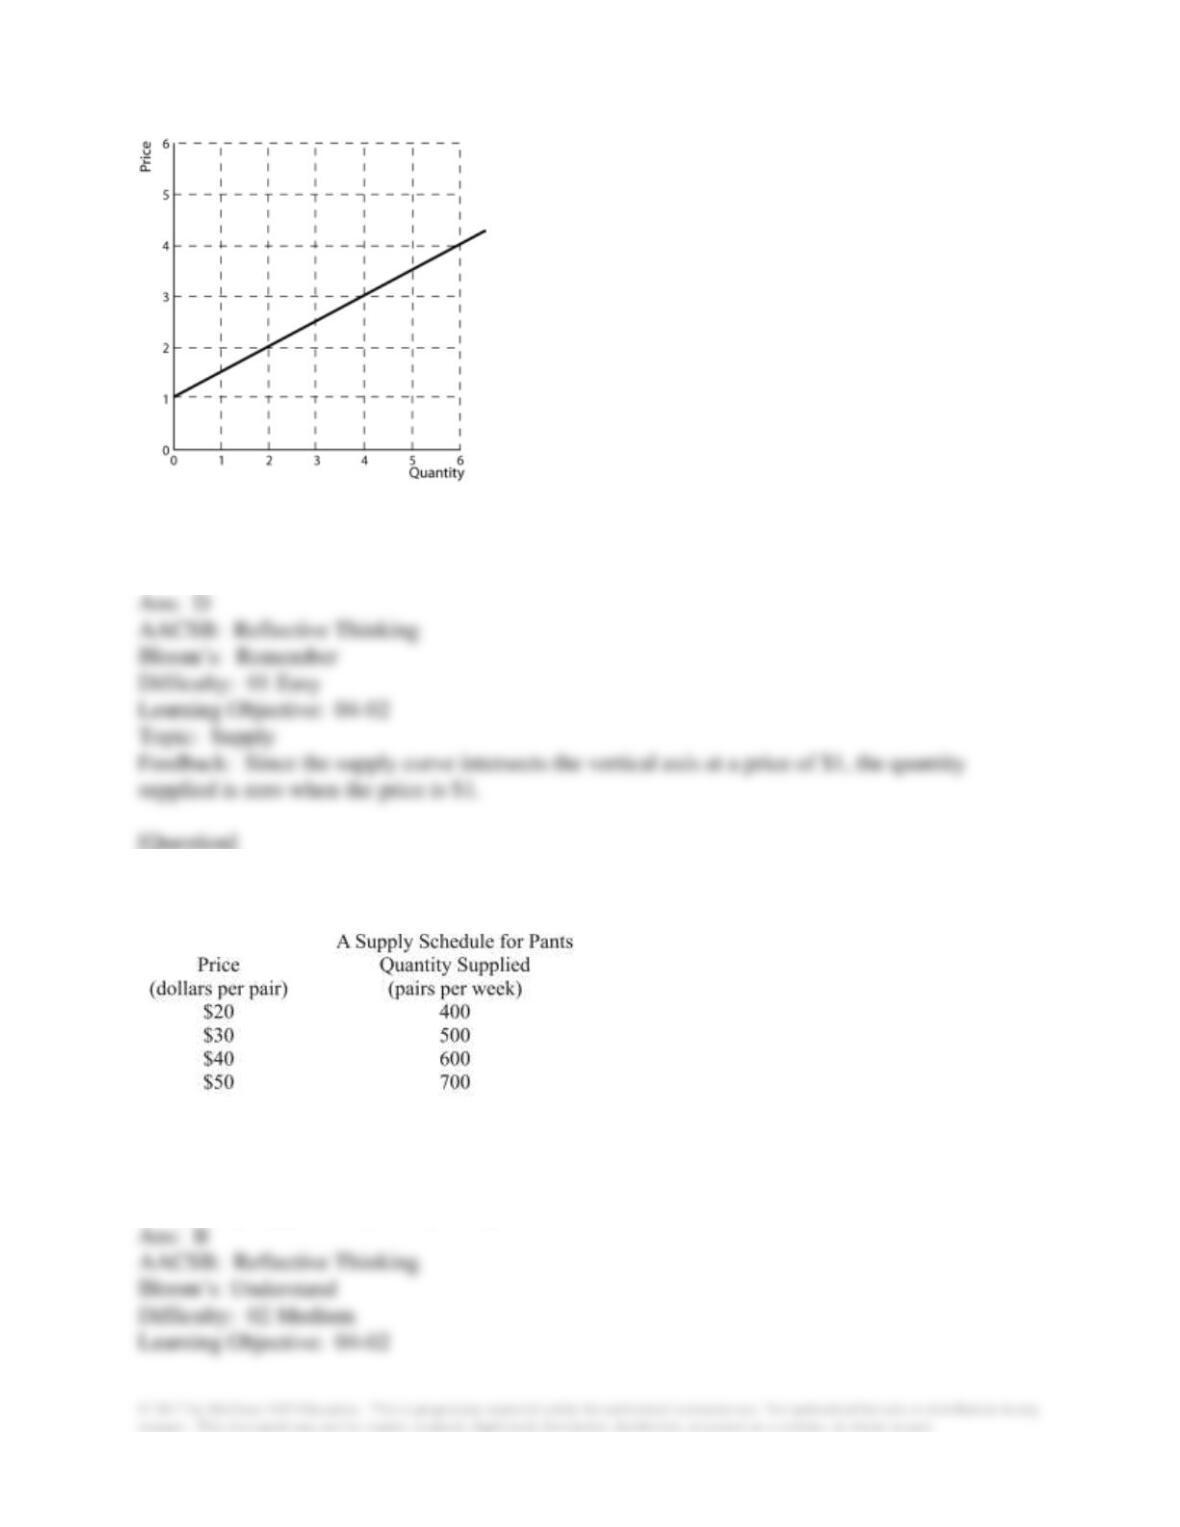
A. 3.
B. 2.
C. 1.
D. 0.
89. Given the following supply table, an increase in the price of pants from $30 to $50 per pair
will increase the:
A. supply of pants by 200 pairs.
B. quantity of pants supplied by 200 pairs.
C. supply of pants by 700 pairs.
D. quantity supplied of pants by 500 pairs.
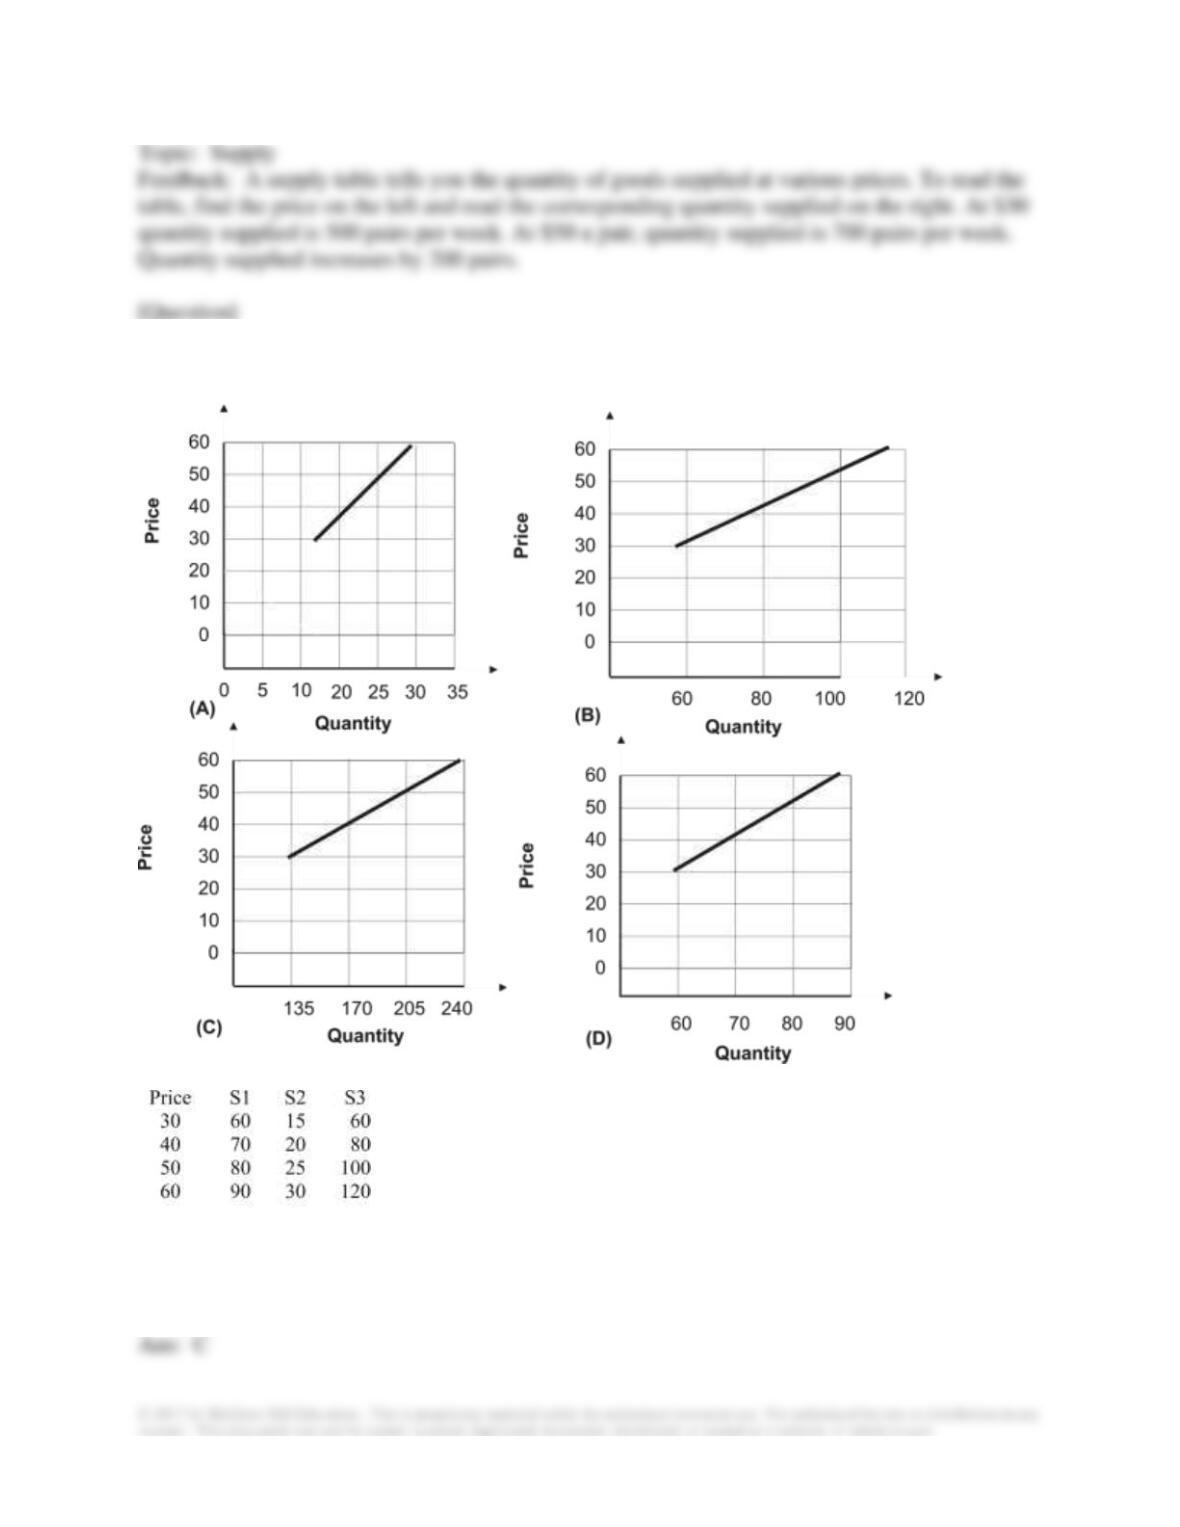
90. Which curve shown below represents the market supply given the following individual
supply tables?
A. A
B. B
C. C
D. D
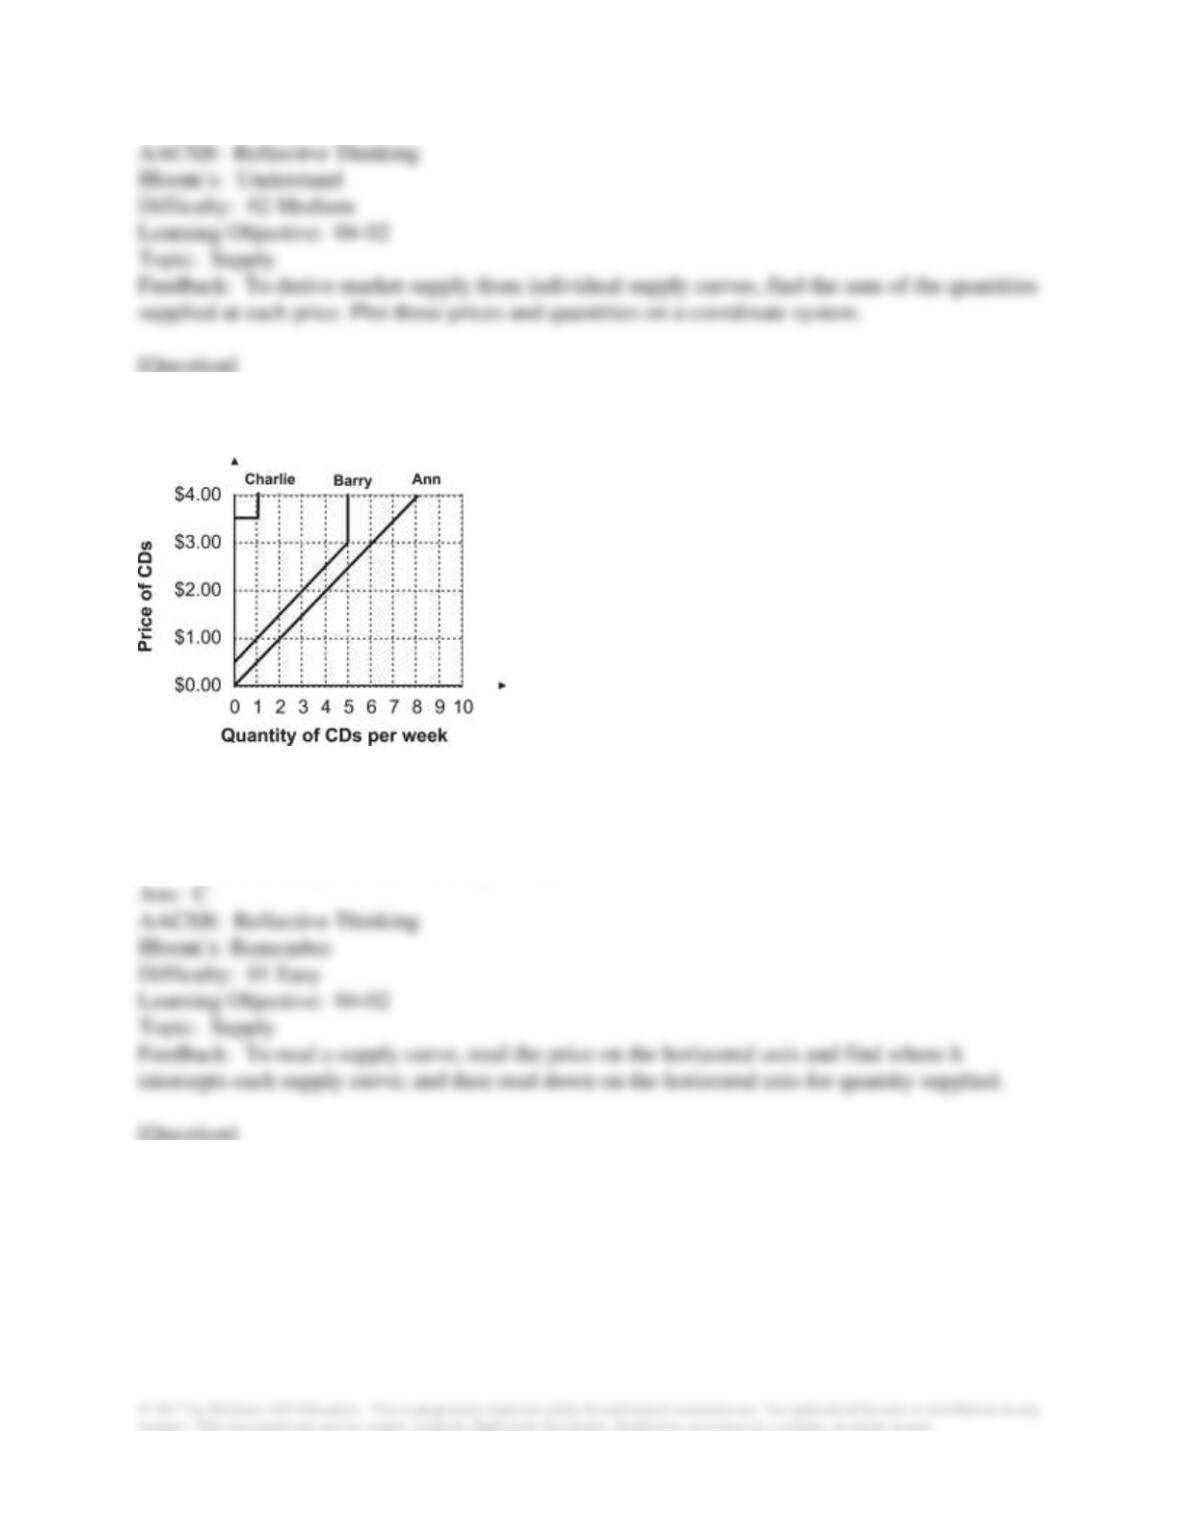
91. Refer to the graph shown. At a price of $4.00, what is the quantity supplied by each of the
producers?
A. Charlie: 4, Barry: 5, Ann: 15 CDs per week
B. Charlie: 0, Barry: 4, Ann: 14 CDs per week
C. Charlie: 1, Barry: 5, Ann: 8 CDs per week
D. Charlie: 3, Barry: 6, Ann: 7 CDs per week
92. Refer to the graph shown. What is the market quantity that would be supplied at a price of
$2.00?
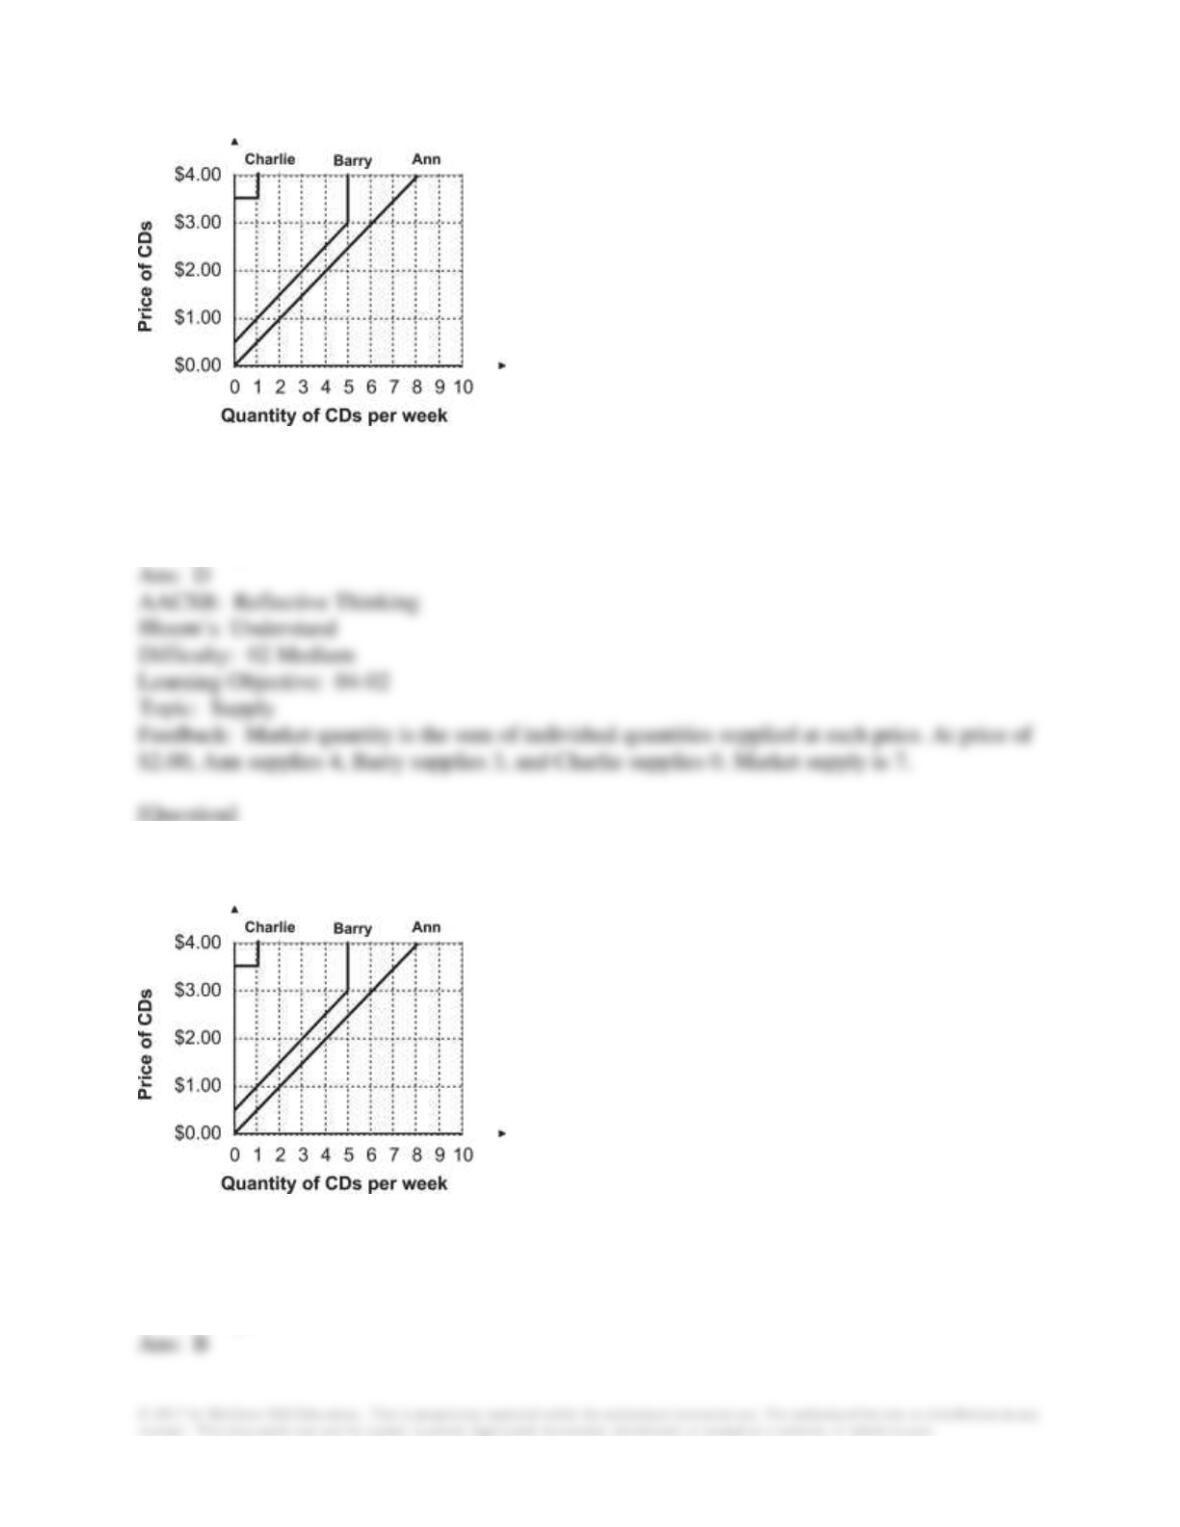
A. 2 CDs per week
B. 3 CDs per week
C. 4 CDs per week
D. 7 CDs per week
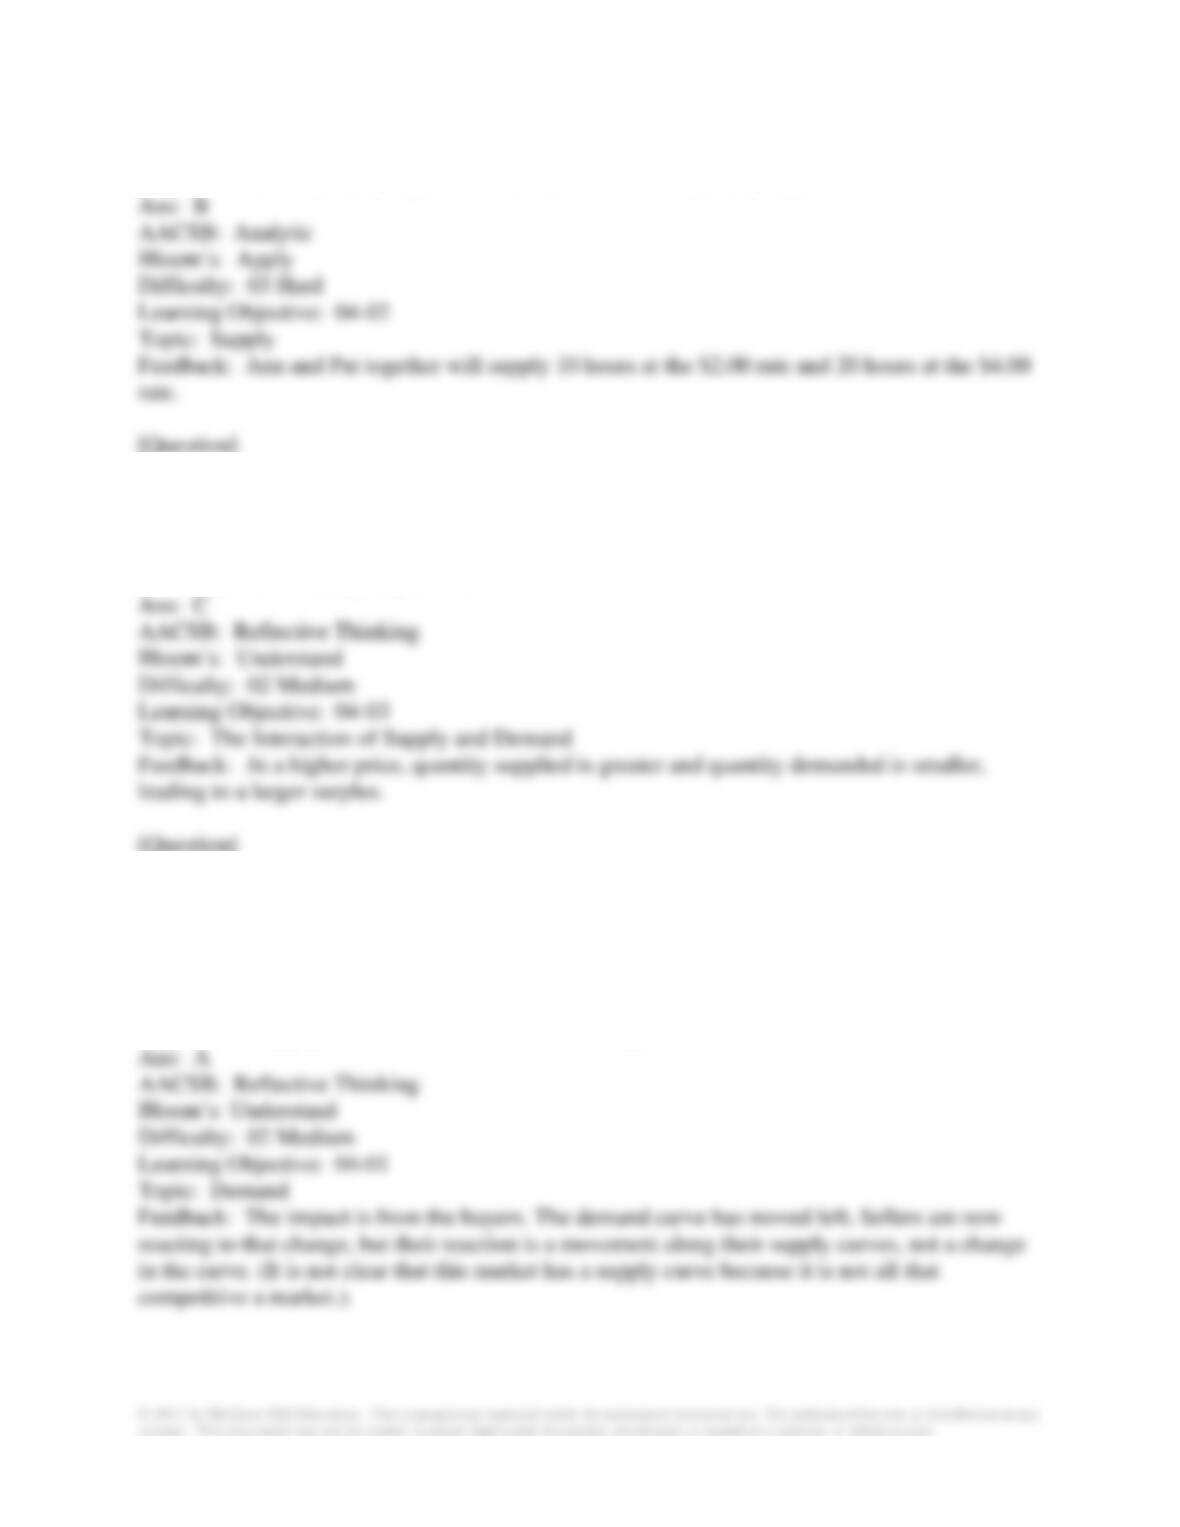
93. Refer to the graph shown. If price changes from $0.50 to $2.00, what will be the change in
the market quantity supplied?
A. 1 CDs per week
B. 6 CDs per week
C. 7 CDs per week
D. 8 CDs per week
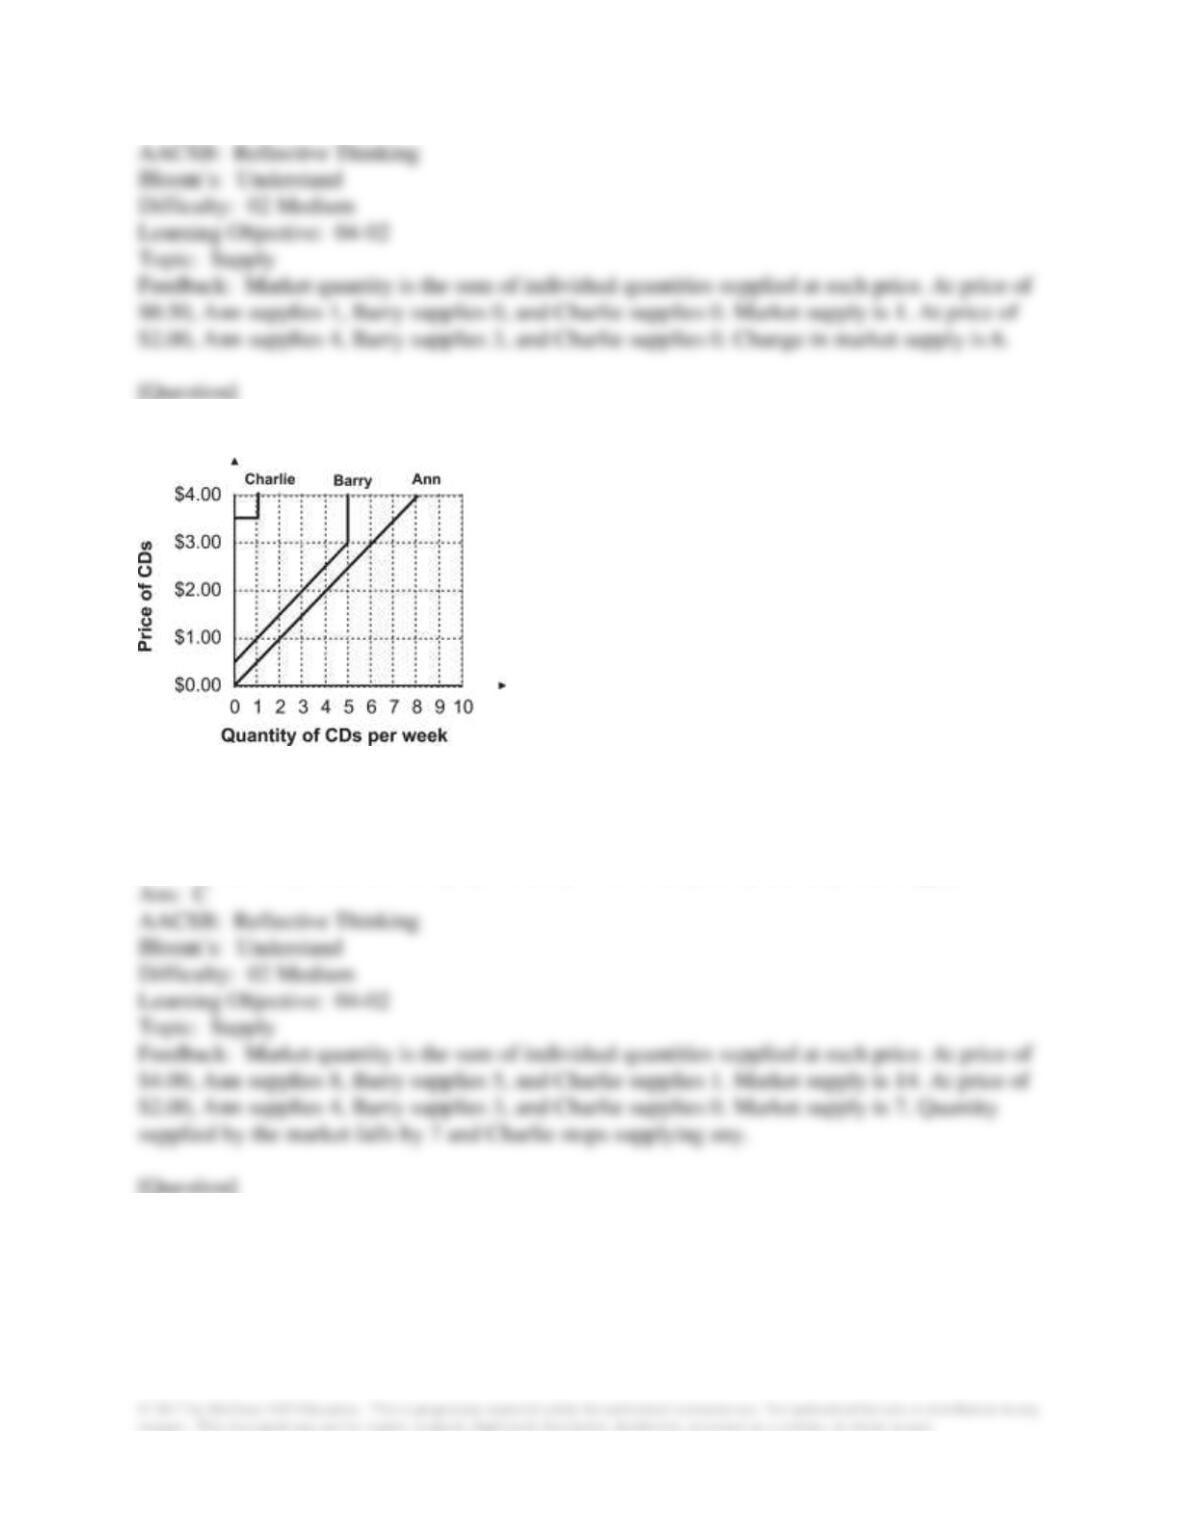
94. Refer to the graph shown. If price changes from $4.00 to $2.00 then:
A. market quantity supplied will increase by 7.
B. market quantity supplied will decrease by 12.
C. Charlie will stop supplying any of this product.
D. Charlie, Barry, and Ann will proportionally reduce the quantity that they each supply.
95. When the going rate is $2.00 per hour, Ann wants to babysit 6 hours each week and Pat
wants to babysit 4 hours each week. If the rate goes up to $4.00, Ann and Pat both double the
number of hours they are willing to babysit each week. Based on this information, a combined
supply curve will pass through the points:
A. price = $2.00, quantity supplied = 20 and price = $4.00, quantity supplied = 10.
B. price = $2.00, quantity supplied = 10 and price = $4.00, quantity supplied = 20.
C. price = $2.00, quantity supplied = 6 and price = $4.00, quantity supplied = 4.
D. price = $2.00, quantity supplied = 4 and price = $4.00, quantity supplied = 6.
96. The more the current price exceeds the equilibrium price, the:
A. greater the resulting shortage will be.
B. smaller the resulting shortage will be.
C. greater the resulting surplus will be.
D. smaller the resulting surplus will be.
97. In the early 2000s car sales in China had slowed in part caused by the government’s actions
to limit businesses from lending funds to consumers. Assuming the car market in China can be
analyzed with demand and supply curves, what best reflects the change in the market?
A. Demand curve shifts to the left with no change in supply.
B. Supply curve shifts to the left with no change in demand.
C. Both the supply and demand curves shift to the left.
D. Both the supply and demand curves shift to the right.
99. Suppose a market has an excess demand and price starts to rise. What will the rise in price
cause?
A. A fall in both quantity supplied and quantity demanded.
B. A rise in both quantity supplied and quantity demanded.
C. A rise in quantity supplied and a fall in quantity demanded.
D. A fall in quantity supplied and a rise in quantity demanded.
100. If the price in a market is above its equilibrium level, there will be a:
A. surplus and downward pressure on price.
B. surplus and upward pressure on price.
C. shortage and downward pressure on price.
D. shortage and upward pressure on price.
101. When quantity supplied is greater than quantity demanded, prices tend to:
A. fall.
B. rise.
C. stay the same.
D. remain constant until the next season.
102. Price tends to be in equilibrium where supply and demand intersect because when quantity
supplied:
A. equals quantity demanded, prices don’t change.
B. exceeds quantity demanded, prices have a tendency to rise.
C. is less than quantity demanded, prices tend to fall.
D. equals quantity demanded, prices will fall.
103. If supply and demand intersect at a price of $5.00, then a reduction in price from $6.00 to
$5.00 will cause an increase in quantity:
A. supplied, a decrease in quantity demanded, and the alleviation of a shortage.
B. demanded, a decrease in quantity supplied, and the alleviation of a shortage.
C. supplied, a decrease in quantity demanded, and the alleviation of a surplus.
D. demanded, a decrease in quantity supplied, and the alleviation of a surplus.
104. If quantity supplied exceeds quantity demanded, there is a tendency for:
A. price to fall to restore equilibrium.
B. price to rise to restore equilibrium.
C. the demand curve to shift to the left to restore equilibrium.
D. the demand curve to shift to the right to restore equilibrium.
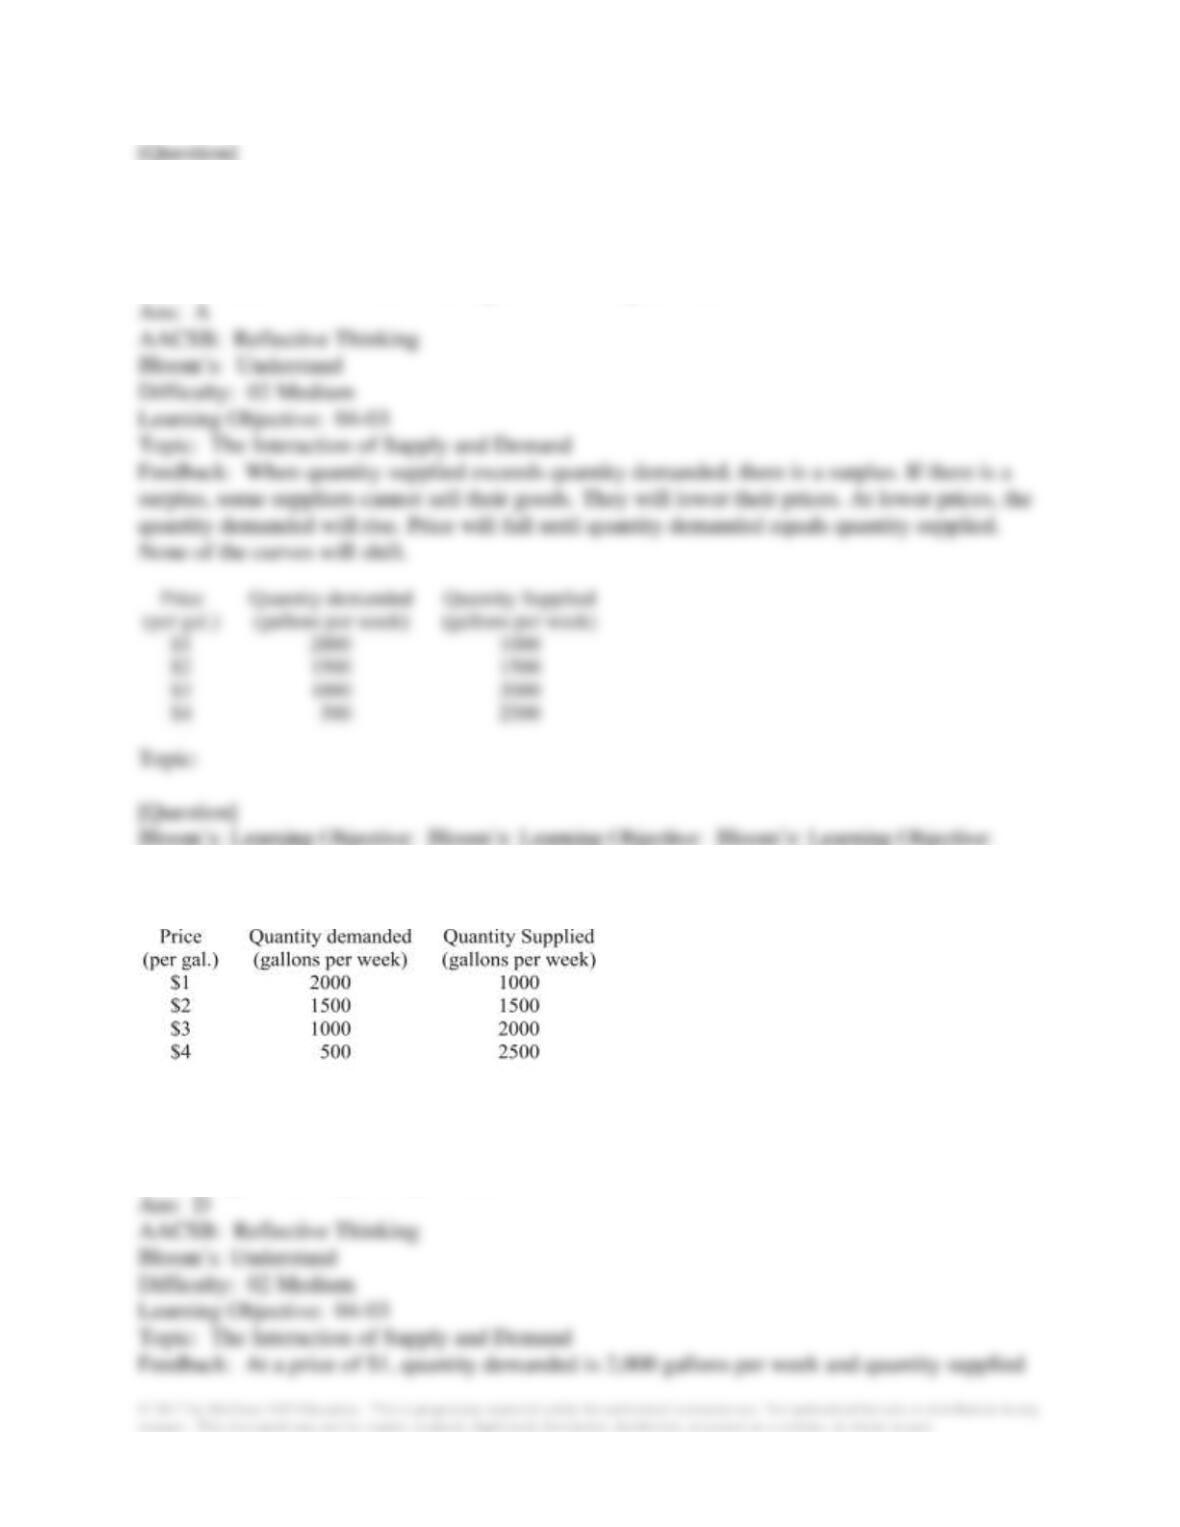
105. Suppose the given supply and demand tables reflect the supply and demand for milk per
week. At a price of $1, there is a:
A. surplus of 500 gallons per week.
B. surplus of 1,000 gallons per week.
C. shortage of 2,500 gallons per week.
D. shortage of 1,000 gallons per week.
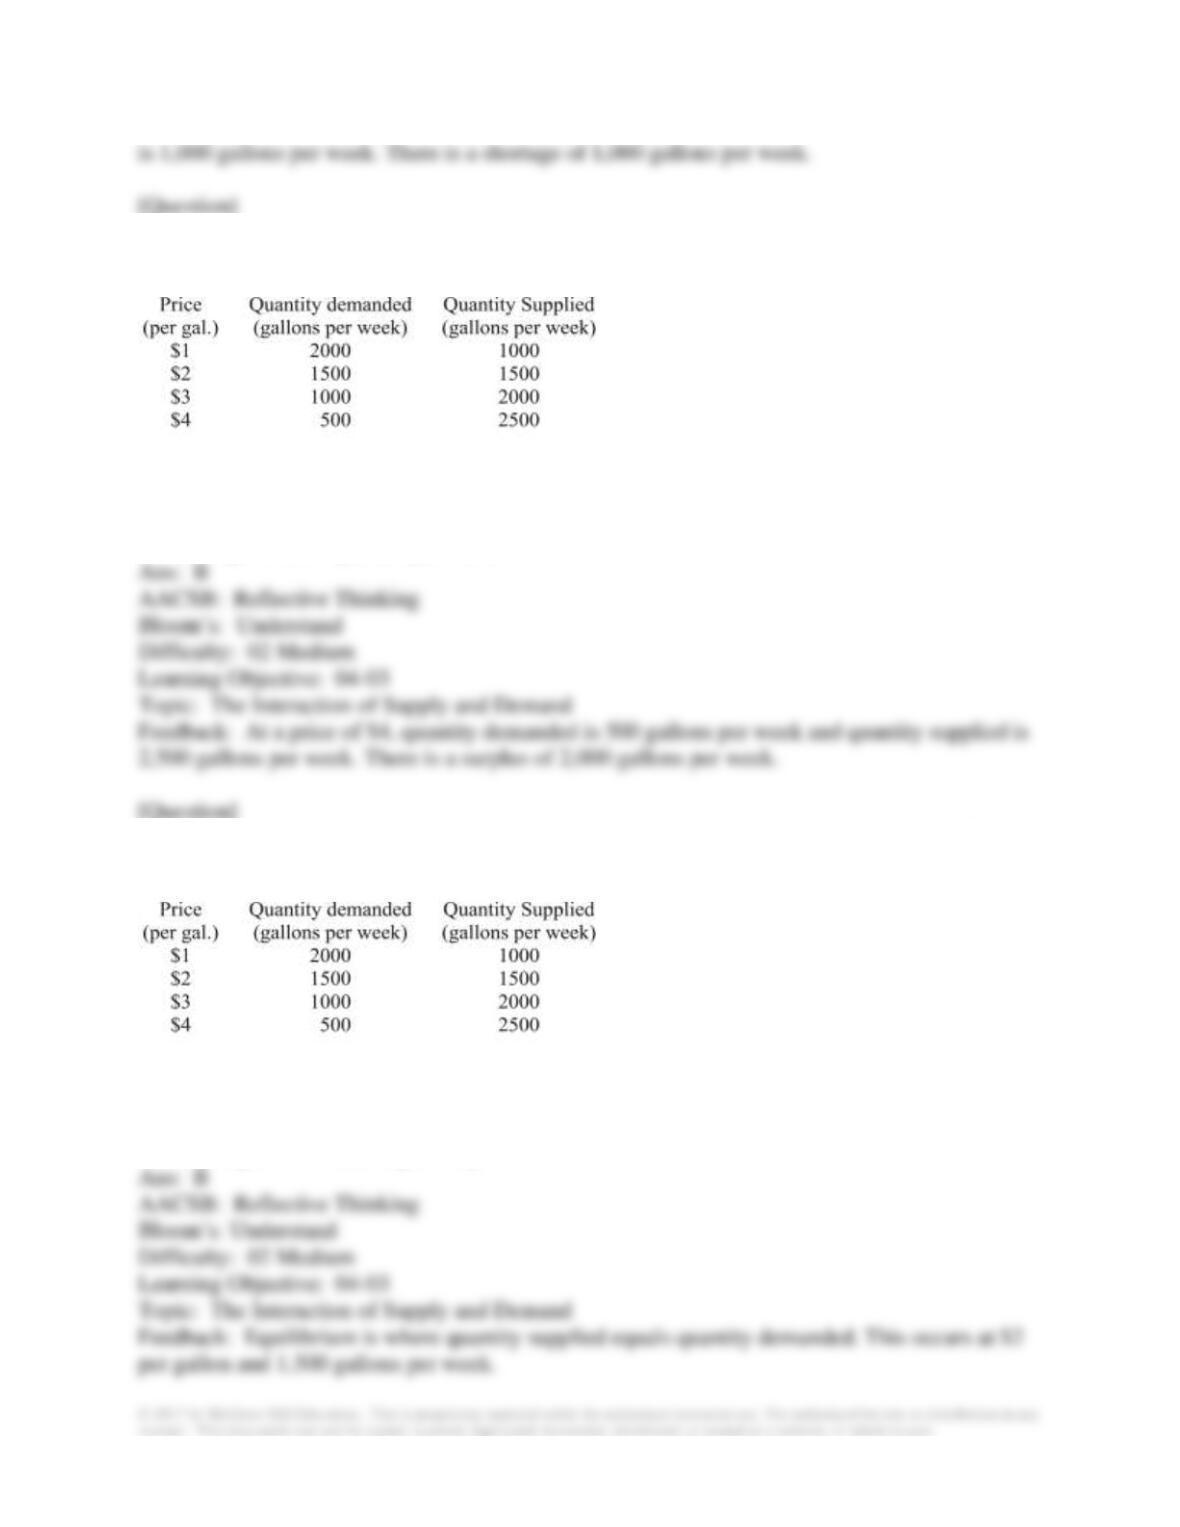
106. Suppose the supply and demand tables shown reflect the supply and demand for milk per
week. At a price of $4, there is a:
A. surplus of 1,000 gallons per week.
B. surplus of 2,000 gallons per week.
C. shortage of 1,000 gallons per week.
D. shortage of 2,000 gallons per week.
107. Suppose the supply and demand tables shown reflect the supply and demand for milk per
week. What is the equilibrium price and quantity of milk?
A. $1 per gallon and 2,000 gallons per week.
B. $2 per gallon and 1,500 gallons per week.
C. $3 per gallon and 2,000 gallons per week.
D. $4 per gallon and 2,000 gallons per week.
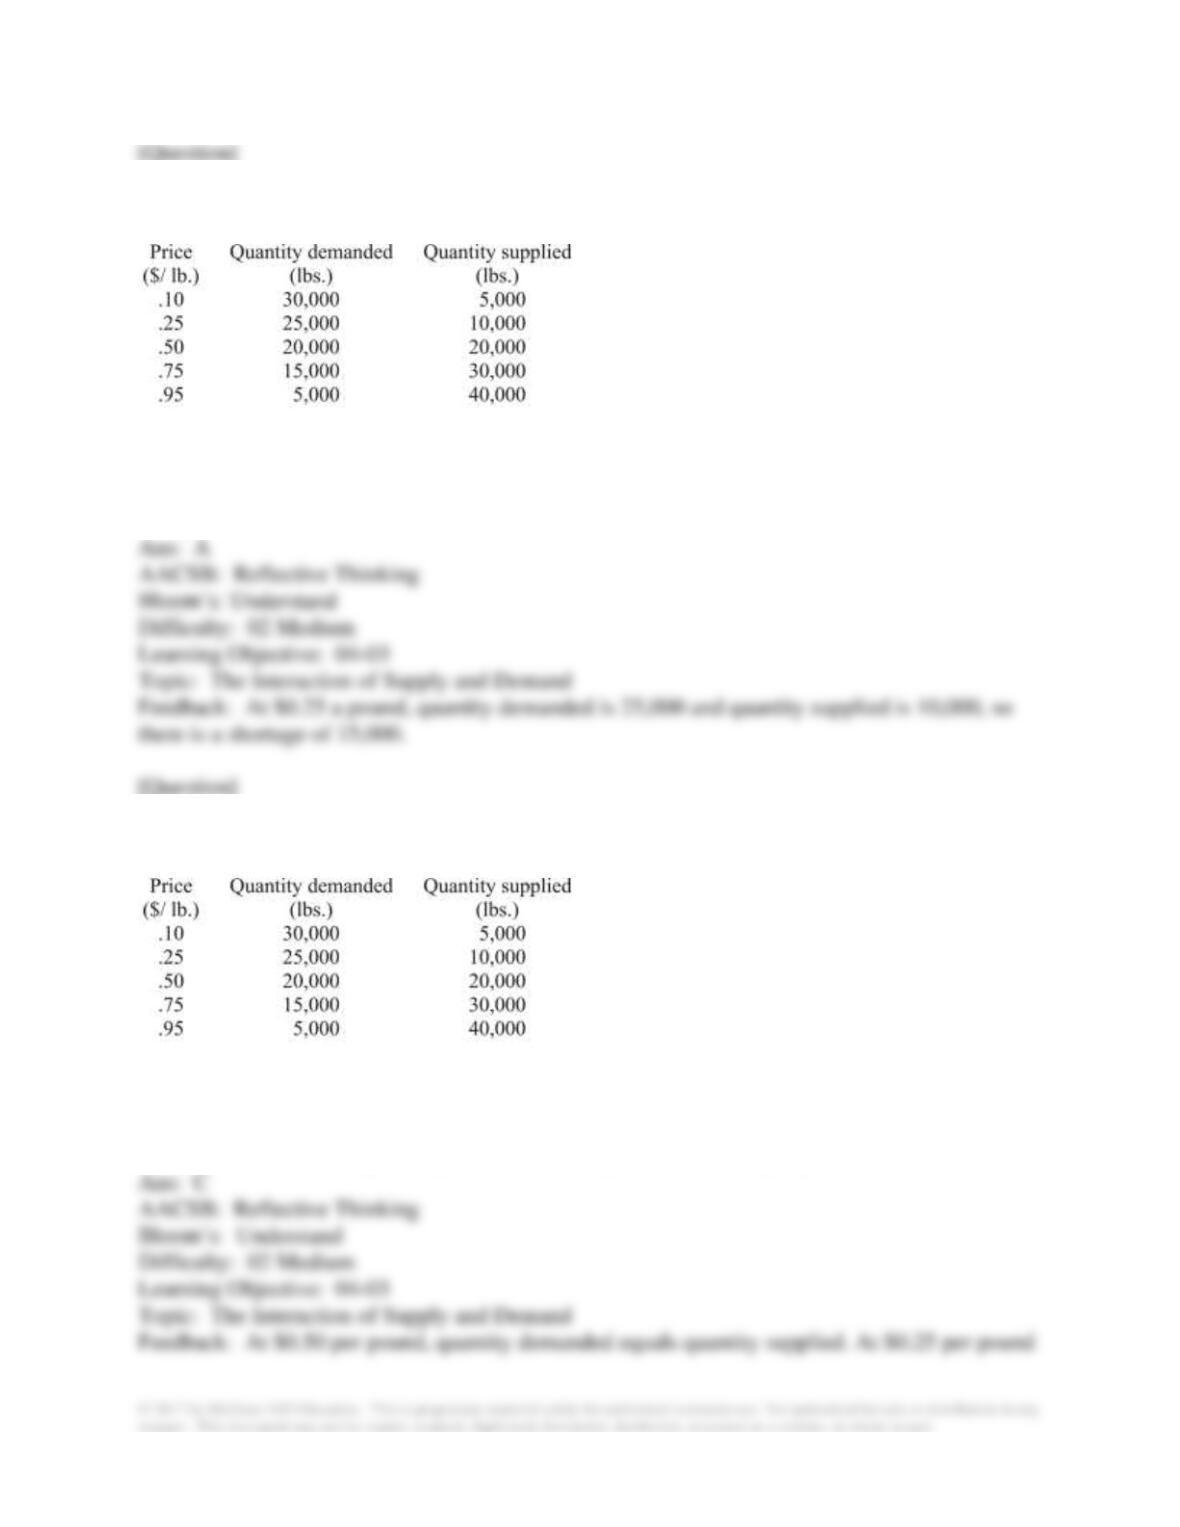
108. Suppose that the table shown shows the demand and supply schedules for pork bellies.
There is a shortage of 15,000 pounds at a price of:
A. $0.25.
B. $0.50.
C. $0.75.
D. $0.95.
109. Suppose that the table shown shows the demand and supply schedules for pork bellies.
Which of the following statements is true?
A. There would be a surplus of pork bellies if the price were $0.50 per pound.
B. There would be a shortage of pork bellies if the price were $0.50 per pound.
C. There would be a shortage of pork bellies if the price were $0.25 per pound.
D. There would be a surplus of pork bellies if the price were $0.25 per pound.
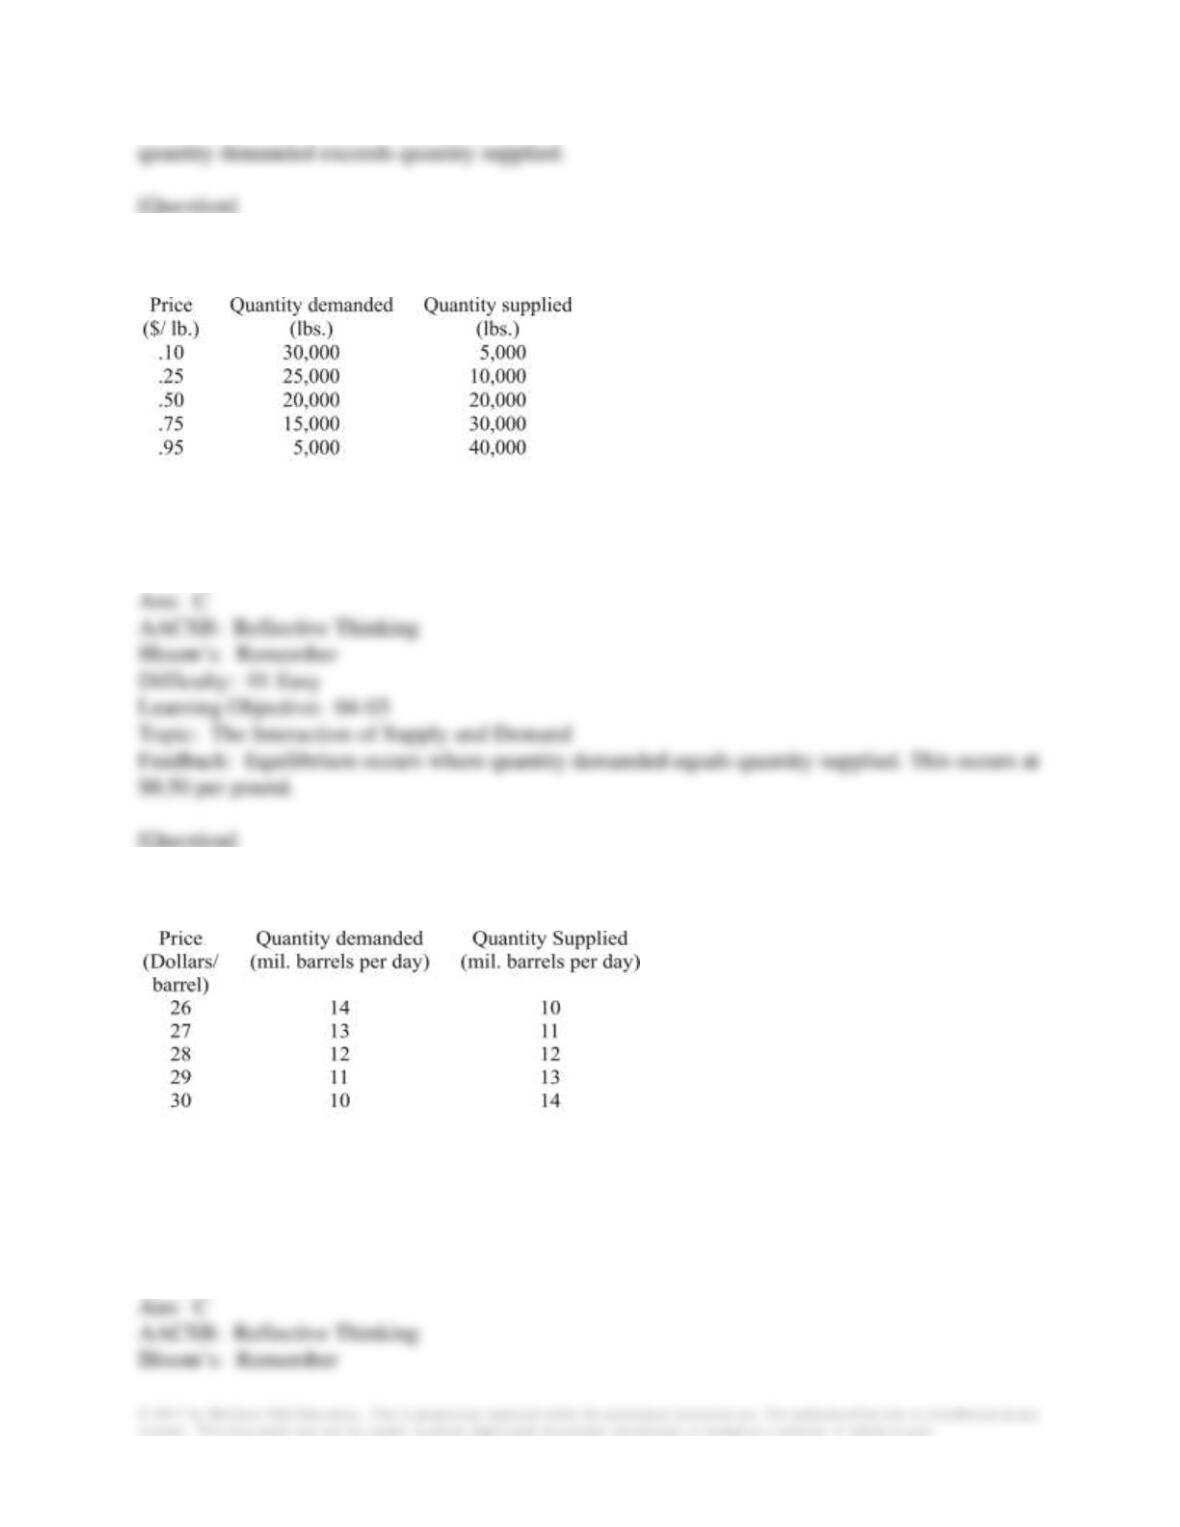
110. Suppose that the table shown shows the demand and supply schedules for pork bellies.
Based on the table, the equilibrium price of pork bellies is:
A. $0.10/lb.
B. $0.25/lb.
C. $0.50/lb.
D. $0.75/lb.
111. Suppose that the following table shows the supply and demand schedules for Arabian light
crude oil on the free market:
Given the information in the table, the only price at which there is neither shortage nor surplus is:
A. $26 per barrel.
B. $27 per barrel.
C. $28 per barrel.
D. $29 per barrel.
112. The point at which the supply curve and the demand curve intersect is called:
A. equilibrium, because quantity demanded equals quantity supplied so there is no tendency for
price to change.
B. equilibrium, because quantity demanded exceeds quantity supplied so there is a shortage.
C. equilibrium, because quantity supplied exceeds quantity demanded so there is a surplus.
D. irrelevant, because real-world prices never reach this point.
113. In a market where there are strong social and political forces:
A. quantity demanded will be expected to equal quantity supplied.
B. quantity demanded might not equal quantity supplied.
C. the market will be in disequilibrium.
D. the invisible hand will overcome all other forces.
114. If you observe a market where quantity demanded doesn’t equal quantity supplied, a logical
conclusion is that:
A. the law of demand and supply do not hold in the market.
B. the fallacy of composition is not operative in the market.
C. the invisible hand is the only force at work in the market.
D. social and political forces are likely to exist.
115. When the number of Alaskan fishermen increased, salmon prices fell to record lows. This
could be shown graphically by a shift in:
A. the demand curve right.
B. the supply curve left.
C. the demand curve left.
D. the supply curve right.
116. In the early 2000s, the number of Eastern Europeans moving to England to join the labor
force increased. This has led to fears by British citizens that Eastern Europeans will steal jobs
from Western Europeans. What best describes their fear?
A. Wages in Britain will fall as the demand for immigrants increases.
B. Cost of living in Britain will increase as the demand for goods increases.
C. Wages in Britain will fall since the quantity of labor supplied is increasing.
D. Wages in Britain will fall since the supply of labor is increasing.
117. Using the supply and demand model, what is the best way to show the effects on the
plywood market of households preparing for a hurricane? (Note: people use plywood to board up
their homes to protect them from damage from a hurricane.)
A. Supply curve shifted to the right, demand curve did not shift.
B. Demand curve shifted to the right, supply curve did not shift.
C. Both supply and demand curves shifted to the right.
D. Supply curve moved right and demand curve shifted to the left.
118. Demand for healthy kidneys is high in both India in Nepal. But it is also illegal to buy or
sell organs. Despite the legal and social disapproval, there is an illegal market for organs.
Assuming the legal and social disapproval does not influence buyers but discourages sellers from
offering organs, the disapproval will:
A. raise price and raise quantity.
B. raise price but lower quantity.
C. lower price but raise quantity.
D. lower price and lower quantity.
119. When gasoline prices fall, the demand for alternative fuel cars likely:
A. falls, lowering their equilibrium price and raising equilibrium quantity.
B. rises, raising their equilibrium price and quantity.
C. falls, raising their equilibrium price and lowering equilibrium quantity.
D. falls, lowering their equilibrium price and quantity.
120. The increase in the availability of organic foods likely:
A. lowers equilibrium quantity and raises equilibrium price for organic foods.
B. raises equilibrium quantity and price for organic foods.
C. raises equilibrium quantity and lowers equilibrium price for organic foods.
D. lowers equilibrium quantity and price for organic foods.
121. The model of supply and demand leads to the prediction that low interest rates cause:
A. an increase in housing prices, especially in cities with plenty of room for expansion.
B. an increase in housing prices, especially in cities with limited land.
C. a decrease in housing prices, especially in cities with plenty of room for expansion.
D. a decrease in housing prices, especially in cities with limited land.
122. Given that diesel cars get much better gas mileage than the typical car, an increase in the
price of gasoline would be expected to:
A. decrease the equilibrium price and increase the equilibrium quantity of diesel cars.
B. increase the equilibrium price and decrease the equilibrium quantity of diesel cars.
C. decrease the equilibrium price and quantity of diesel cars.
D. increase the equilibrium price and quantity of diesel cars.