Microeconomics: Theory and Applications with Calculus, 3e (Perloff)
Chapter 4 Demand
4.1 Deriving Demand Curves
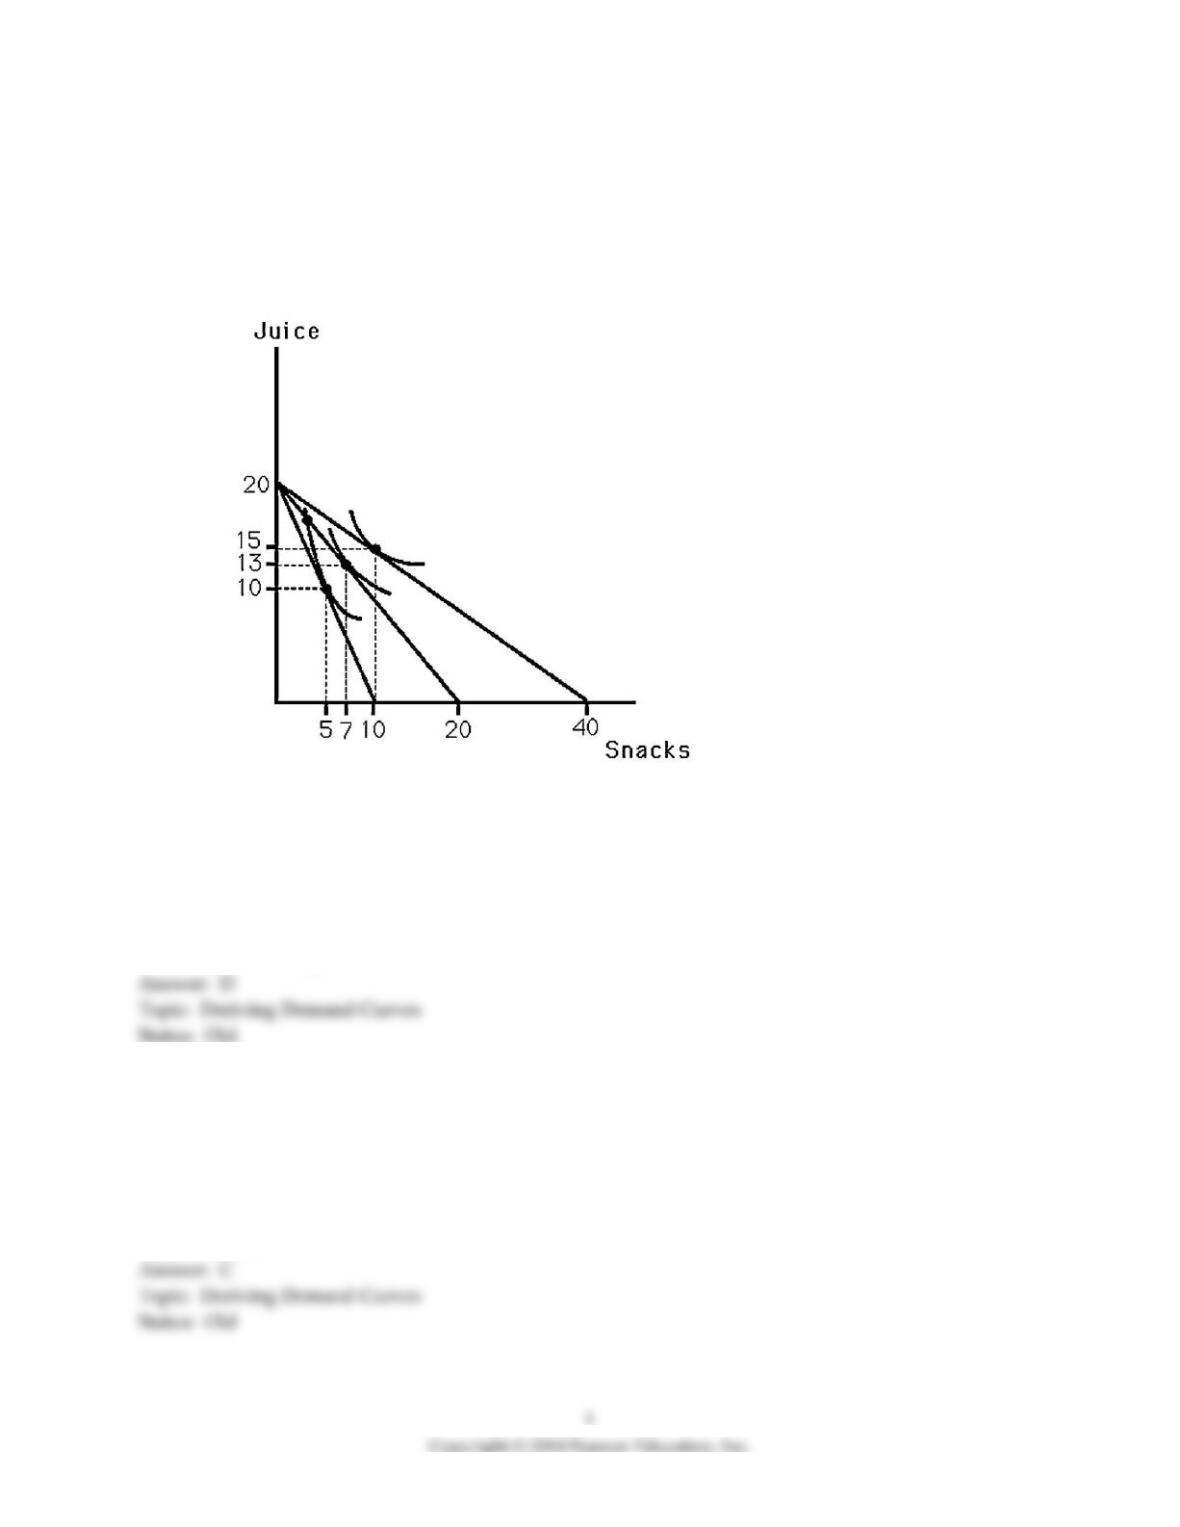
1) The above figure shows Bobby’s indifference map for juice and snacks. Also shown are three budget
lines resulting from different prices for snacks assuming he has $20 to spend on these goods. Which of the
following points are on Bobby’s price-consumption curve?
A) 10 snacks and 20 juices
B) 10 snacks and 0 juices
C) 10 snacks and 5 juices
D) 10 snacks and 15 juices
2) The above figure shows Bobby’s indifference map for juice and snacks. Also shown are three budget
lines resulting from different prices for snacks assuming he has $20 to spend on these goods. Which of the
following points are on Bobby’s demand curve for snacks?
A) p = 2, q = 10
B) p = 2, q = 13
C) p = 2, q = 5
D) p = 1, q = 20
3) The above figure shows Bobby’s indifference map for juice and snacks. Also shown are three budget
lines resulting from different prices for snacks assuming he has $20 to spend on these goods. What is
MRS for the point on Bobby’s demand curve for snacks where price of snacks is $0.5?
A) -1
B) -0.5
C) -2
D) Not enough information
4) The above figure shows Bobby’s indifference map for juice and snacks. Also shown are three budget
lines resulting from different prices for snacks. This information could be used to determine
A) the slope of Bobby’s demand curve for juice.
B) the amount by which Bobby’s demand curve for juice shifts when his income rises.
C) the amount by which Bobby’s demand curve for juice shifts when the price of snacks rises.
D) All of the above.
5) The above figure shows Bobby’s indifference map for juice and snacks. Also shown are three budget
lines resulting from different prices for snacks. As the price of snacks rises, Bobby‘s utility
A) stays the same.
B) increases.
C) decreases.
D) might change, but there is not enough information to determine.
6) The above figure shows Bobby’s indifference map for juice and snacks. Assuming income remains
unchanged, when the budget line rotates out, the expenditure on snacks
A) increases.
B) decreases.
C) does not change.
D) Not enough information
7) The above figure shows Bobby’s indifference map for juice and snacks. Also shown are three budget
lines resulting from different prices for snacks. Bobby’s demand for snacks is
A) unit elastic.
B) elastic.
C) inelastic.
D) perfectly elastic.
8) The above figure shows Bobby’s indifference map for juice and snacks. Also shown are three budget
lines resulting from different prices for snacks. As the price of snacks rises, the price for juice
A) stays the same.
B) increases.
C) decreases
D) might change, but there is not enough information to determine.
9) The above figure shows Bobby’s indifference map for juice and snacks. Also shown are three budget
lines resulting from different prices for snacks. Bobby views snacks as a(n)
A) normal good.
B) inferior good.
C) Giffen good.
D) luxury good.
10) An individual’s demand curve for a good can be derived by measuring the quantities selected as
A) the price of the good changes.
B) the price of substitute goods changes.
C) income changes.
D) All of the above.
11) As the price of a good rises, the consumer will experience
A) a desire to consume a different bundle.
B) a decrease in utility.
C) a southwesterly movement on the indifference map.
D) All of the above.
12) An increase in the price of a good causes
A) a change in the slope of the budget line.
B) an increase in the consumption of that good.
C) a rightward shift of the demand curve for that good.
D) a parallel rightward shift of the budget line.
13) Suppose a graph is drawn to show a consumer’s preferences for football tickets and basketball tickets.
The quantity of football tickets is measured on the horizontal axis. If the price-consumption curve is
horizontal when the price of football tickets changes, then
A) football tickets are an inferior good.
B) the demand for football tickets is perfectly elastic.
C) the demand for football tickets is unit elastic.
D) the demand curve for football tickets will be horizontal.
14) In the relevant price range a demand curve for a Giffen good would be
A) upward sloping.
B) downward sloping.
C) horizontal.
D) vertical.
15) Suppose the quantity of x is measured on the horizontal axis. If the price consumption curve is
vertical when the price of x changes, then the demand for x is
A) perfectly elastic.
B) perfectly inelastic.
C) unit elastic.
D) There is not enough information to determine the price elasticity of demand for x.
For the following, please answer “True” or “False” and explain why.
16) If the price-consumption curve is upward sloping when the price of the good measured on the
horizontal axis changes, then the demand curve for that good will be upward sloping.
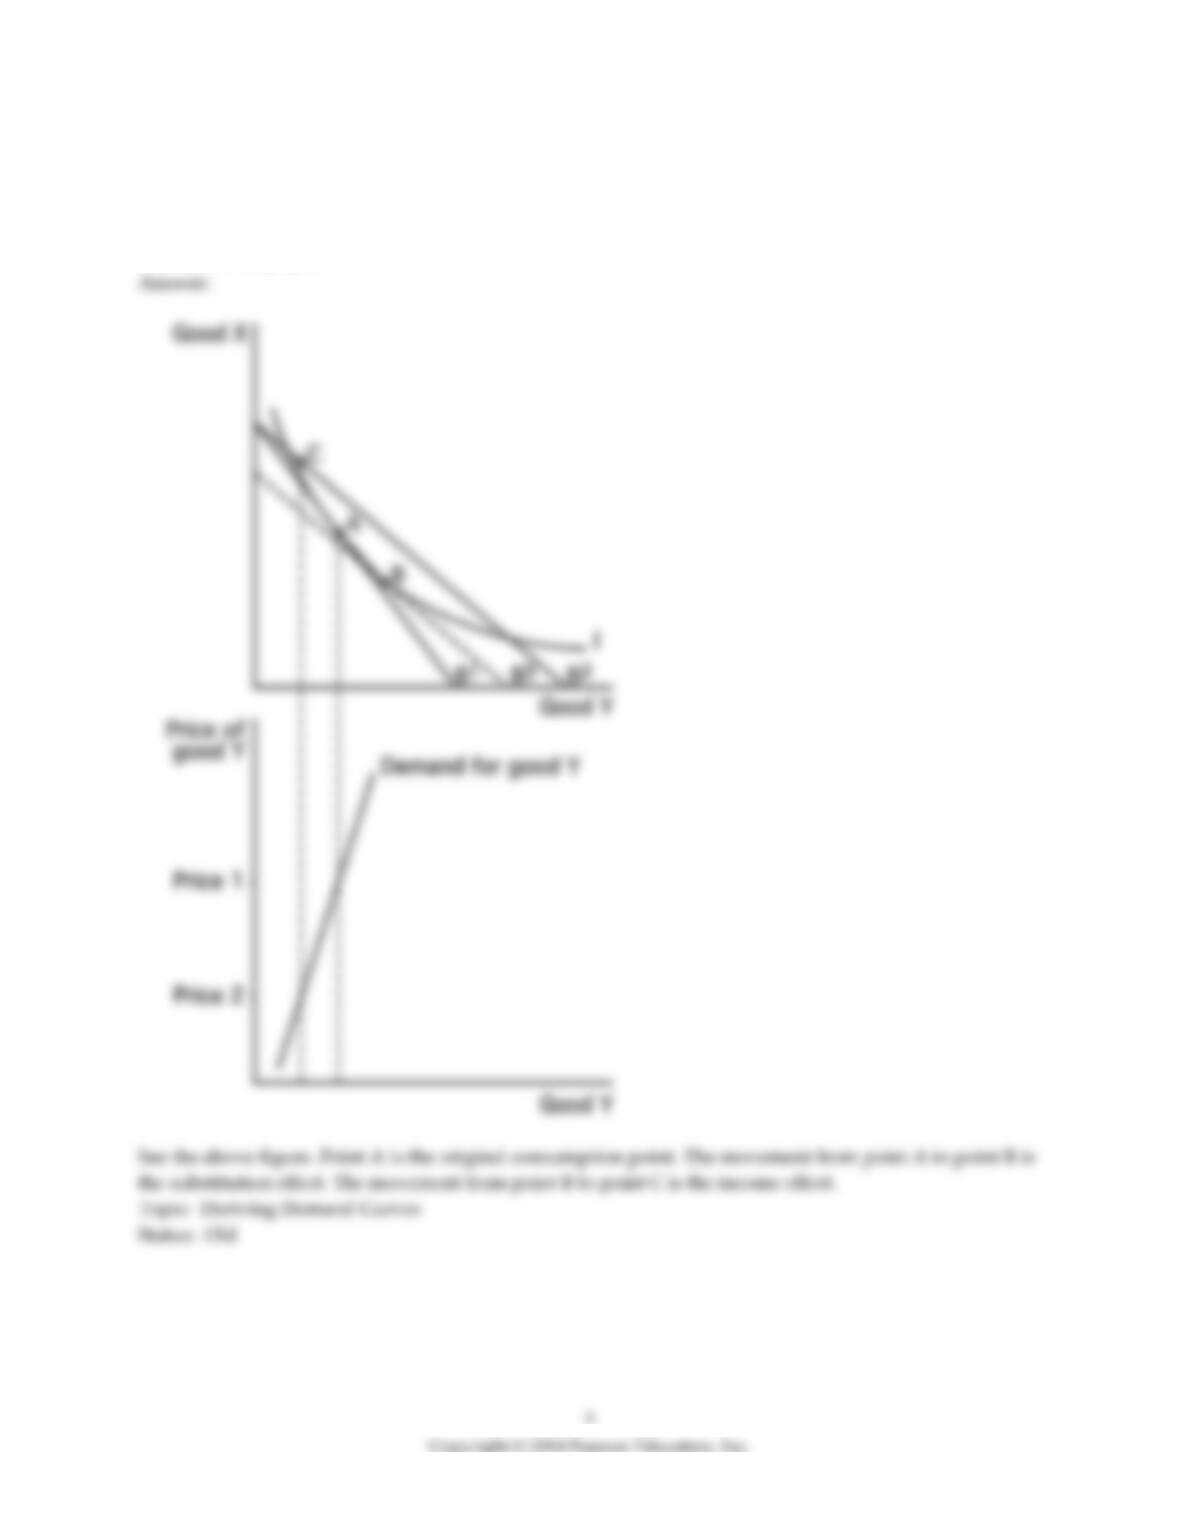
17) Draw two graphs, one directly above the other. On the upper graph, label the vertical axis Good X
and label the horizontal axis Good Y. On the lower graph, label the vertical axis the Price of good Y and
label the horizontal axis Good Y. In the upper graph, show the income and substitution effects of a
decrease in the Price of good Y when Y is a Giffen good. Draw the corresponding demand curve for Good
Y in the lower graph.
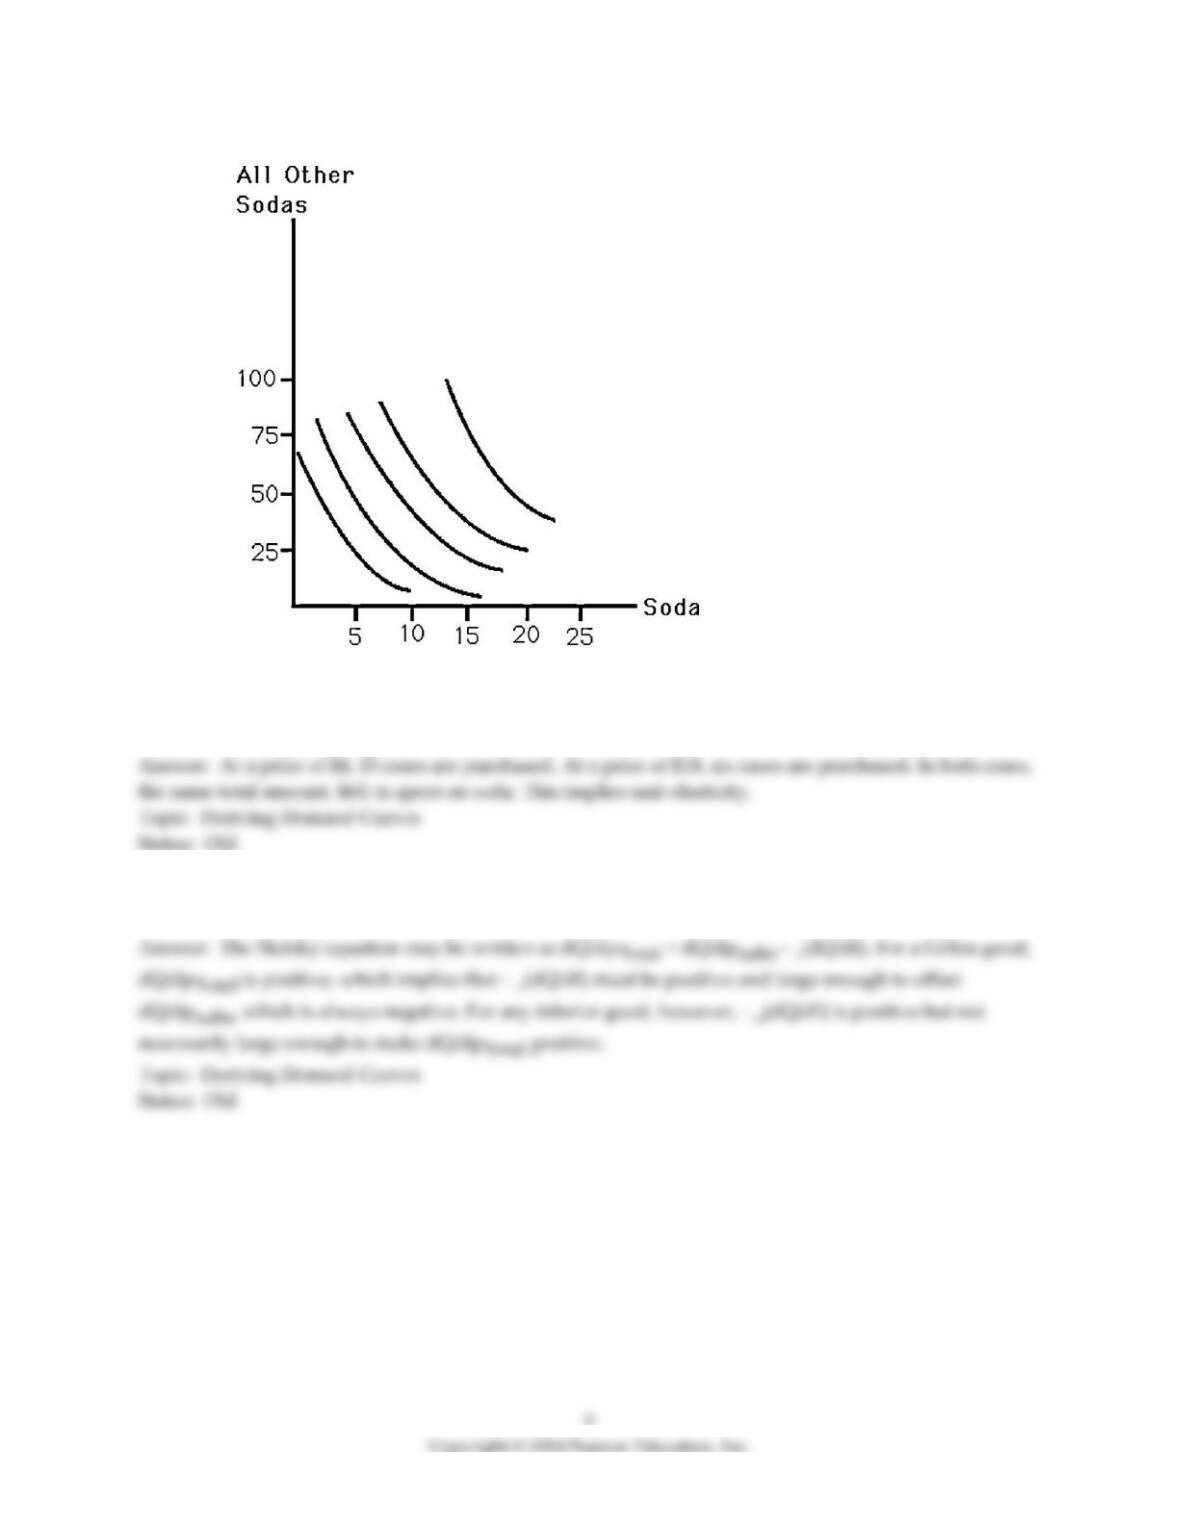
18) The above figure shows a consumer‘s indifference curves for soda and all other goods. Assuming a
budget of $100, derive the consumer’s demand for soda for prices of $4 and $10 per case of soda. Estimate
the price elasticity of demand for soda.
19) Use the Slutsky equation to show that a Giffen good must be an inferior good, BUT an inferior good
need not be a Giffen good.
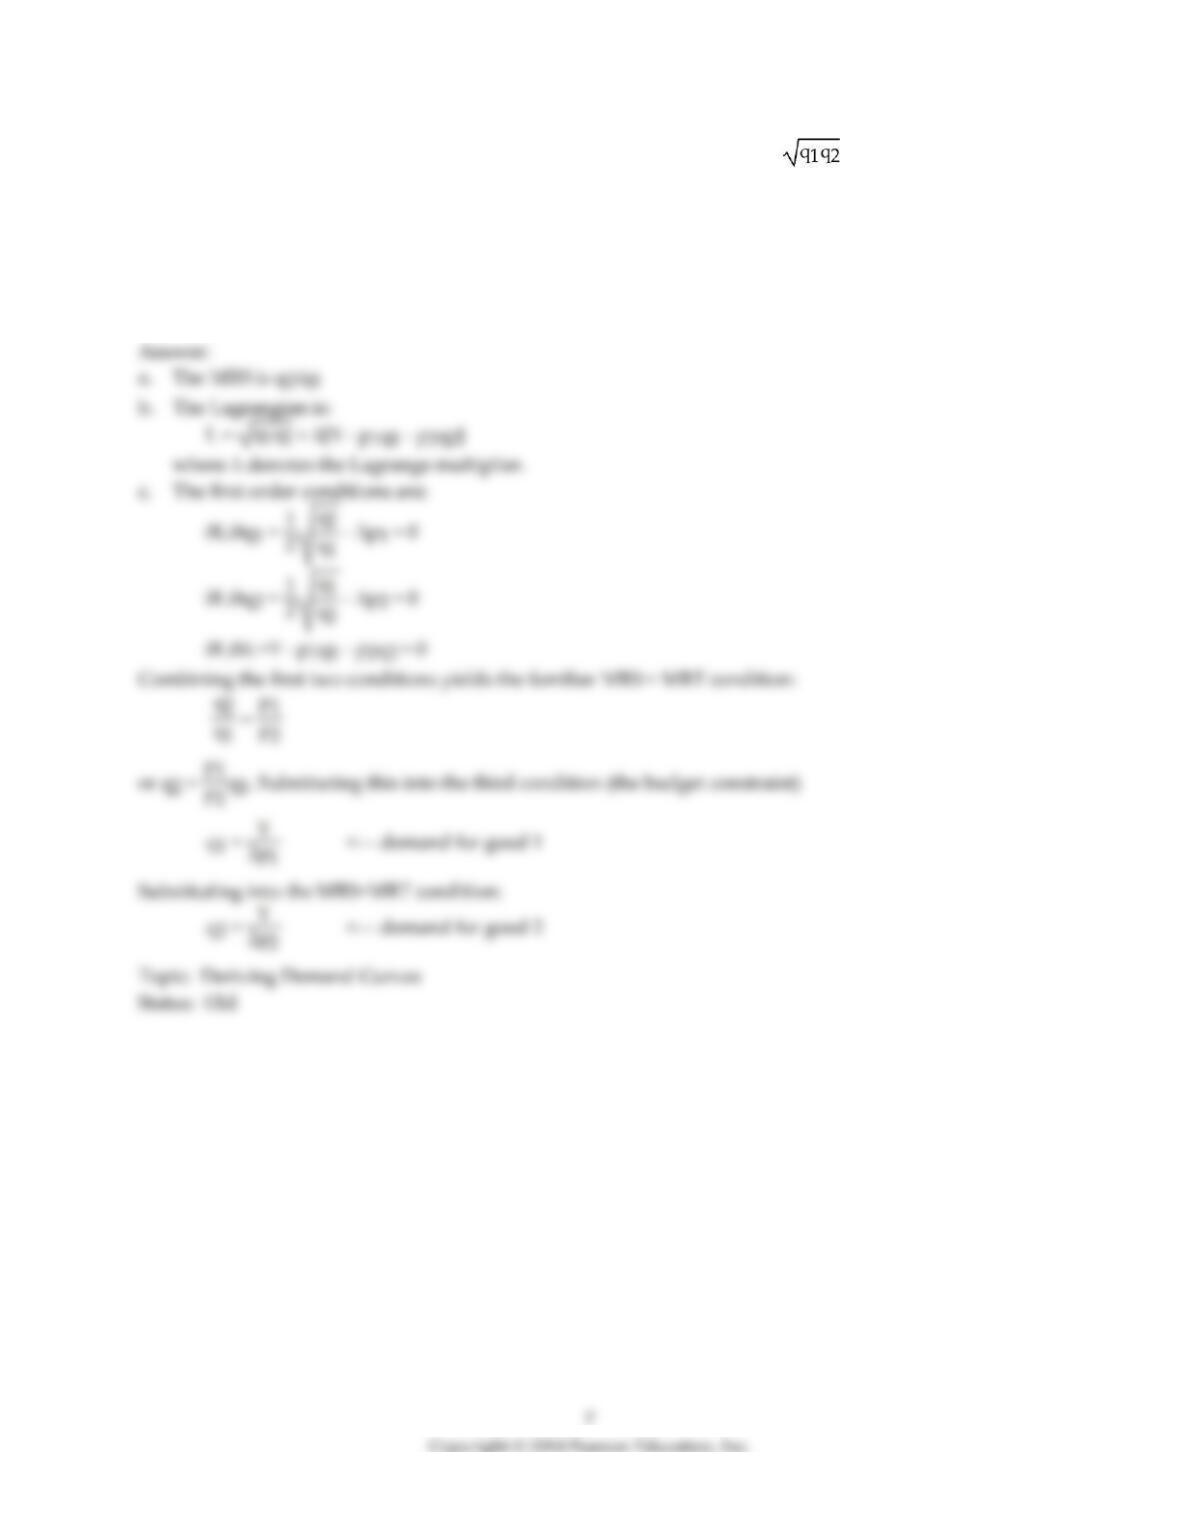
20) Consider a consumer with the Cobb-Douglas utility function U(q1,q2) = , where q1 and q2 are
the quantities of goods 1 and 2 consumed, respectively. This consumer has an income denoted by Y
which is devoted to goods 1 and 2. The prices of goods 1 and 2 are denoted p1 and p2.
a. What is this consumer’s MRS as functions of q1 and q2?
b. Write out the Lagrangian for the consumer‘s utility maximization problem.
c. Using the Lagrangian method, derive the consumer’s demand equations for both goods as functions
of the variables p1, p2, and Y.
21) A consumer has the following utility function for goods X and Y:
U(X,Y) = 5XY3 + 10
The consumer faces prices of goods X and Y given by px and py and has an income given by I.
a. Write out the Lagrangian expression for the consumer’s utility maximization problem.
b. Write out the first order conditions necessary for maximizing utility subject to the budget constraint.
c. Show that the first order conditions imply the budget constraint and MRS condition. Provide the
economic (i.e. non-mathematical) interpretation of these conditions – specifically, why are they necessary
for the consumer to be at the optimal bundle?
d. Solve for the Demand Equations, X*(px,py,I) and Y*(px,py,I)
e. Show that the demand equations are homogeneous of degree zero. That is, show
X*(cpx,cpy,cI) = X*(px,py,I)
for any positive constant, c.
22) Edgar only consumes protein shakes with his income, I. The price of shakes is p.
a. What is Edgar’s demand equation for shakes?
b. Can protein shakes be an inferior good for Edgar? Explain.
c. What is the price elasticity of Edgar’s demand for shakes? Derive using calculus.
d. What is the income elasticity of Edgar’s demand for shakes?
23) Sam has preferences for weekly Video Games (V) and Sodas (S) described by the utility function
U(V,S)=V2S2. Suppose the prices are denoted by pV and pS and Sam has income given by I. Assume that
in Sam’s optimal bundle, he consumes strictly positive quantities of both goods.
a. Write out Sam’s optimization problem and the associated Lagrangian expression.
b. Compute the three critical value (first-order) conditions from the Lagrangian.
c. Using your answer to b, find the expression for the optimal bundles as functions of the prices and
income.
24) Darwin’s preferences are given by U(q1,q2) = q1.5 + q2. Derive the demand equations for q1 and q2.
Assume prices and income are such that both goods are consumed in strictly positive quantities.
25) Jon spends all of his income on energy drinks (E) regardless of the price and his income. Derive Jon’s
demand equation for energy drinks, E*(p,Y).
26) Lewis has preferences given by the Cobb-Douglas utility function U(q1,q2) = q1aq21-a, where a > 0.
Show that Lewis’s total amount spent on each good, does not change with the prices.
27) Dorothy lives in a city with high air pollution. Pollution is a bad, but she is able to avoid air pollution
by wearing a face mask. Her preferences are given by
U(q1,q2) = (q1 – P)2q22
where q1 is the amount of time she spends wearing a mask, P is the amount of pollution and q2 is a
composite of other goods (p2 = 1). Dorothy must decide how much to wear a mask and how much q2 to
purchase. The price of masks is pM. Assume q1* > P when answering this question.
a. Derive Dorothy’s demand for masks, q1*(p1,Y, P)
b. How does the quantity of pollution affect the demand for masks? That is, find q1*/P.
c. How does her income influence the quantity of masks she purchases? That is, find q1*/Y.
d. What condition must hold for the assumption q1* > P to hold?
28) Jose gets utility from the goods he consumes and also the income he earns. His utility function is
given by
U(q1,q2) = q1q2Y
Derive Jose’s demand equations. Does the fact that he derives utility directly from income affect his
consumption in this case?
29) Jose consumes wallets (q1) and a composite of other goods (q2). The price of wallets is p1 and the
price of other goods is p2=1. Jose’s utility from wallets depends also on his income—with a higher
income, he values a wallet more because he has more to put inside it! His utility is given by the equation
U(q1,q2) = q1Yq2
Derive Jose’s demand for wallets.
4.2 Effects of an Increase in Income
1) A movement upward along an upward-sloping Engel curve corresponds to
A) upward-sloping indifference curves.
B) crossing indifference curves.
C) a rotation in the budget constraint.
D) a parallel shift in the budget constraint.
2) When deriving an Engel curve the prices of both goods
A) are held constant.
B) increase by the same percentage as income.
C) decrease by the same percentage as income.
D) can either decrease, increase or stay the same.
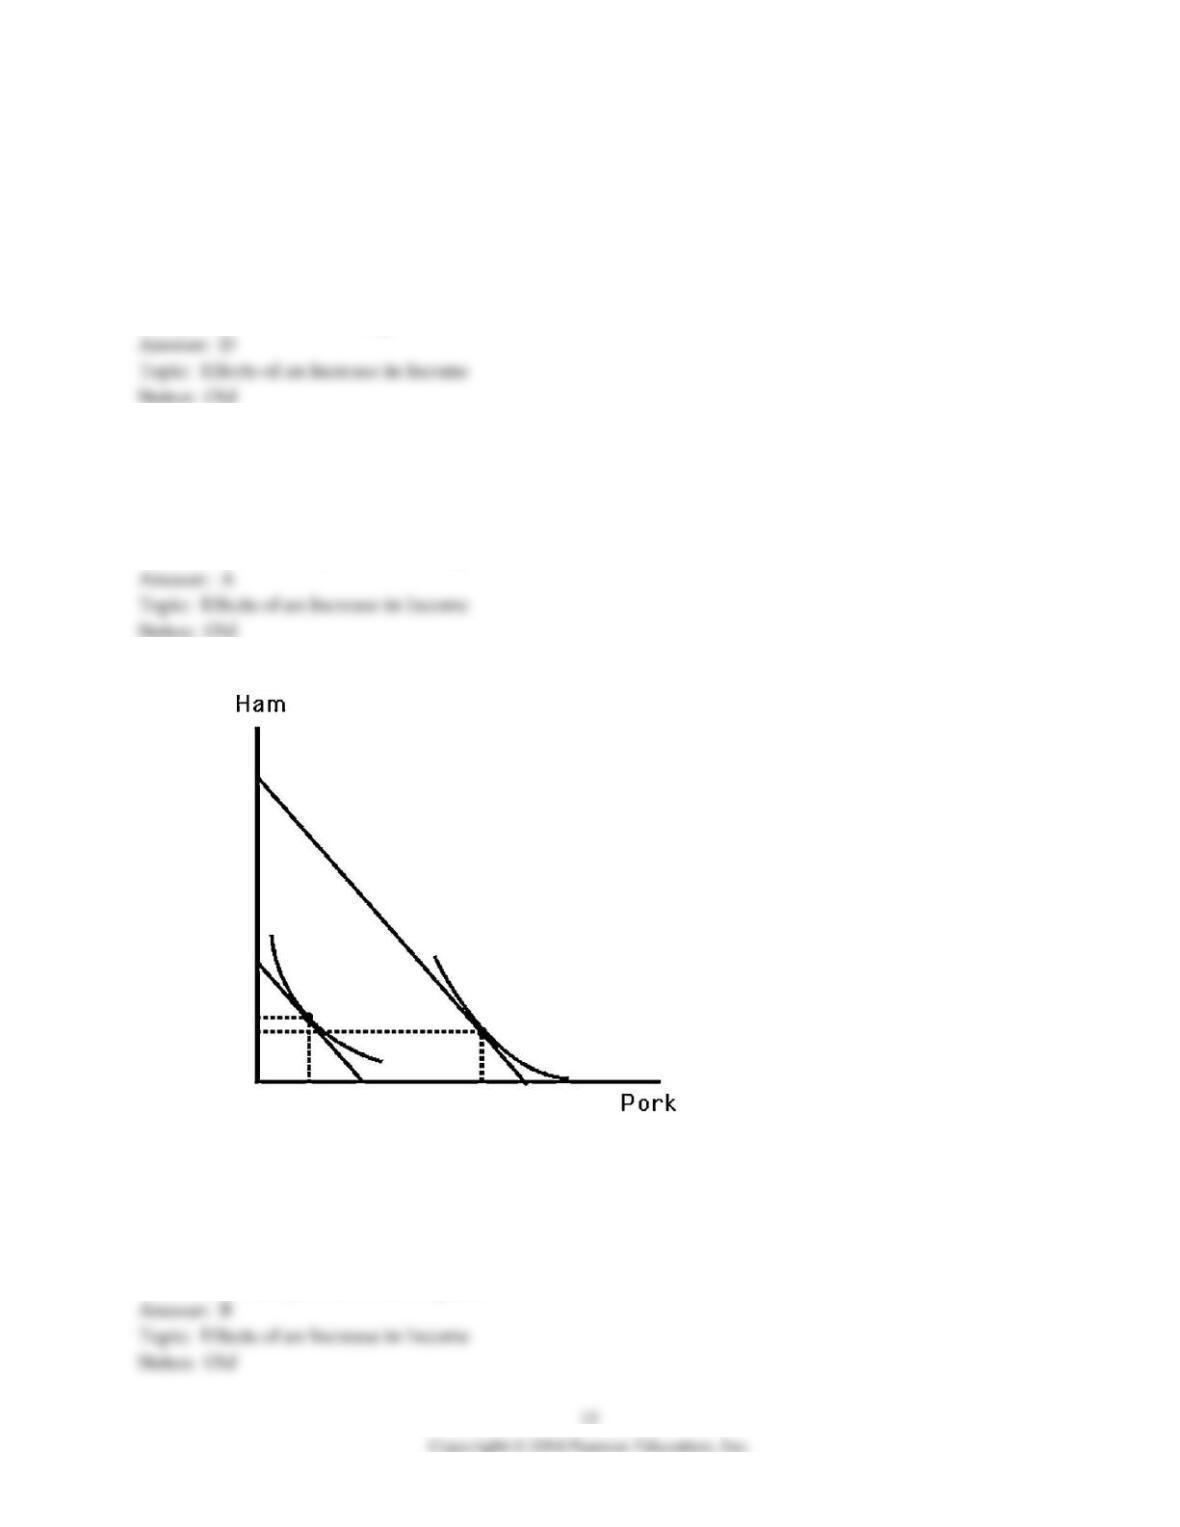
3) The above figure shows Larry’s indifference map and budget lines for ham and pork. Which of the
following statements is TRUE?
A) Pork is an inferior good.
B) Ham is an inferior good.
C) Neither pork nor ham is an inferior good.
D) Both ham and pork are inferior goods.
4) The above figure shows Larry’s indifference map and budget lines for ham and pork. Which of the
following statements is TRUE?
A) Larry’s Engel curve for pork will be upward sloping.
B) Larry’s Engel curve for pork will be downward sloping.
C) Larry’s Engel curve for pork will be backward bending.
D) Larry’s Engel curve for pork cannot be derived from the information provided.
5) The above figure shows Larry’s indifference map and budget lines for ham and pork. Which of the
following statements is TRUE?
A) Larry’s demand curve for pork shifts rightward when his income increases.
B) Larry’s income elasticity of demand for pork is greater than zero.
C) Pork is a normal good.
D) All of the above.
6) After Joyce and Larry purchased their first house, they made additional home improvements in
response to increases in income. After a while, their income rose so much that they could afford a larger
home. Once they realized they would be moving, they reduced the amount of home improvements. Their
Engel curve for home improvements on their current home is
A) negatively sloped.
B) flat.
C) positively sloped.
D) backward bending.
7) Suppose the quantity of x is measured on the horizontal axis. If the income consumption curve is
vertical, then the income elasticity of demand for x is
A) 0.
B) 1.
C) –1.
D) There is not enough information to determine the income elasticity of demand for x.
8) An inferior good exhibits
A) a negative income elasticity.
B) a downward-sloping Engel curve.
C) a decline in the quantity demanded as income rises.
D) All of the above.
9) If the income elasticity of food is 0.72, then food is
A) a necessity and a normal good.
B) a normal good.
C) a necessity.
D) an inferior good.
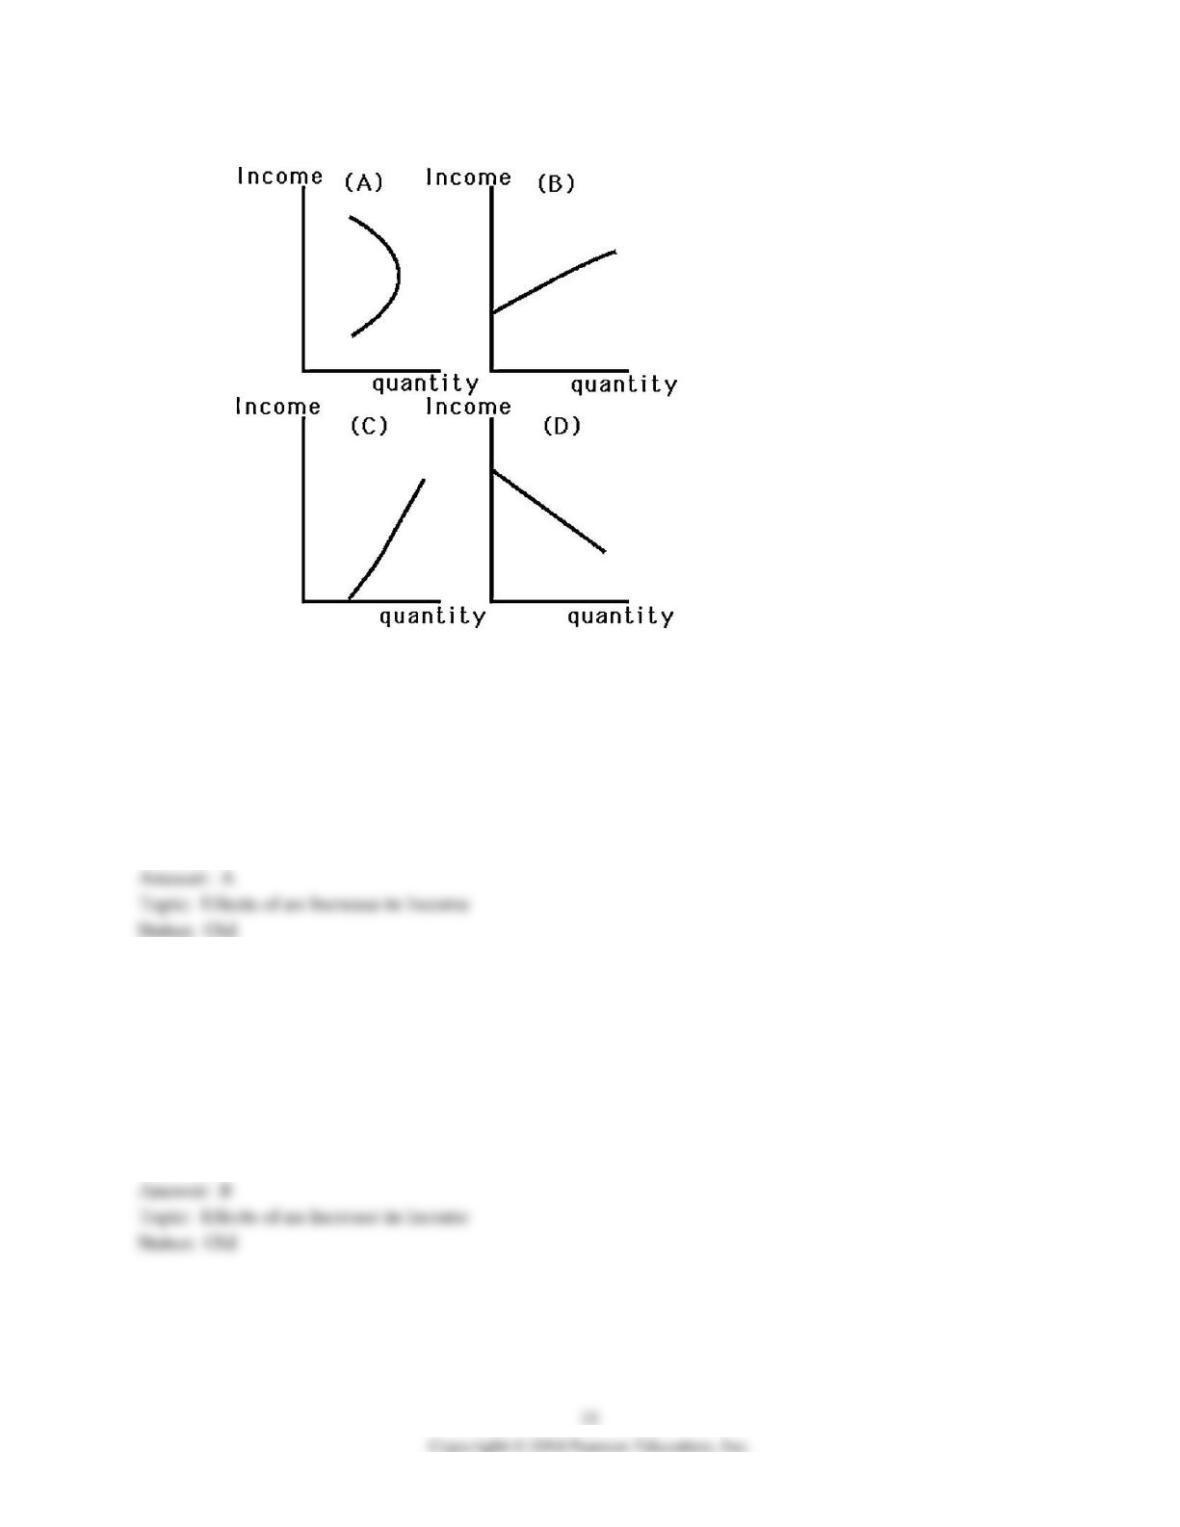
10) When John’s income was low, he could not afford to dine out and would respond to a pay raise by
purchasing more frozen dinners. Now that his income is high, a pay raise causes him to dine out more
often and buy fewer frozen dinners. Which graph in the above figure best represents John’s Engel curve
for frozen dinners?
A) Graph A
B) Graph B
C) Graph C
D) Graph D
11) When John’s income was low, he could not afford to dine out and would respond to a pay raise by
purchasing more frozen dinners. Now that his income is high, a pay raise causes him to dine out more
often and buy fewer frozen dinners. Which graph in the above figure best represents John’s Engel curve
for dining out?
A) Graph A
B) Graph B
C) Graph C
D) Graph D
12) Even though Mary’s income is very low, she makes sure that she purchases enough milk for her
family to drink. As her income rises, she does buy more milk. Which graph in the above figure best
represents Mary’s Engel curve for milk?
A) Graph A
B) Graph B
C) Graph C
D) Graph D
13) When John was in college and his income was low, he drank “Red Ribbon” beer. As his income
increased, he purchased better-quality beer and less “Red Ribbon.” Which graph in the above figure best
represents John’s Engel curve for “Red Ribbon” beer?
A) Graph A
B) Graph B
C) Graph C
D) Graph D
14) Which graph in the above figure best represents a good that is an inferior good at some income levels,
and a normal good at other income levels?
A) Graph A
B) Graph B
C) Graph C
D) Graph D
15) If consumer income and prices increase by the same percentage,
A) the consumer will buy more of both goods.
B) the consumer will buy more of both goods if they are both normal goods.
C) the consumer will buy less of both goods if they are both inferior goods.
D) the consumer’s utility maximizing bundle stays the same.
16) There are only two goods for John to consume: food and clothing. If clothing is an inferior good for
John when his income rises to $100,000, then food is
A) also an inferior good.
B) a normal good.
C) either inferior or normal could be possible.
D) Not enough information
17) If the income elasticity of hamburgers is -0.8 for John, then his share of income spent on hamburgers
will ________ when his income increases.
A) increase
B) decrease
C) remain the same
D) Not enough information
18) Jerry spends his entire income on two goods, Bran and Tea. Every month he spends half of his income
on each of these goods. Jerry’s income elasticity of demand for Bran is .75. What is the income elasticity of
demand for Tea?
A) 1.25
B) .75
C) 1
D) unknown with the information provided
19) Jerry spends his entire income on two goods, Bran and Tea. Every month he spends half of his income
on each of these goods. Jerry’s income elasticity of demand for Bran is -.75. What is the income elasticity
of demand for Tea?
A) 2.75
B) 0.36
C) -2.75
D) unknown with the information provided
For the following, please answer “True” or “False” and explain why.
20) An increase in income (all else equal) will ALWAYS lead to a parallel shift of the budget line.
21) Explain what the slope of the income consumption curve shows about the income elasticity of
demand.
22) Why can’t all goods be inferior?
23) The above figure shows three different Engel curves. Rank them in terms of income elasticity.
24) When income increases by 1%, the quantity demanded of a good decreases by 2%. What is the income
elasticity of the good? Is the good normal or inferior? Why?
25) Why would you expect the demand for diamond jewelry to fall faster than plastic, costume jewelry
when all incomes fall?
26) Draw budget constraints, indifference curves, and the income consumption curve for a good that has
an income elasticity that is perfectly inelastic.
27) Sylvia allocates her monthly income between Food and Housing. Her budget share spent on food in a
given month is always 30%, and for Sylvia, food is a “necessity” (income elasticity between zero and one).
Derive the maximum and minimum values for the income elasticity of demand for housing.
28) A typical consumer spends 30% of income on housing and housing is a necessity for consumers (the
income elasticity for housing is 0 < ζH < 1). What are the maximum and minimum values for the income
elasticity of all other goods, ζO?
29) Jill consumes nothing but soup and cola. It is possible that both soup and cola are necessities for Jill.
30) Jill consumes nothing but soup and cola. If cola is a luxury good for Jill, then soup must be a
necessity.