
50. According to the structural stagnation theory,
A. U.S. economic growth will return to the world average growth rate, but by that time the U.S.
share of world output will have declined.
B. U.S. economic growth will return to the world average growth rate and its current share of
world output.
C. U.S. economic growth will never return to the world average growth rate because foreign
economies have so far to catch up.
D. After a period of slower growth U.S. economic growth will exceed world growth.
51. When did structural stagnation begin according to the hypothesis?
A. The mid-1960s
B. The mid-1970s
C. The mid-1980s
D. Tmid-1990s
52. In the globalized AS/AD model, the world supply curve is:
A. horizontal.
B. downward-sloping.
C. vertical.
D. upward-sloping.

53. If foreign producers can supply an infinite amount of tradable goods at the world price, this
would imply that the world supply curve is:
A. horizontal.
B. downward-sloping.
C. vertical.
D. upward-sloping.
54. Looking at the globalized AS/AD model, the economy can exceed potential output without
generating accelerating goods inflation because:
A. the world price level puts a cap on the domestic price level.
B. the domestic price level always exceeds the world price level.
C. the world price level always exceeds the domestic price level.
D. the LRAS curve is no longer vertical.
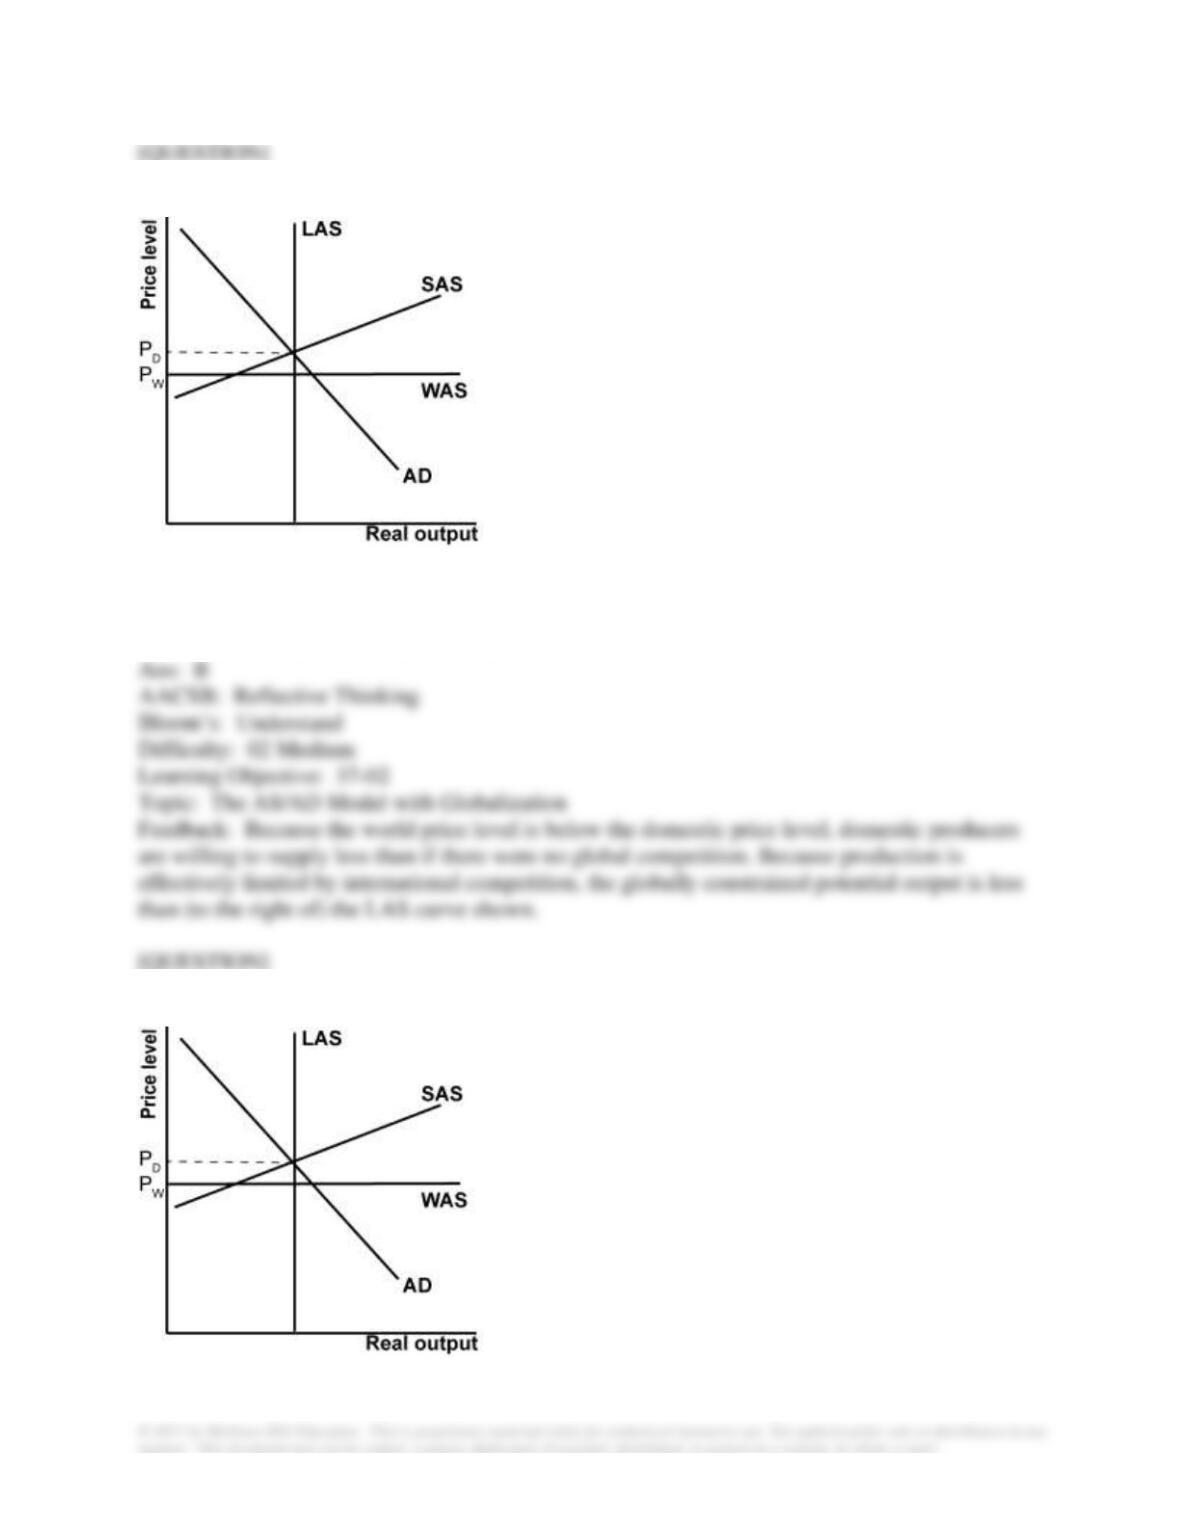
55. Which of the following statements best describes the figure shown?
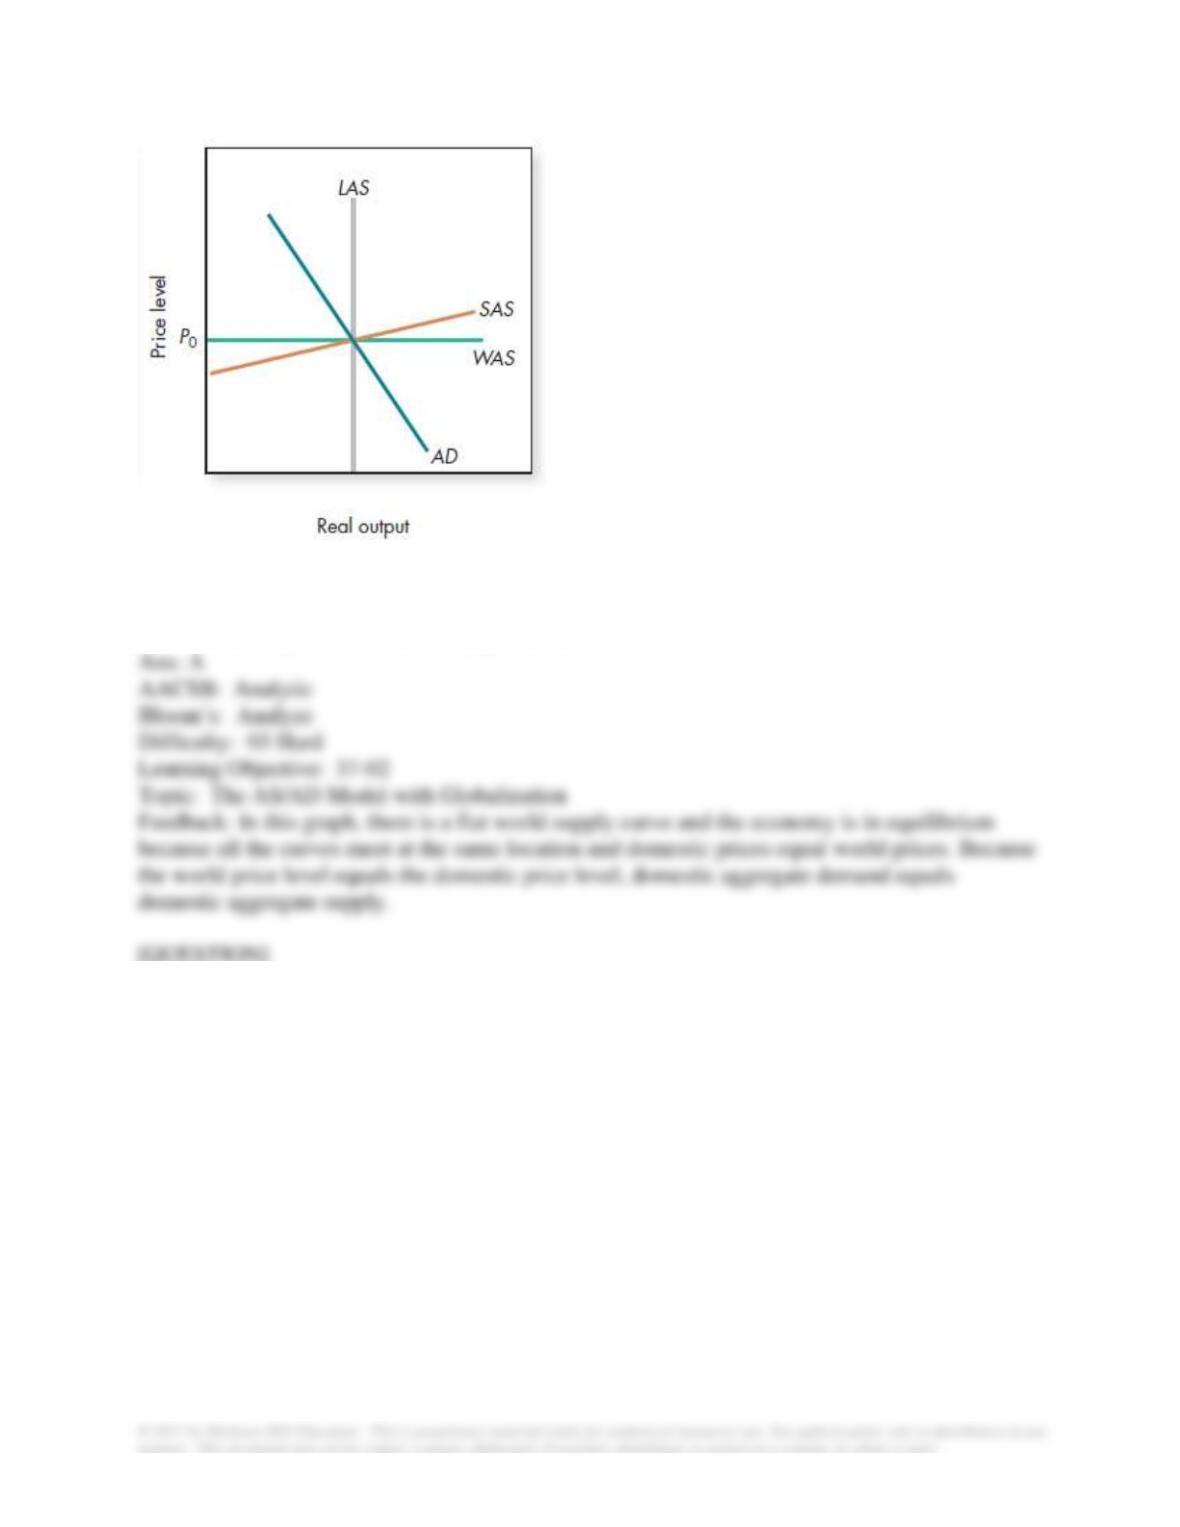
A. The world price level equals the domestic price level.
B. The economy is operating below potential because of globalization.
C. Domestic aggregate supply is less than domestic aggregate demand.
D. Potential output is constrained by globalization.
56. In the figure shown,
A. there is a trade deficit because of globalization.
B. there is a trade surplus because actual output equals potential output.
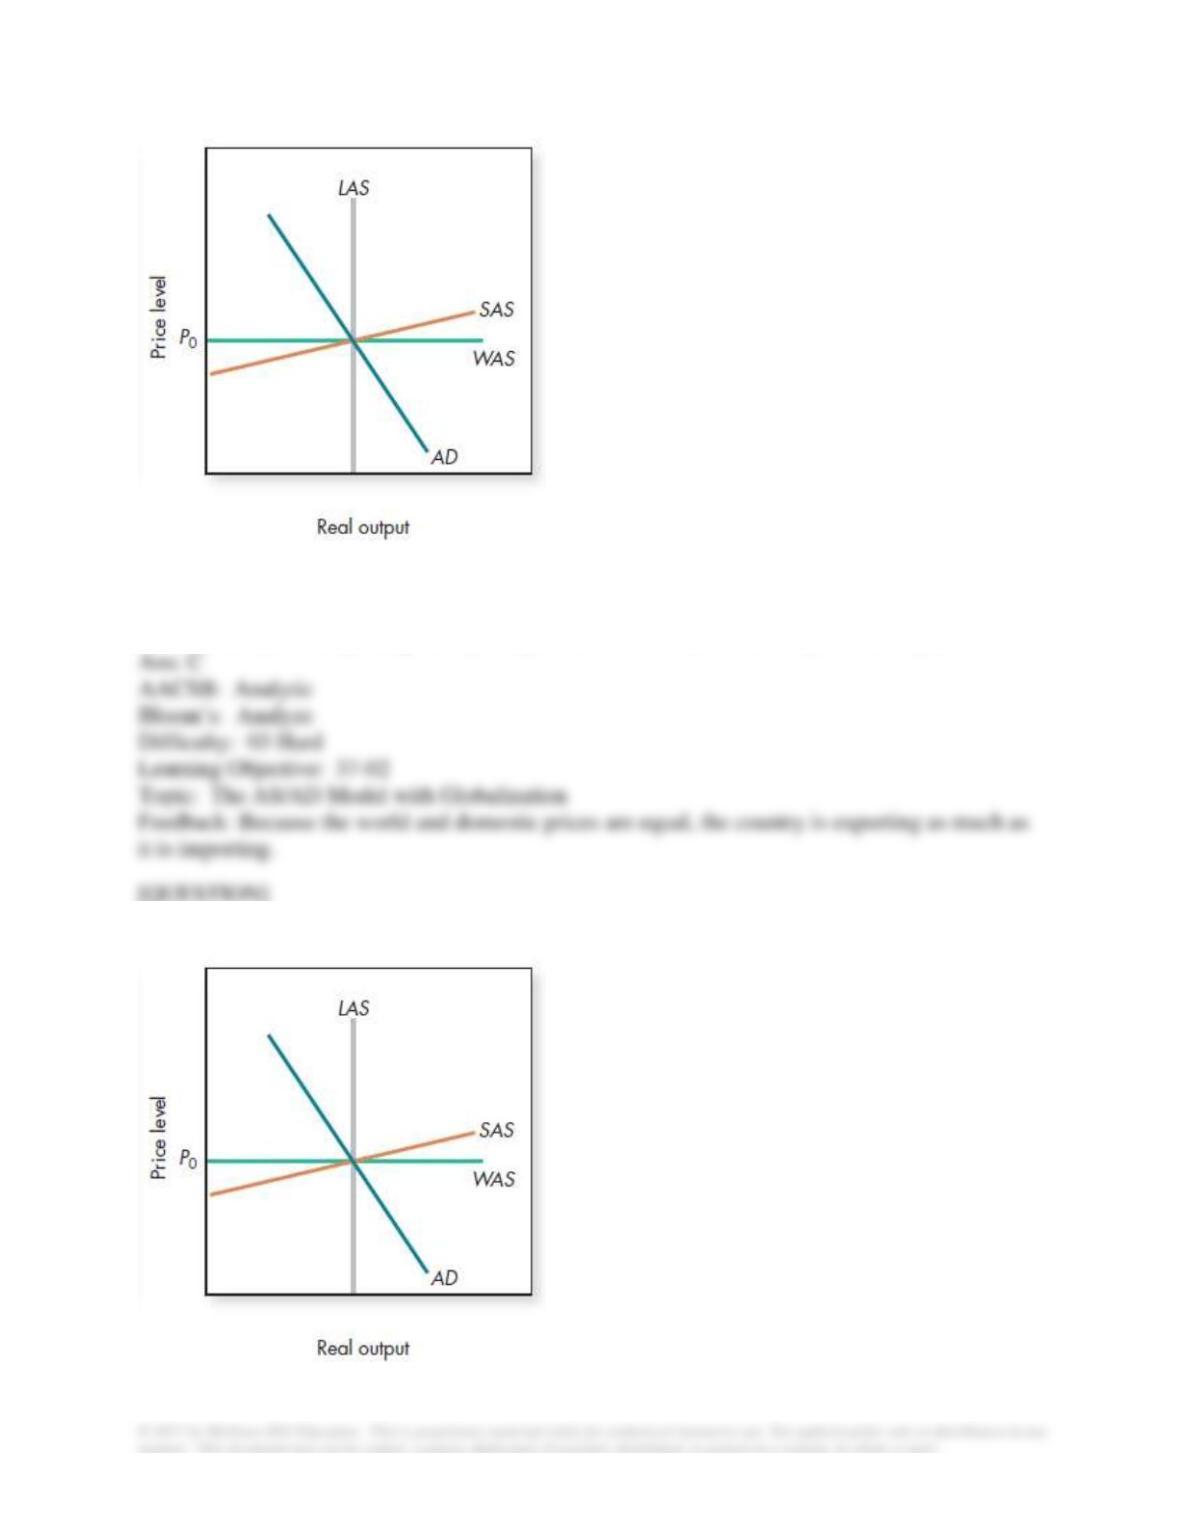
C. there is a trade balance because the world price level equals the domestic price level.
D. the country isn’t exporting or importing because world and domestic prices are equal.
57. In the figure shown, domestic production
A. exceeds global constrained potential output.
B. is less than exports less imports.
C. exceeds global constrained prices.
D. equals domestic consumption.
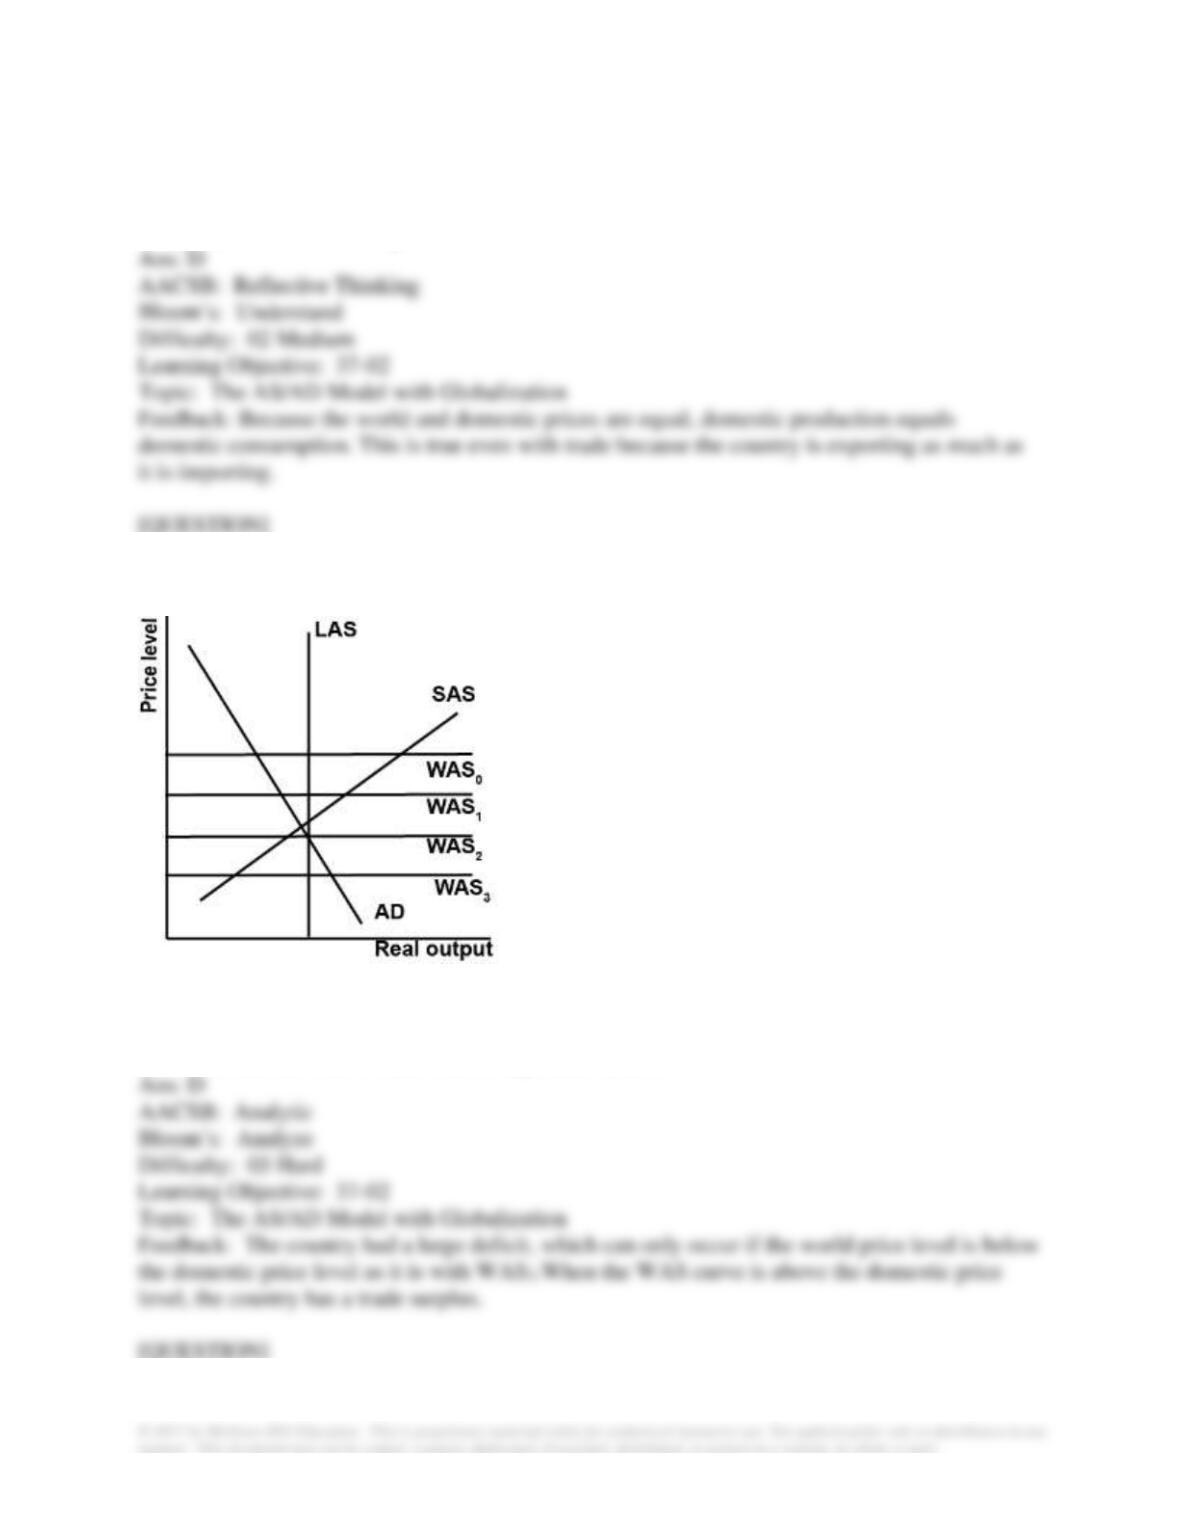
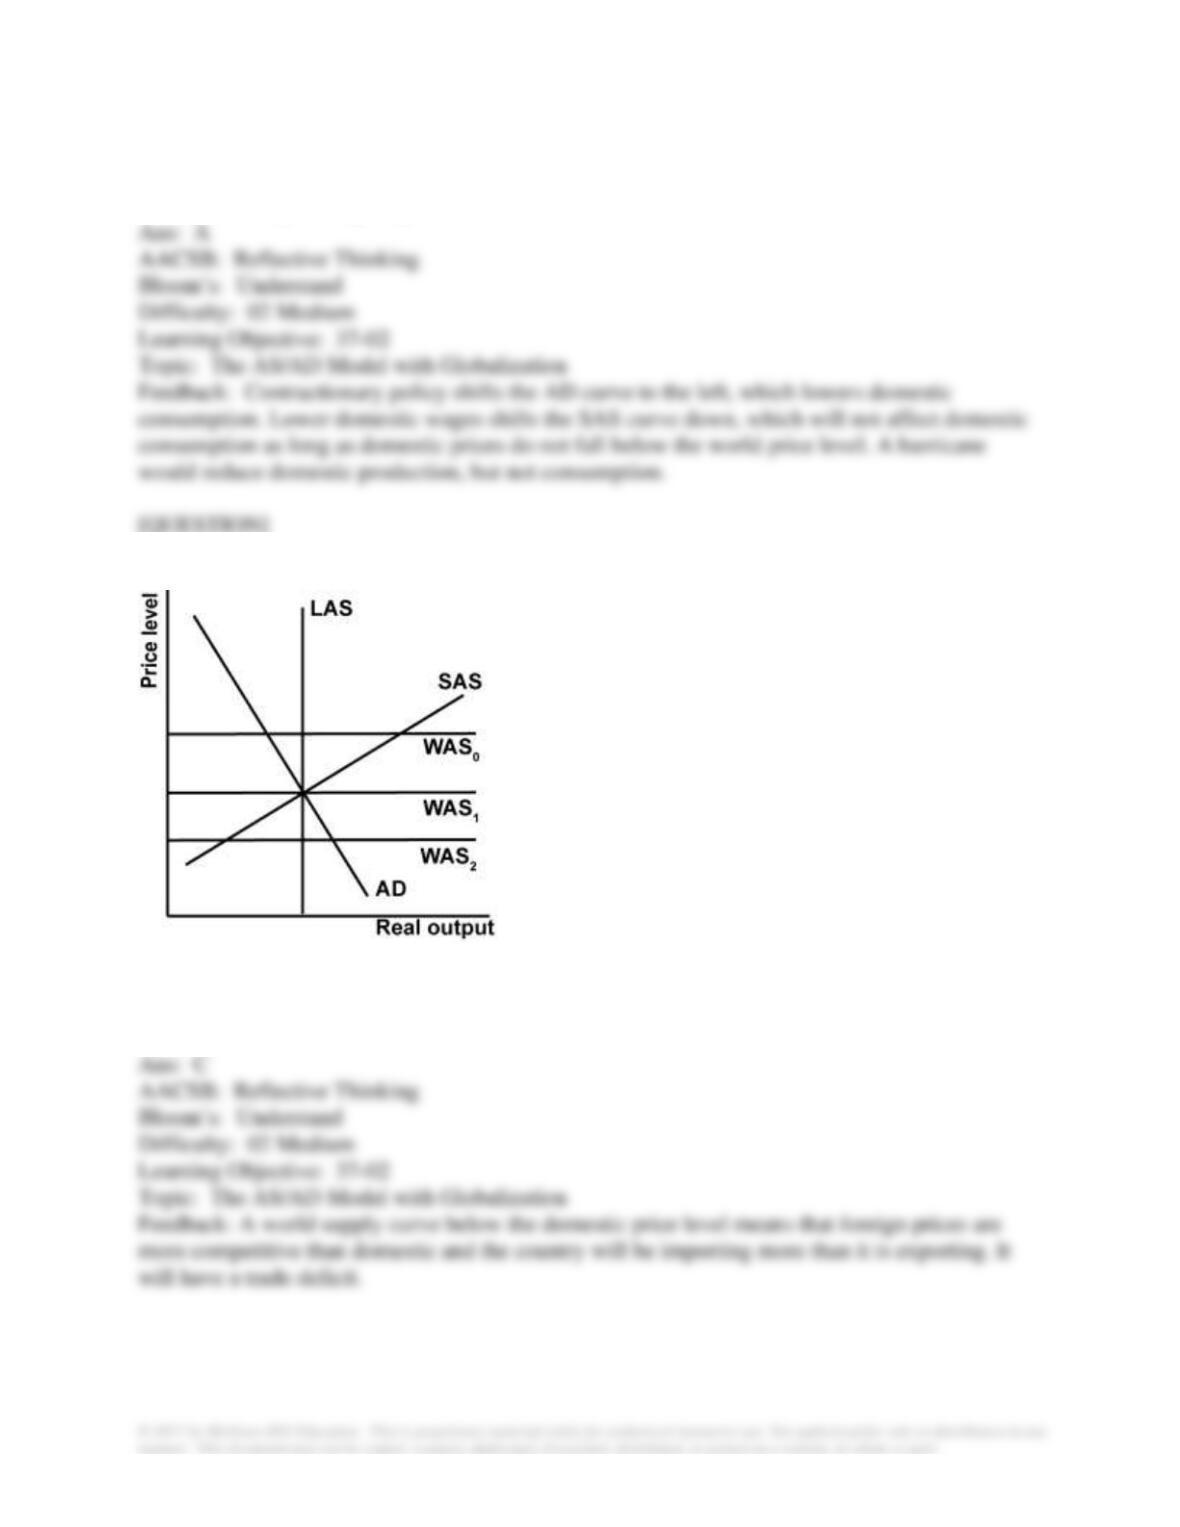
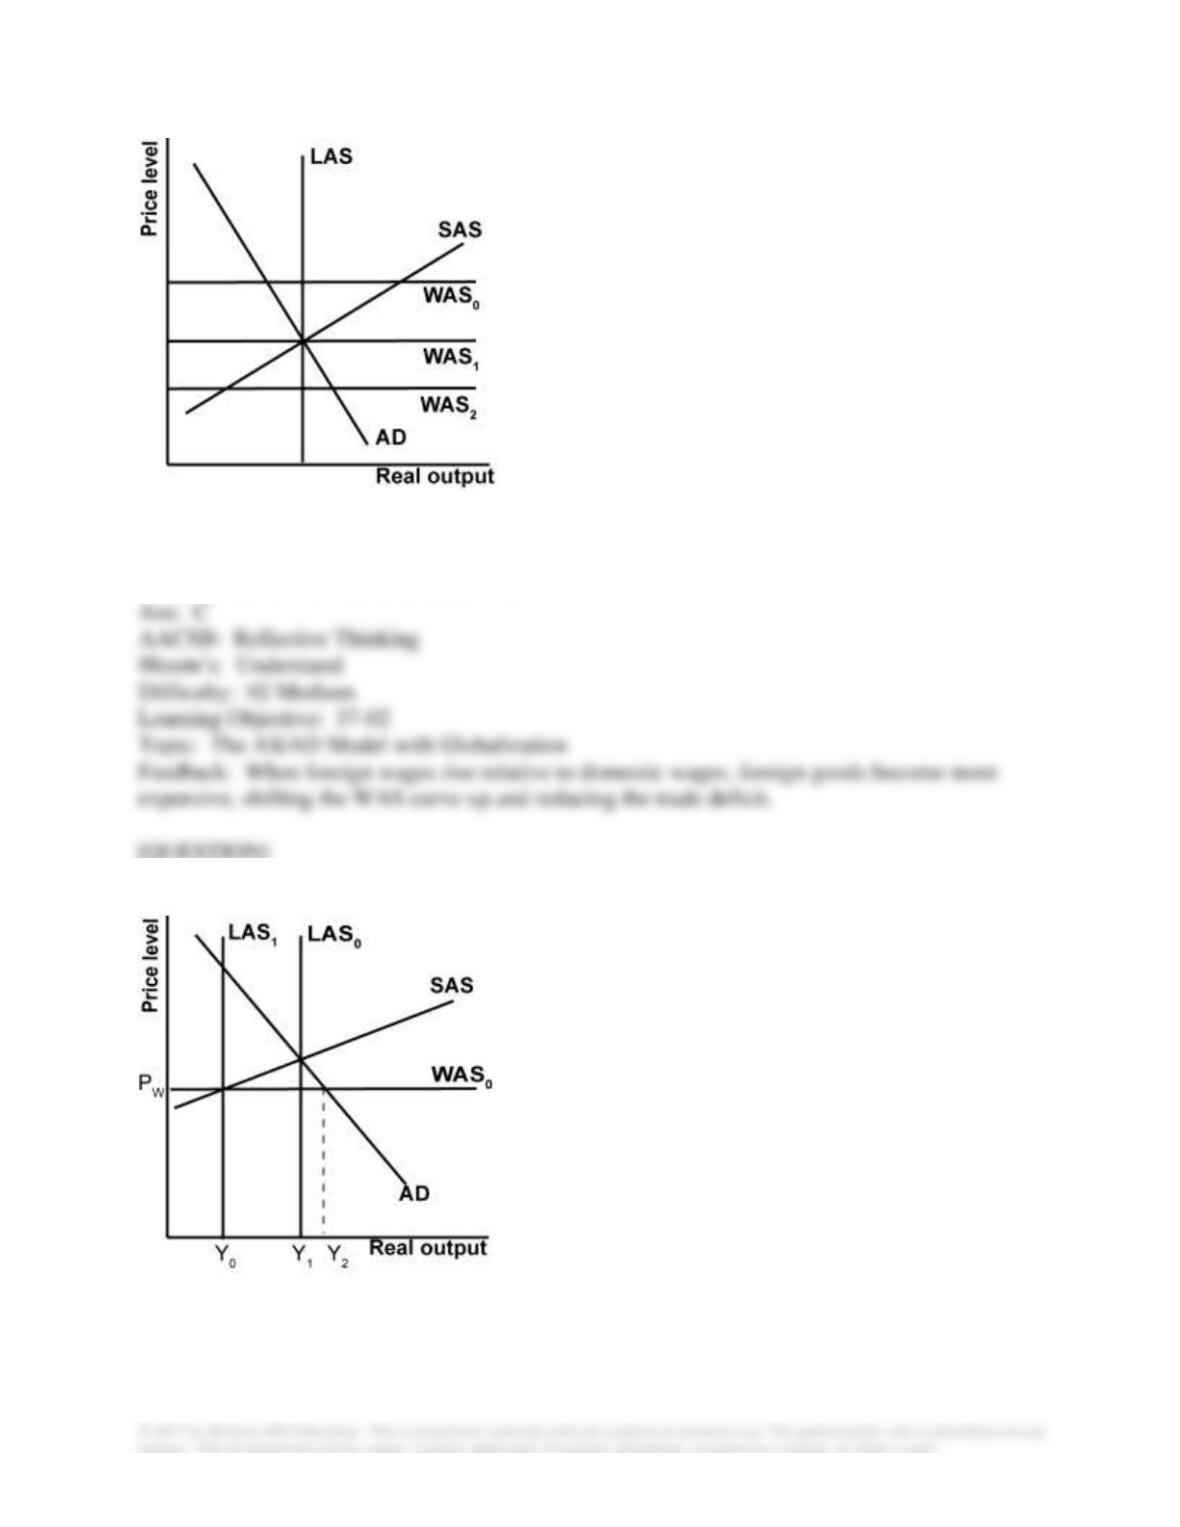
58. Refer to the graph shown. According to the globalized AS/AD model, which best represents
to the world aggregate supply and trade in the 2000s?
A. WAS0 and the United States had a large trade surplus.
B. WAS1 and the United States had a small trade deficit.
C. WAS2 and the United States had a small trade surplus.
D. WAS3 and the United States had a large trade deficit.

59. According to the globalized AS/AD model, expansionary monetary policy shifts the AD
curve to the right and:
A. increases goods inflation.
B. has no effect on goods inflation.
C. shifts potential output to the right.
D. shifts potential output to the left.
60. The globalized AS/AD model relates:
A. to tradable goods only.
B. directly to both tradable and non-tradable goods.
C. to tradable services only.
D. directly to tradable and indirectly to non-tradable goods.
61. Adding globalization with large trade deficits to the standard AS/AD model shows:
A. reduced domestic production and consumption.
B. increased domestic production and consumption.
C. increased domestic production and reduced consumption.
D. decreased domestic production and increased consumption.

62. How is the globalized AS/AD model different from the standard AS/AD model?
A. It has an added world demand curve.
B. The AD curve is upward sloping.
C. It has an added world supply curve.
D. The AS curve is downward sloping.
63. The globalized AS/AD curve is the standard AS/AD model with an added:
A. world demand curve.
B. domestic supply curve.
C. world supply curve.
D. long-run aggregate supply curve.
64. Based on what we know about the globalized AS/AD model, the standard model does not
include an analysis of:
A. investment.
B. government spending in the United States.
C. net exports.
D. consumption.
65. In the globalized model, the eventual equivalency of domestic and world prices follows from
the:
A. law of demand.
B. law of supply.
C. law of comparative advantage.
D. law of one price.
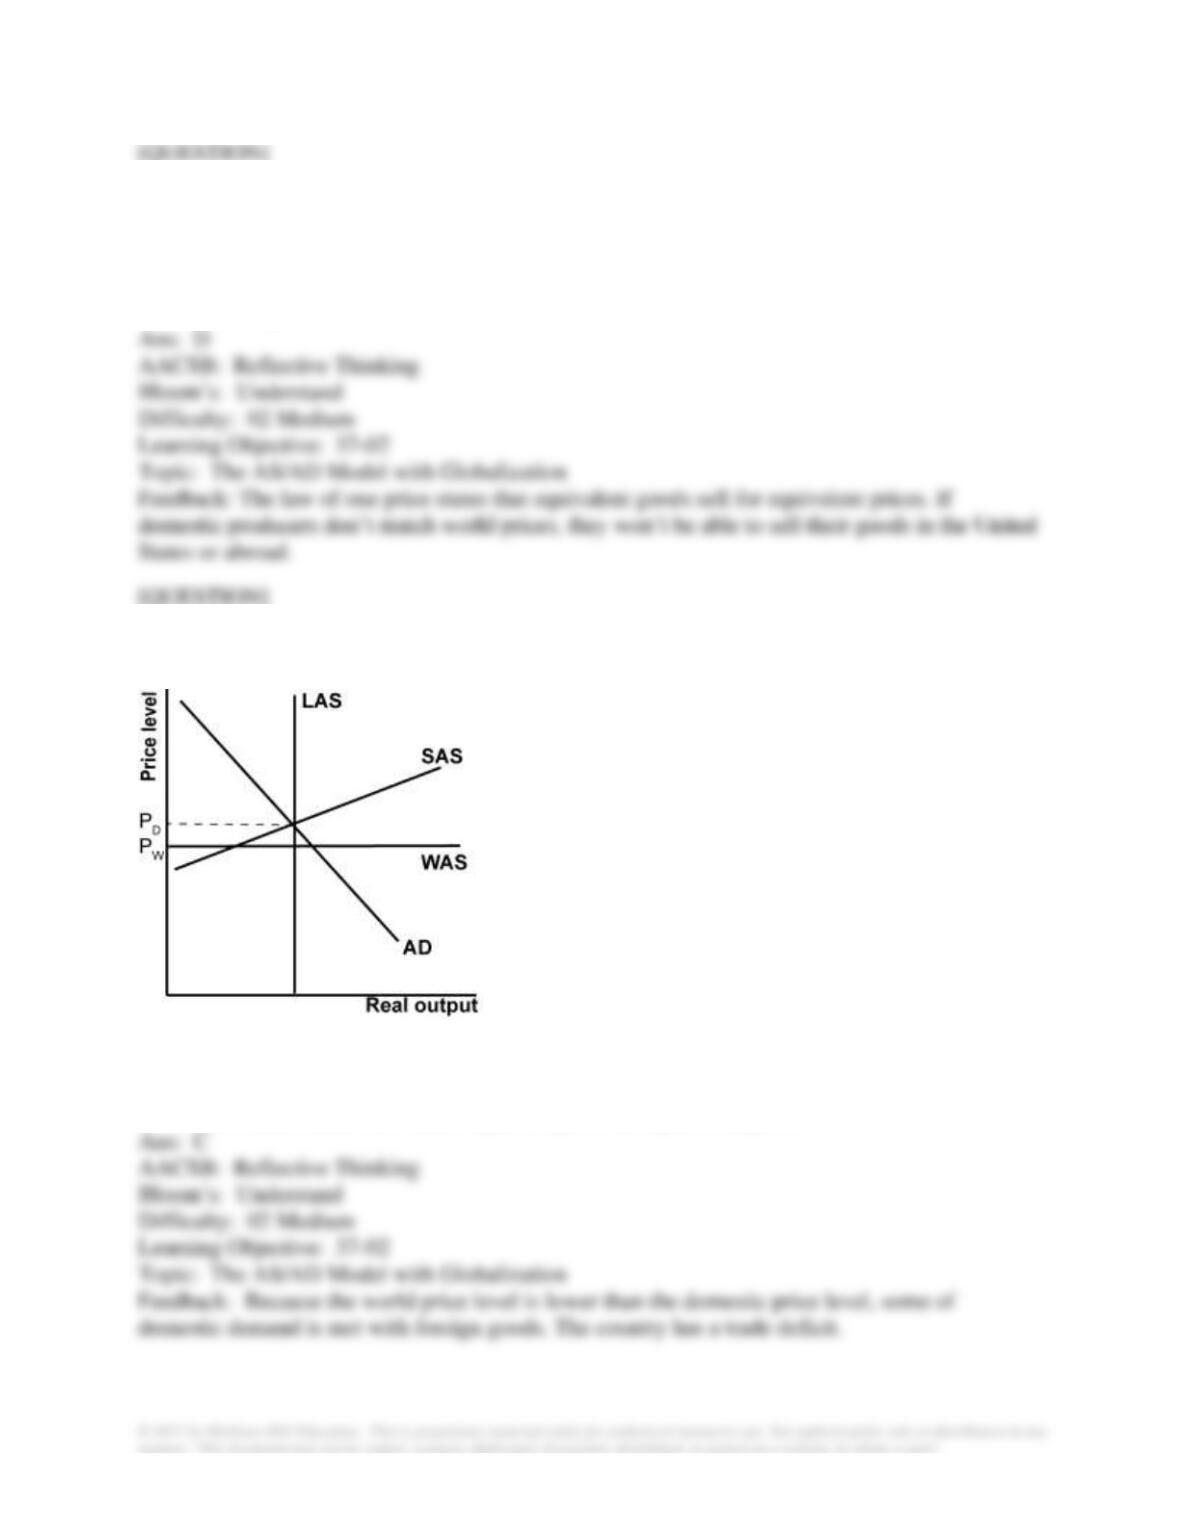
66. In the graph shown, the country has:
A. a trade surplus.
B. a budget deficit.
C. a trade deficit.
D. neither a trade deficit nor trade surplus; exports are equal to imports.
67. In the graph shown, the globally constrained potential output is:
A. to the right of the LAS curve shown.
B. to the left of the LAS curve shown.
C. the same as the LAS curve shown.
D. the LAS curve shown, but horizontal.
68. In the graph shown, what could balance the trade deficit by reducing domestic consumption?
A. Contractionary monetary policy.
B. Lower domestic wages.
C. A hurricane that damages domestic manufacturing plants.
D. Expansionary fiscal policy.
69. In the graph shown, which of the world supply curves creates a trade deficit?
A. WAS0.
B. WAS1.
C. WAS2.
D. None create deficits.
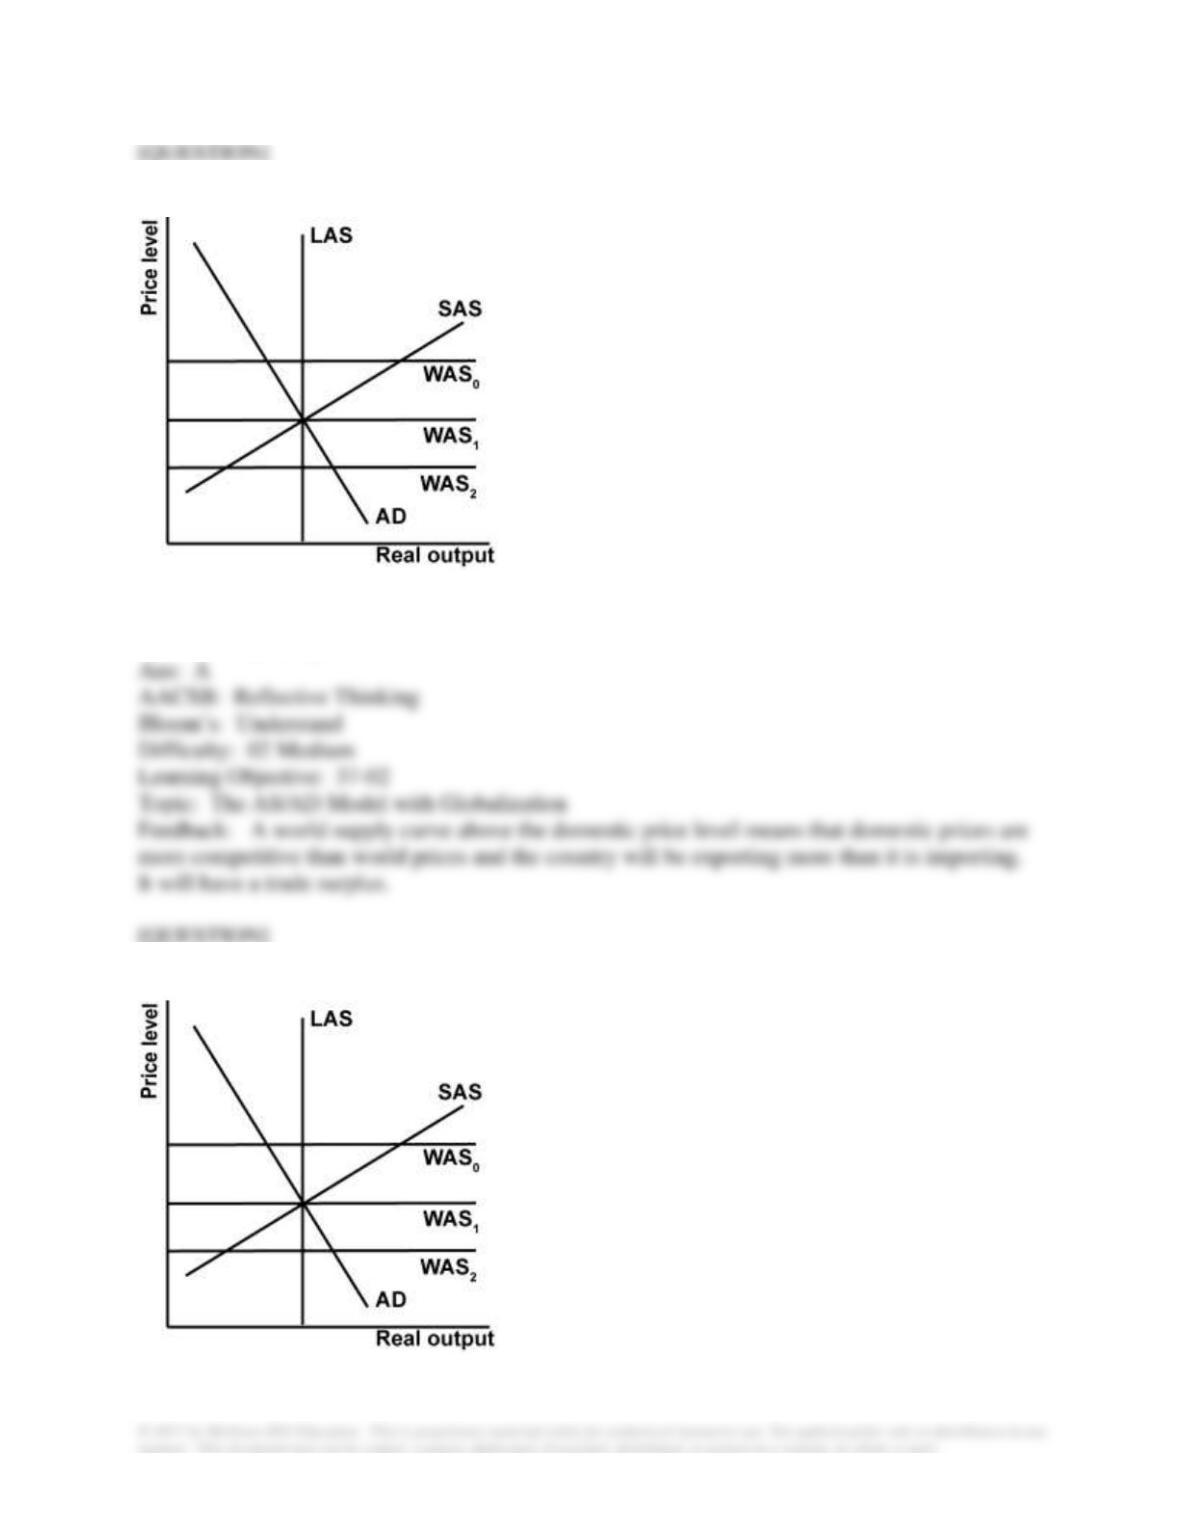
70. In the graph shown, which of the world supply curves creates a trade surplus?
A. WAS0.
B. WAS1.
C. WAS2.
D. None create surpluses.
71. In the graph shown, which of the world supply curves is associated with a trade balance?
A. WAS0.
B. WAS1.
C. WAS2.
D. None create surpluses.
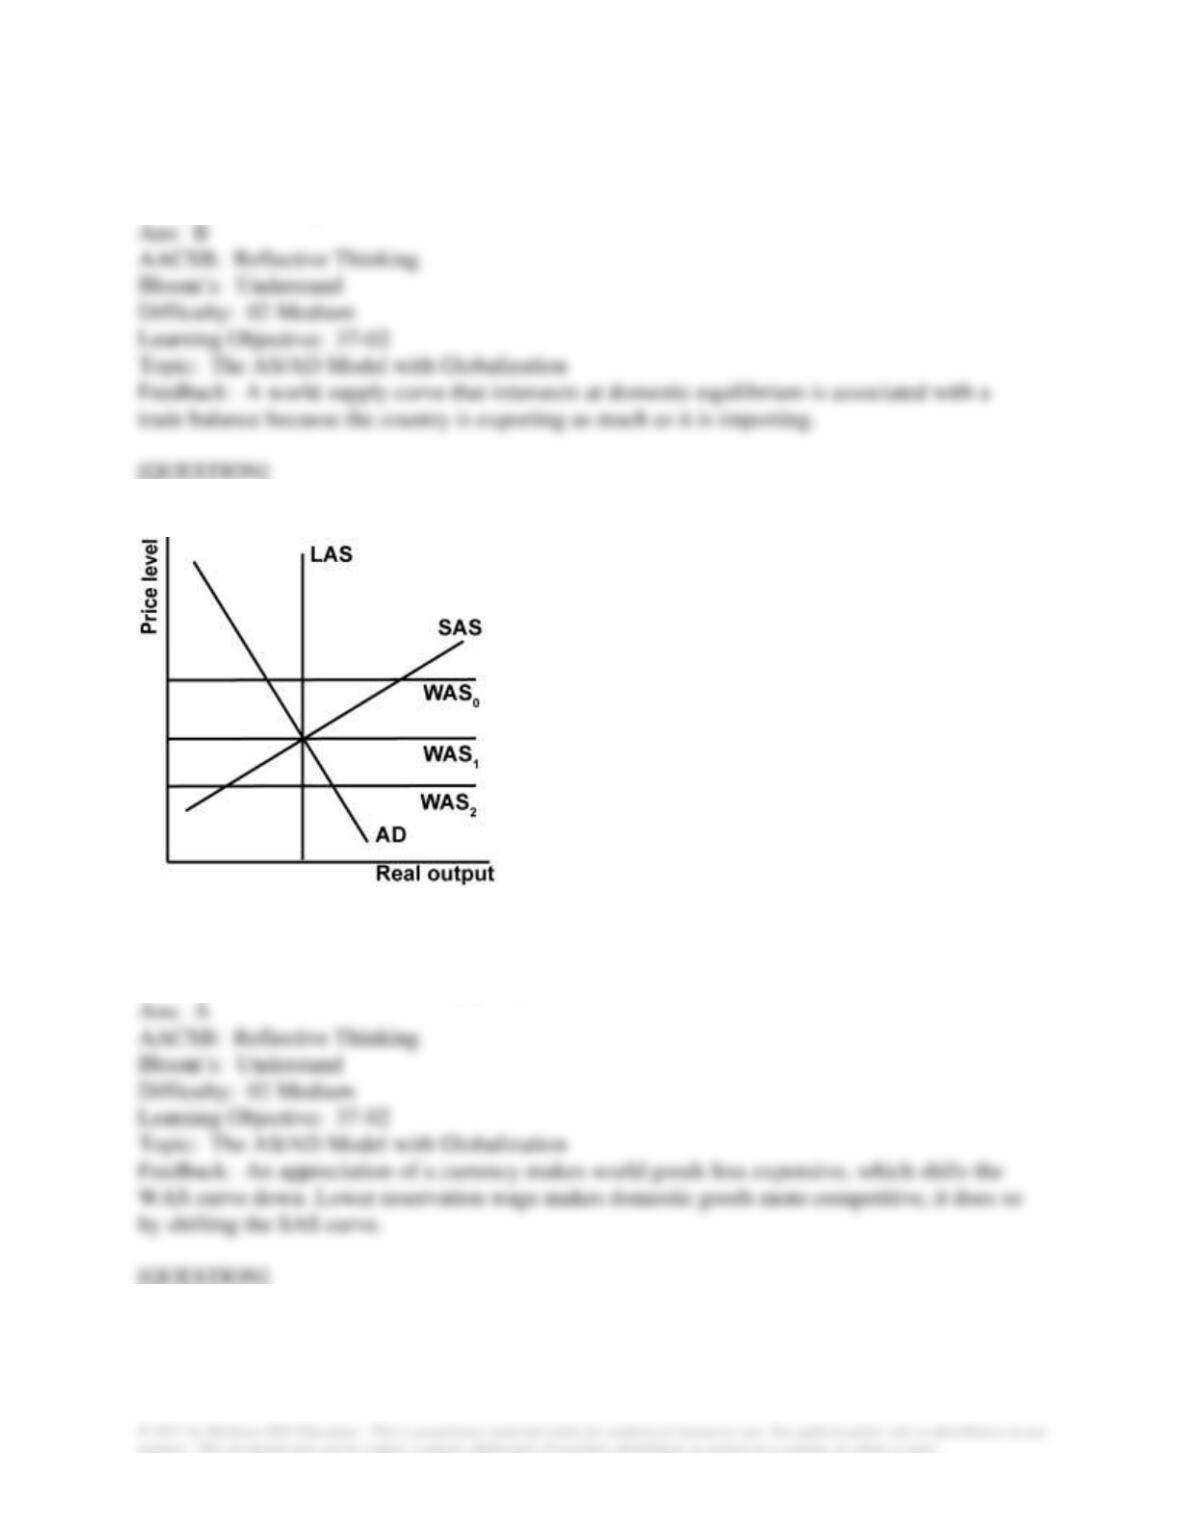
72. In the graph shown, what would shift the WAS curve from WAS0 to WAS1?
A. The country’s exchange rate appreciates.
B. Domestic reservation wages fall.
C. Input prices fall.
D. Government runs contractionary policy.
73. In the graph shown, what would eliminate a trade deficit if there were one?
A. The exchange rate appreciates.
B. Domestic reservation wages rise.
C. Foreign wages rise relative to domestic wages.
D. Government runs expansionary policy.
74. In the graph shown, what represents the trade deficit?
A. Y2 – Y1.
B. Y2 – Y0.
C. Y0.
D. Y1.
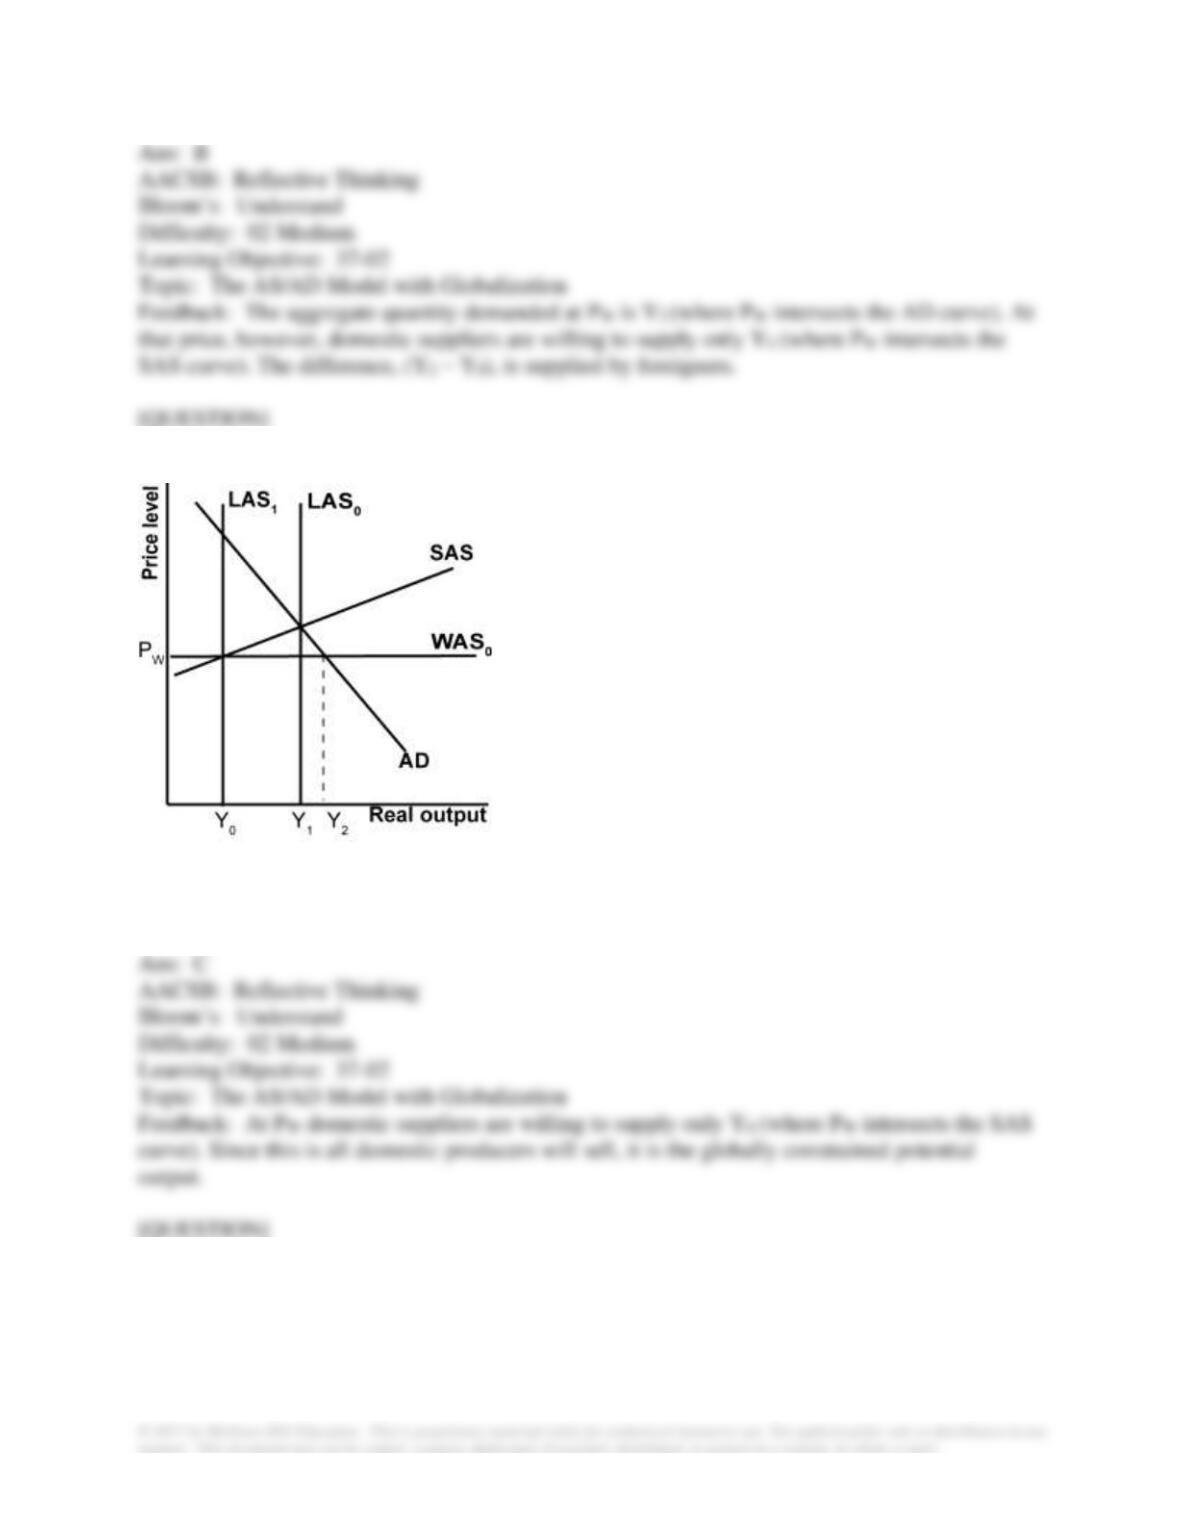
75. In the graph shown, what is globally constrained potential output?
A. Y2 – Y1.
B. Y2 – Y0.
C. Y0.
D. Y1.
76. In the graph shown, a shift in the AD curve to the right: