File: Chapter 37 Structural Stagnation and Globalization
True/False
[QUESTION]
1. The U.S. economy is currently experiencing a standard business cycle.
2. According to the structural stagnation hypothesis, structural stagnation has only short-run
causes.
3. To remain on its growth trend, an economy must grow more in an expansion then it fell during
the recession.
4. The economy recovered quickly from the 2007 recession to return to its trend growth path..
5. The housing market boom raised people’s perceived wealth.
6. The United States has done very poorly at the high end of the value-added chain.
7. If an economy has a trade deficit, shifting the domestic SAS curve down will shift the globally
constrained potential output to the right.
8. The higher the reservation wage the more likely one is to be unemployed.
9. A trade surplus results when the world supply curve is below the domestic economy’s price
level.
10. Structural problems associated with globalization are no longer a concern for policy makers
or economists.
11. According to structural stagnationists, expansionary monetary and fiscal policy has allowed
the economy to address its structural problems and allow the economy to adjust in an expedient
manner.
12. The globalized AS/AD model takes trade into account while the standard AD/AS model does
not.
13. Structural stagnation requires difficult supply-side structural changes to accompany any
demand-side stimulus if it is to be successful in reducing unemployment significantly.
14. When the financial crisis occurred policy makers were more concerned about the deficit than
they were about addressing the financial crisis.
15. The government can deal with the effects of the decline in wealth without causing new
problems down the road.
Multiple Choice Questions
[QUESTION]
16. According to the structural stagnation hypothesis, what is the long-run cause of the recent
problems facing the United States?
A. Globalization.
B. Too low investment.
C. Inflation.
D. Unemployment.
17. According to the structural stagnation hypothesis, expansionary macro policy tends to lead
to:
A. goods inflation.
B. goods deflation
C. asset price inflation.
D. low exchange rates.
18. Suppose an economy’s trend growth rate is 3% and current output is $10 trillion. If the
economy enters a recession where output declines by 5% in one year, by how much does output
have to rise to return the economy back to its trend? Assume it takes two years for the economy
to return to its trend.
A. $0.5 trillion.
B. $0.6 trillion.
C. $1.4 trillion.
D. $1.7 trillion.
19. What is the difference between the structural stagnation hypothesis and secular stagnation
theory?
A. Structural stagnation sees globalization as the cause of a stagnation, while secular stagnation
sees too little investment as the cause.
B. Structural stagnation sees too little investment as the cause of a stagnation, while secular
stagnation sees globalization as the cause.
C. Structural stagnation sees foreign countries moving down the value added chain as the cause
of a stagnation, while secular stagnation sees foreign countries moving up the value added chain
as the cause of a stagnation.
D. There is no difference, they both attribute stagnation to too little investment.
20. Compared to earlier recessions, in the 2008 downturn employment:
A. took longer to return to its pre-recession peak.
B. returned to its pre-recession peak in less time.
C. took about the same amount of time to return to its pre-recession peak.
D. Changes in employment cannot be compared across recessions because every recession is
different.
21. The time it has taken for employment to return to its pre-recession level has:
A. stayed about the same.
B. fallen over time.
C. risen over time.
D. shown no trend.
22. The central difference between the standard theory and the structural stagnation hypothesis
when it comes to growth is:
A. the level of inflation.
B. the trend growth rate.
C. the federal funds rate.
D. the natural rate of unemployment.
23. The hypothesis about the macro economy that sees the recent problems of the U.S. economy
directly related to the structural problems caused by globalization is referred to as the ________
hypothesis.
A. low investment
B. secular stagnation
C. structural stagnation
D. comparative stagnation
24. What does the structural stagnation hypothesis say about how soon the economy will return
to its trend growth?
A. The economy has already returned to its previous trend growth rate.
B. The economy will return to its previous trend growth rate soon.
C. It will be long time before the economy returns to its previous trend growth rate.
D. The economy will never return to its previous trend growth rate.
25. Which of the following statements is correct with regards to the business cycle?
A. Up to the 1980s the economy slowly got back to its previous level of employment.
B. After the 1980s economic recoveries took increasingly longer.
C. After the 1980s economic recoveries took a short period of time.
D. The 1990 recovery was slower than the 2001 recovery.
26. If the structural stagnation hypothesis is correct, demand-side government policy has been far
too expansionary since the mid:
A. 2000s.
B. 1980s.
C. 1990s.
D. 1970s.
27. In order for the economy to return to its growth rate, the rate at which the economy expands
must be:
A. equal to the trend rate.
B. less than the trend rate.
C. greater than the trend rate.
D. equal to the rate of inflation.
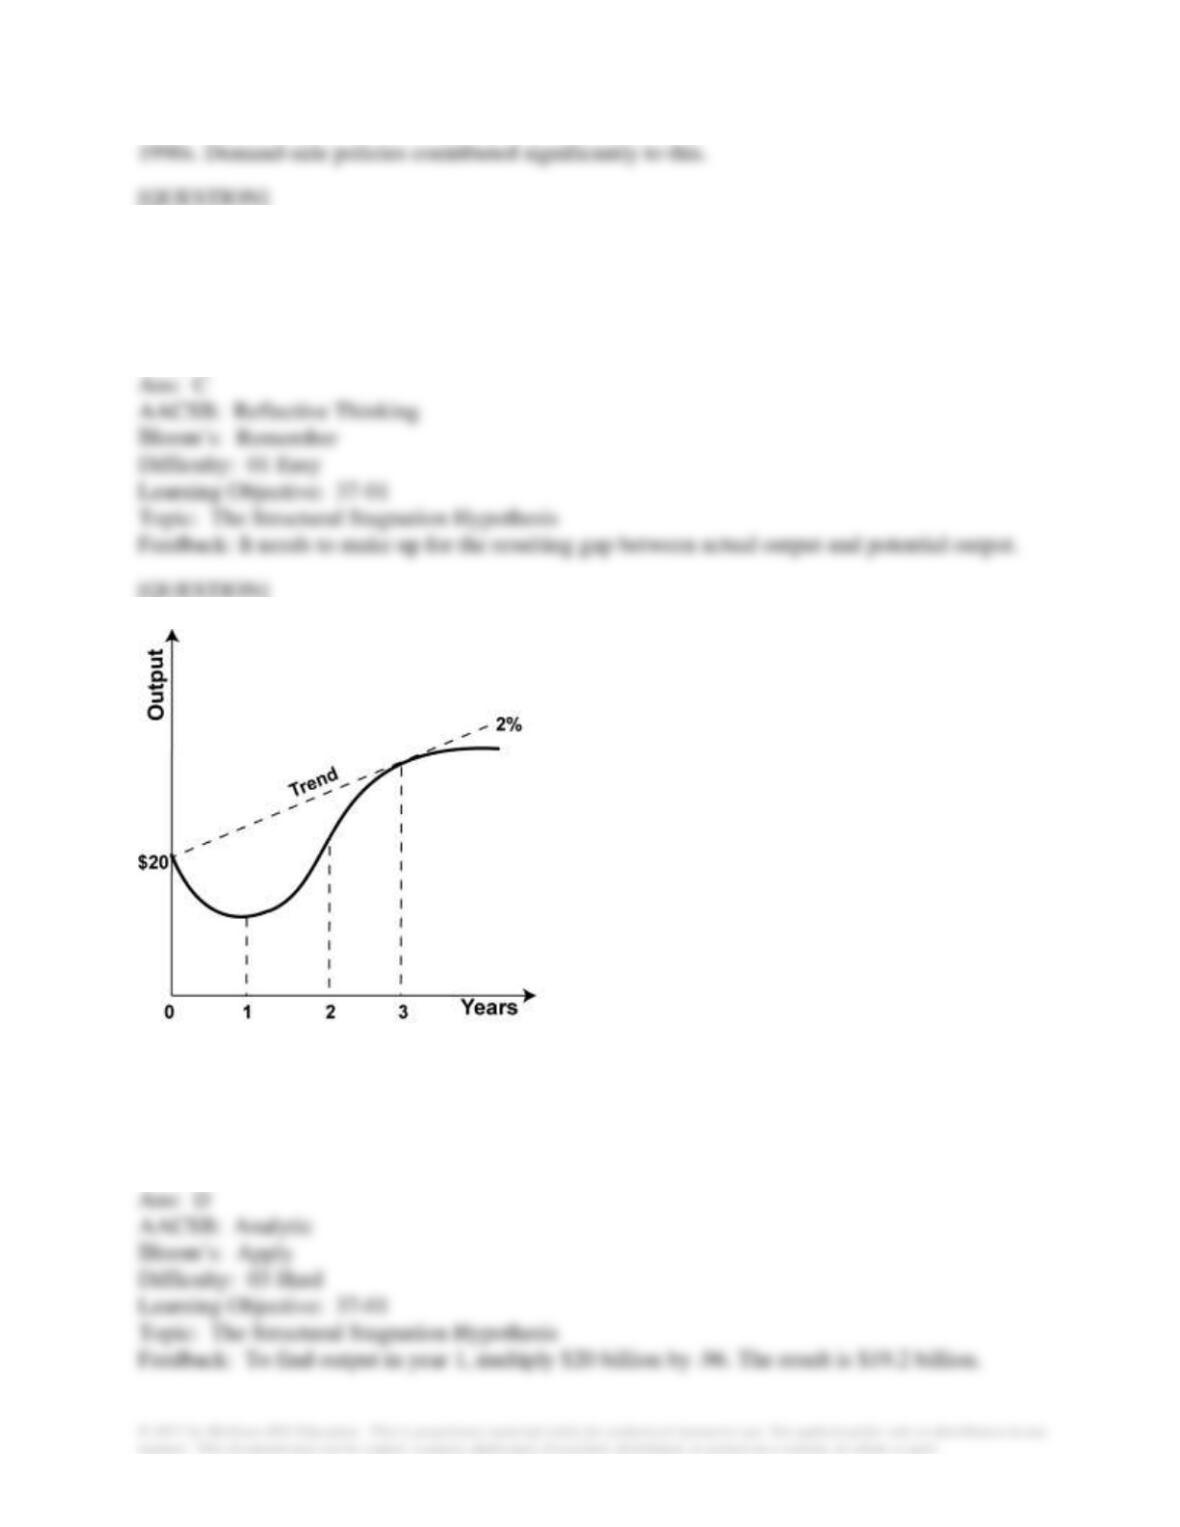
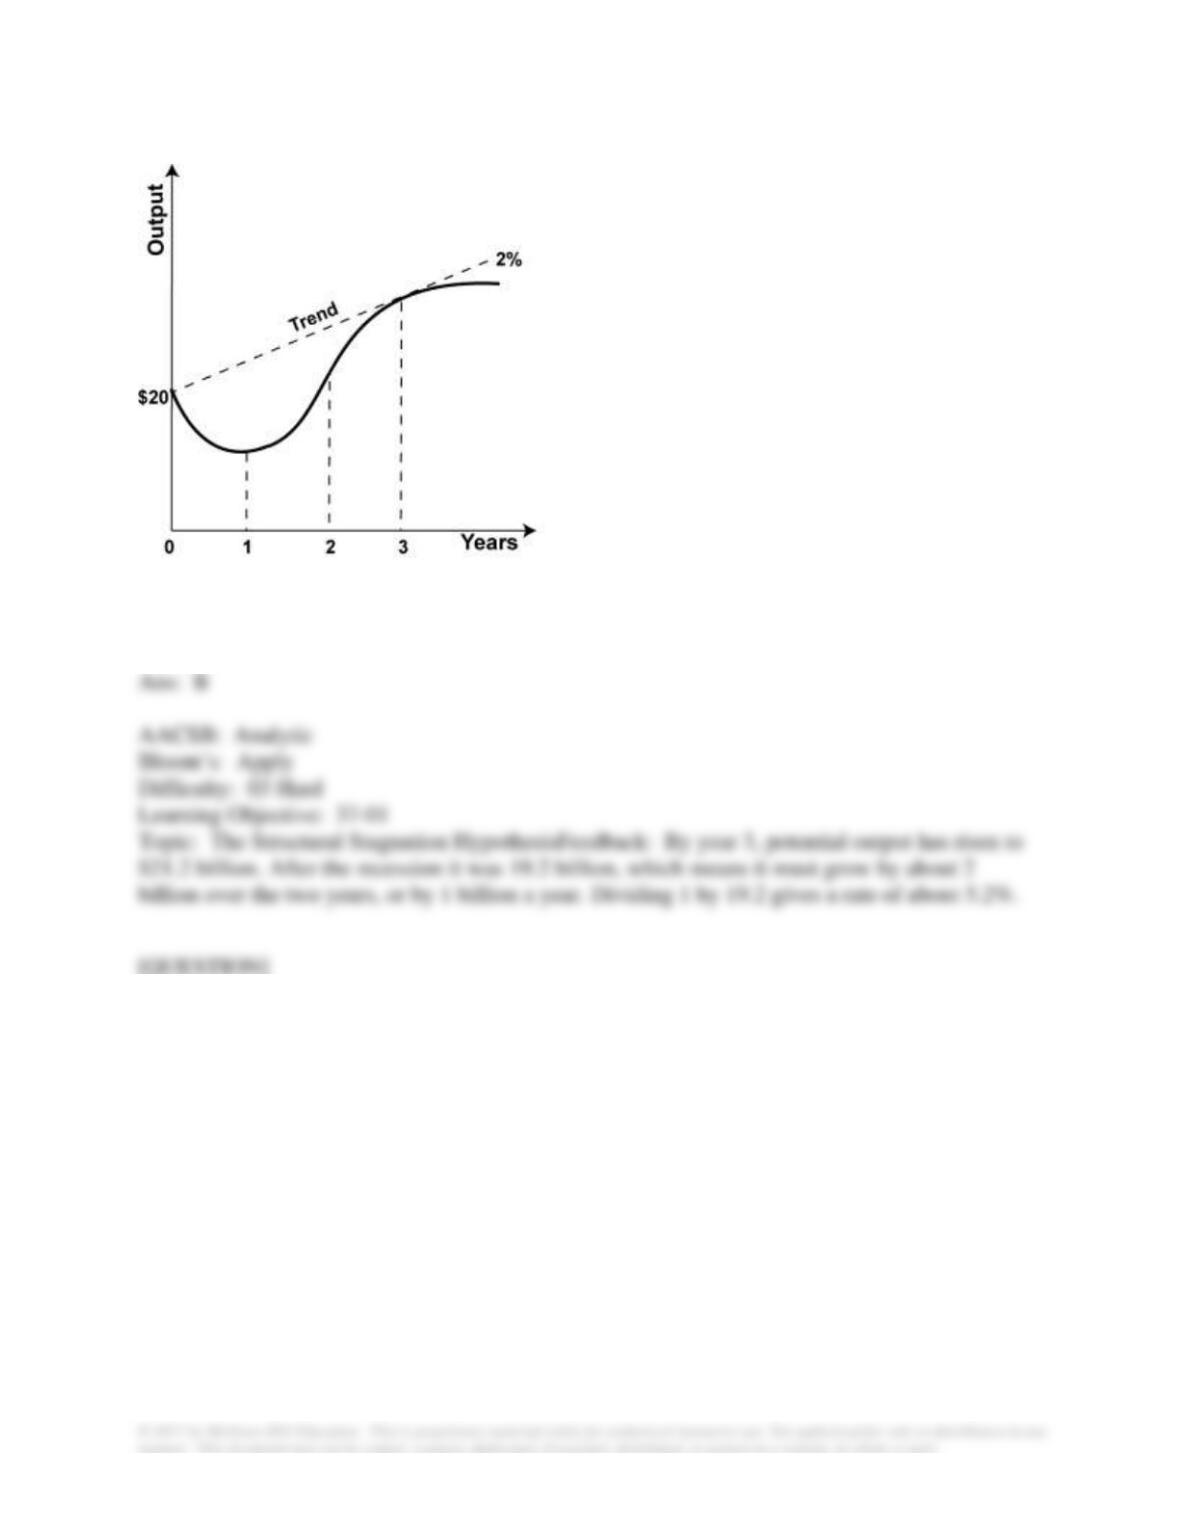
28. Refer to the graph.
The economy begins at a level of output of $20 billion and experiences a one-year recession in
which output declines by 4 percent. What is output in year 1?
A. $800 million.
B. $800 billion
C. $19.2 million.
D. $19.2 billion.
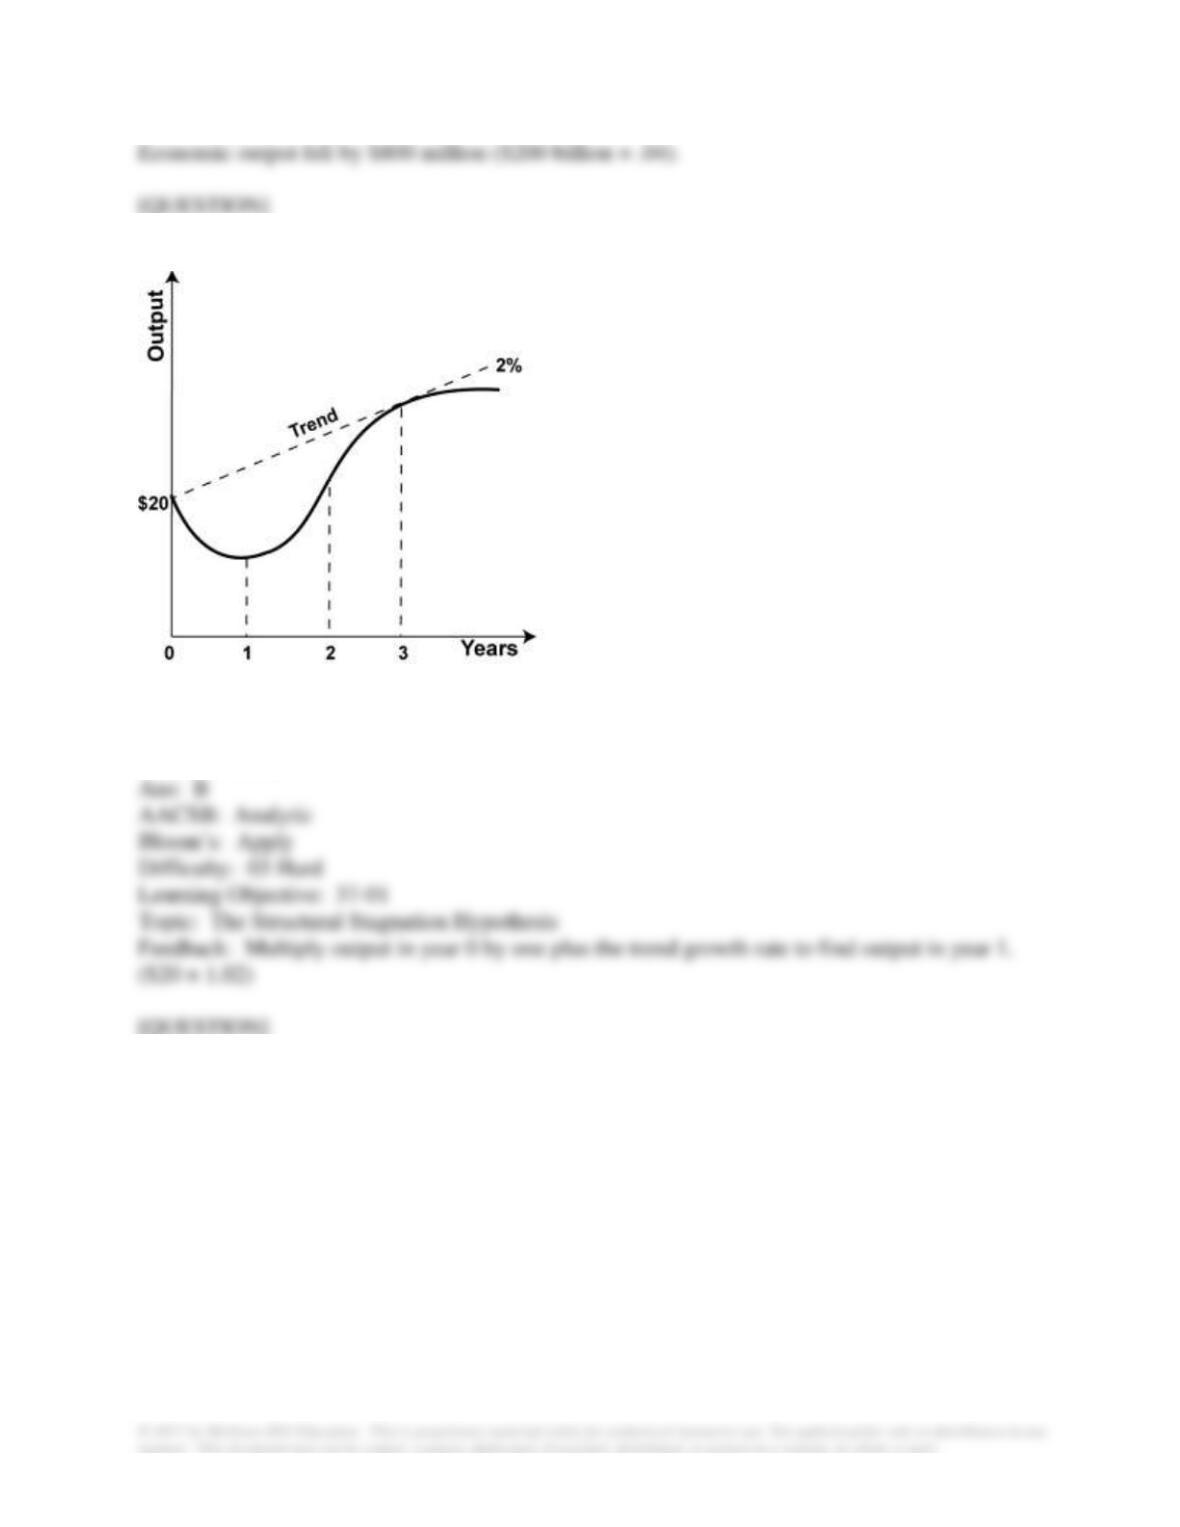
29. Refer to the graph. Economic output in year 0 is $20 billion. What is potential output in year
1?
A. $20 billion.
B. $20.4 billion.
C. $20.8 billion.
D. $21.2 billion.
30. Refer to the graph. Economic output in year 0 is $20 billion. What is potential output in year
2?
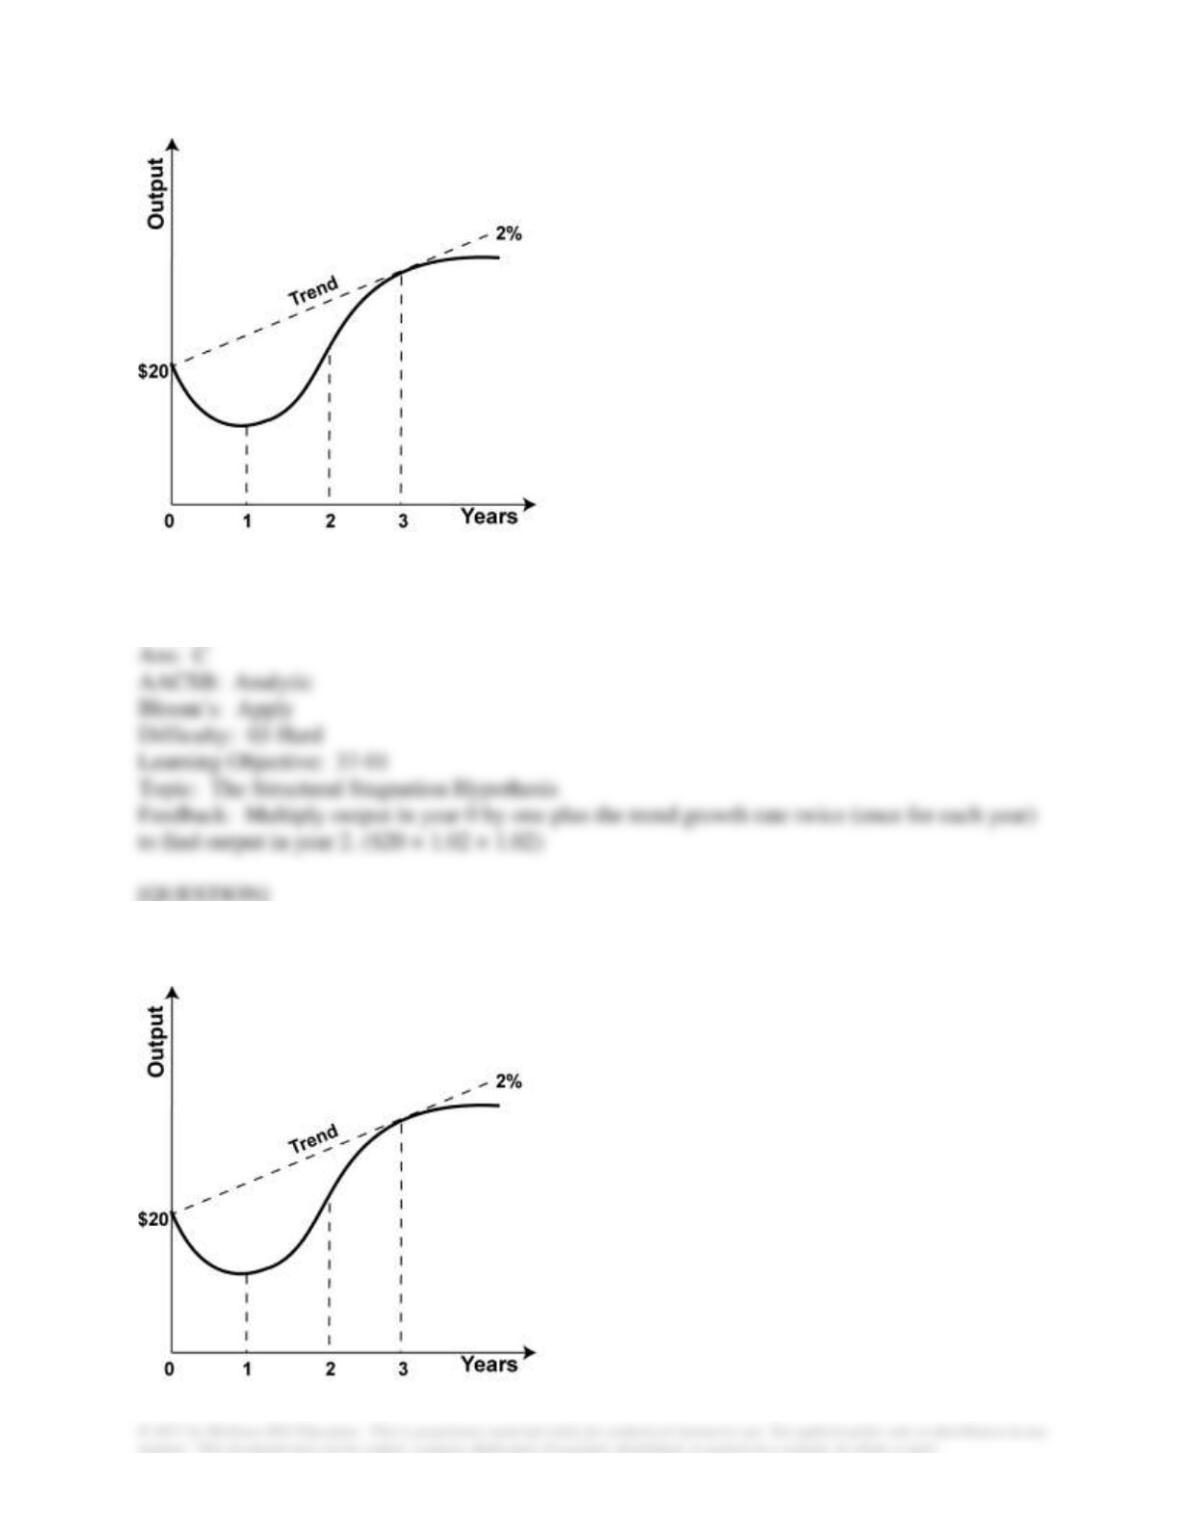
A. $20 billion.
B. $20.4 billion.
C. $20.8 billion.
D. $21.2 billion.
31. Refer to the graph. The economy begins at a level of output of $20 billion and experiences a
one-year recession in which output declines by 4 percent. By what rate must the economy
expand to return to potential output by year 2?
A. About 4%.
B. About 6%.
C. About 8%.
D. About 10%.
19.2 gives a rate of about 8.3% so the best answer is C.
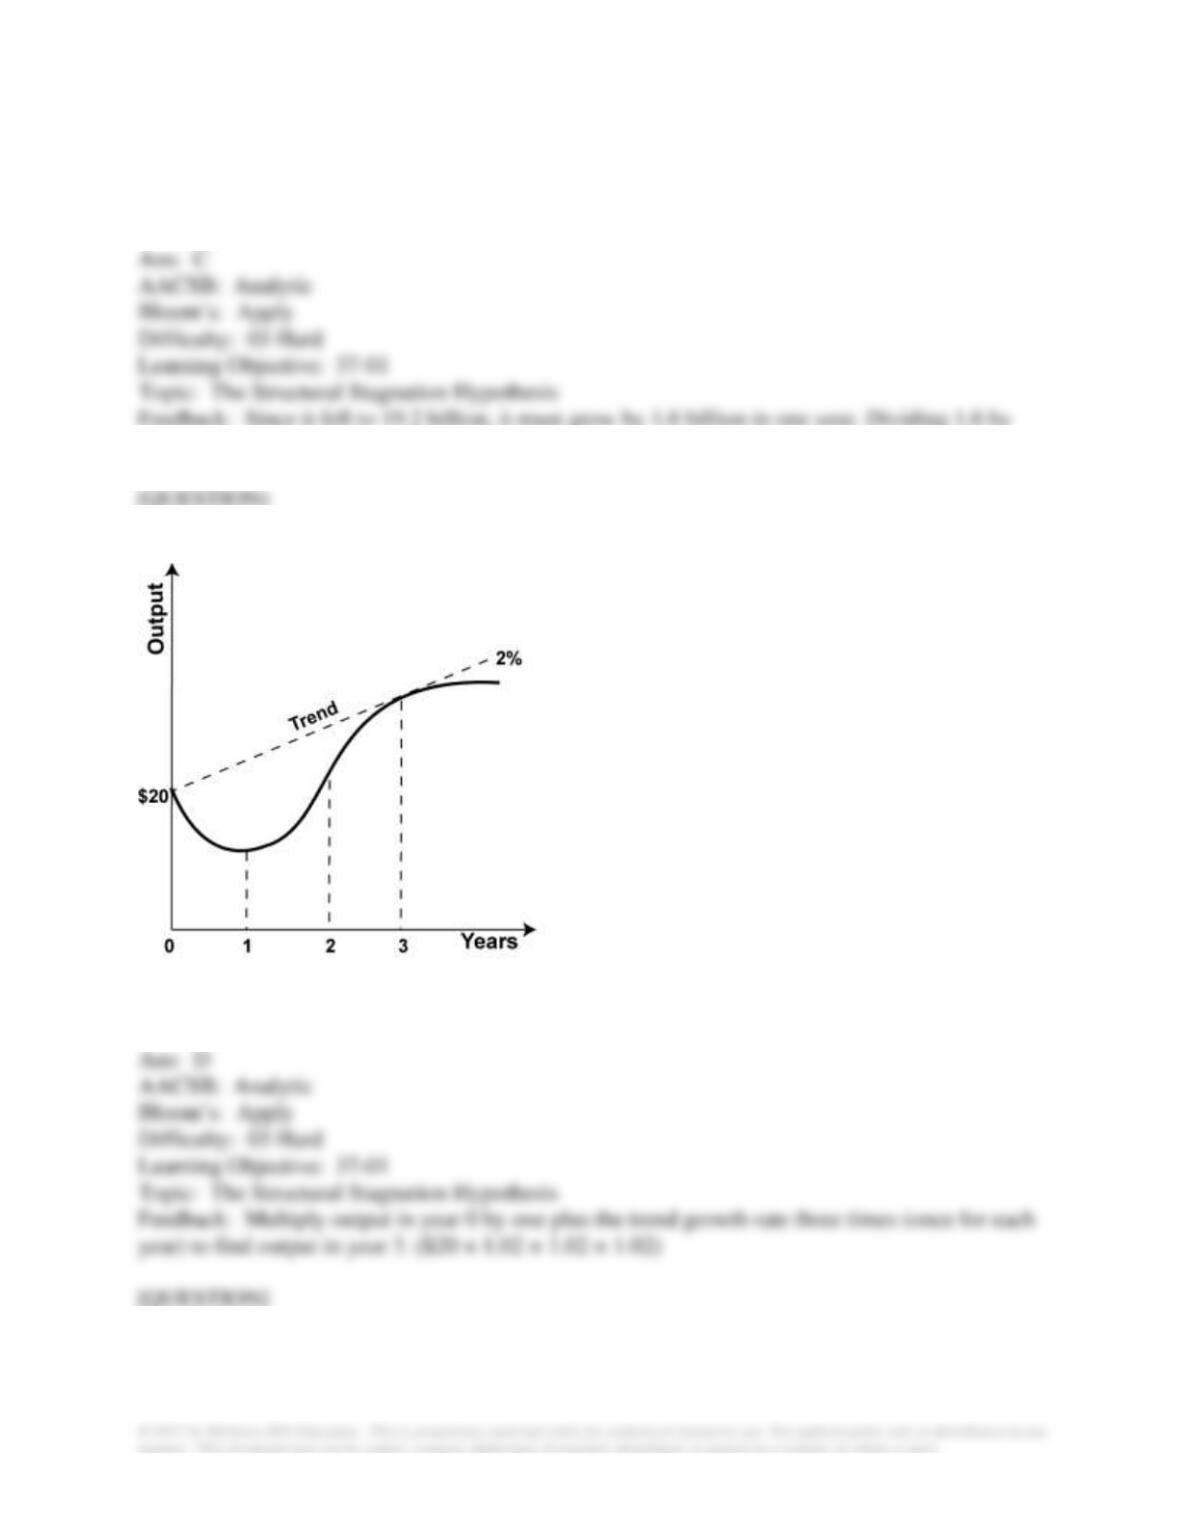
32. Refer to the graph.Economic output in year 0 is $20 billion. What is potential output in year
3?
A. $20 billion.
B. $20.4 billion
C. $20.8 billion.
D. $21.2 billion.
33. Refer to the graph . The economy begins at a level of output of $20 billion and experiences a
one-year recession in which output declines by 4 percent. By what rate per year must the
economy expand after it has reached its trough to return to its potential output by year 3?
A. About 3%.
B. About 5%.
C. About 8%.
D. About 10%.
34. Refer to the graph shown. The economy begins at a level of output of $50 billion and
experiences a one-year recession in which output declines by 3 percent, what is output in year 1?
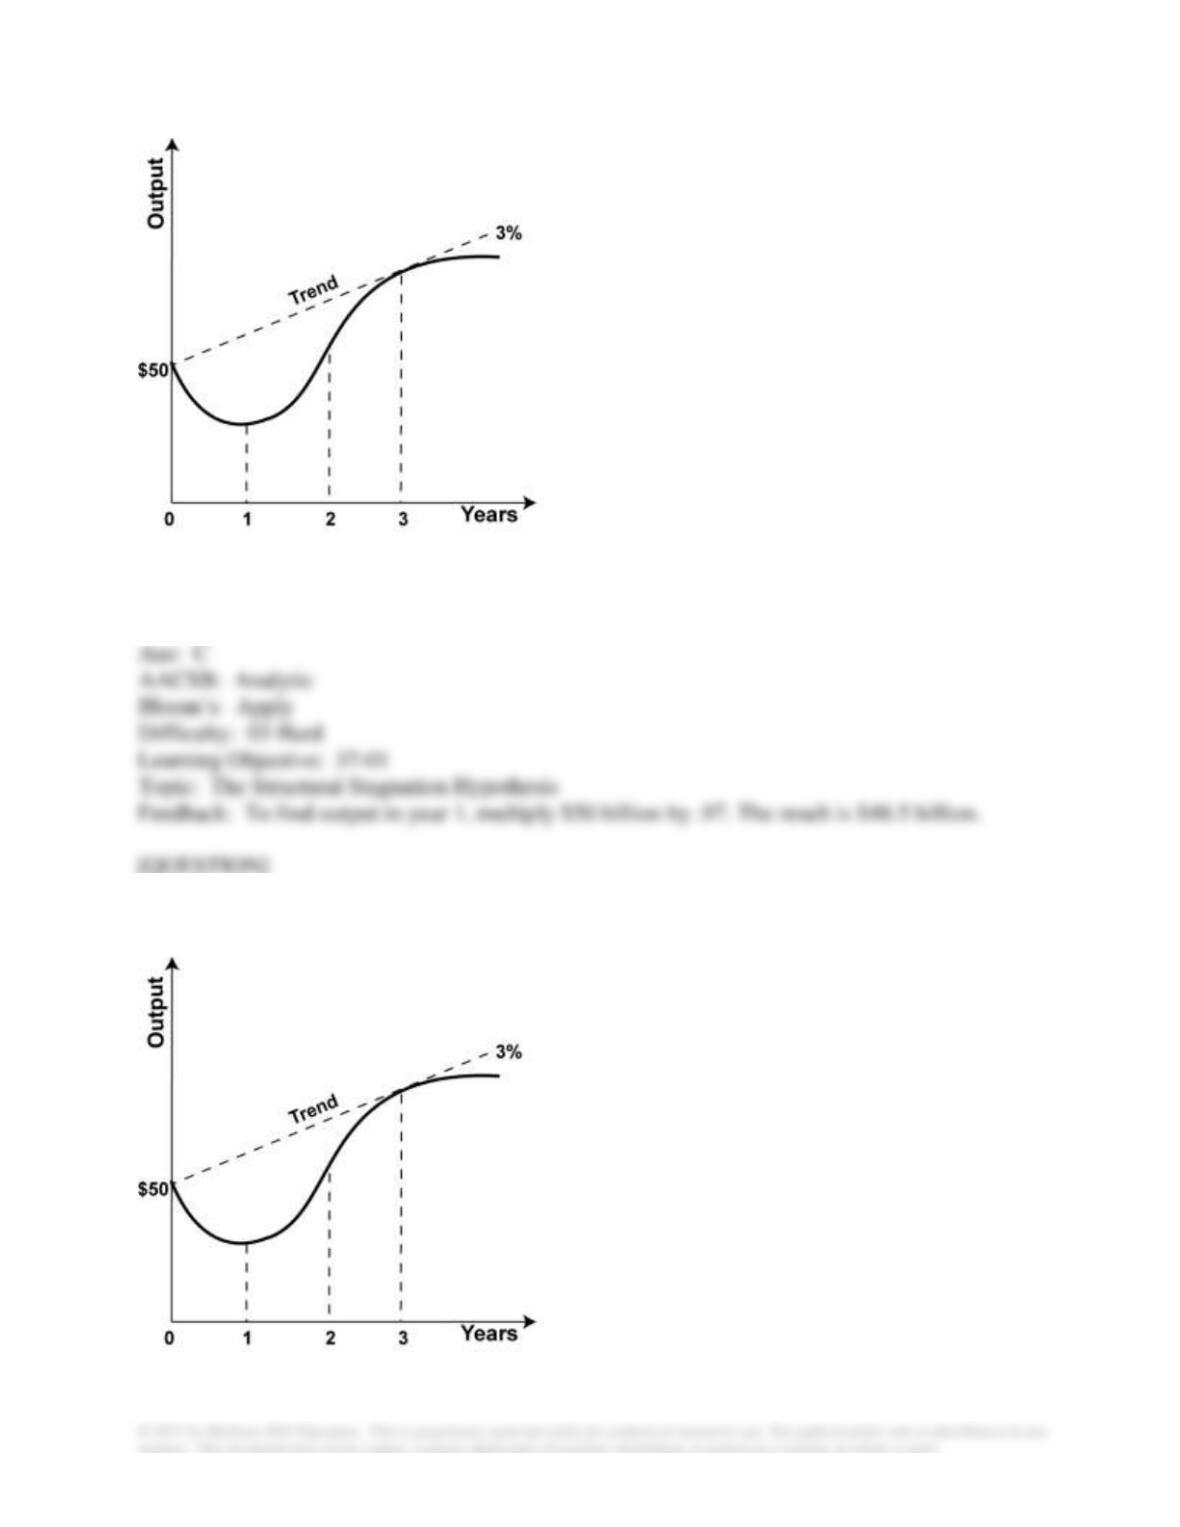
A. $1.50 billion.
B. $15 billion.
C. $48.5 million.
D. $51.5 billion.
35. Refer to the graph shown. Economic output in year 0 is $50 billion. What is potential output
in year 2?
A. $50 billion.
B. $51.5 billion.
C. $53.0 billion.
D. $54.6 billion.
36. Refer to the graph shown. The economy begins at a level of output of $50 billion and
experiences a one-year recession in which output declines by 3 percent. By what rate must the
economy expand to return to potential output by year 2?
A. About 3%.
B. About 4%.
C. About 6%.
D. About 9%.
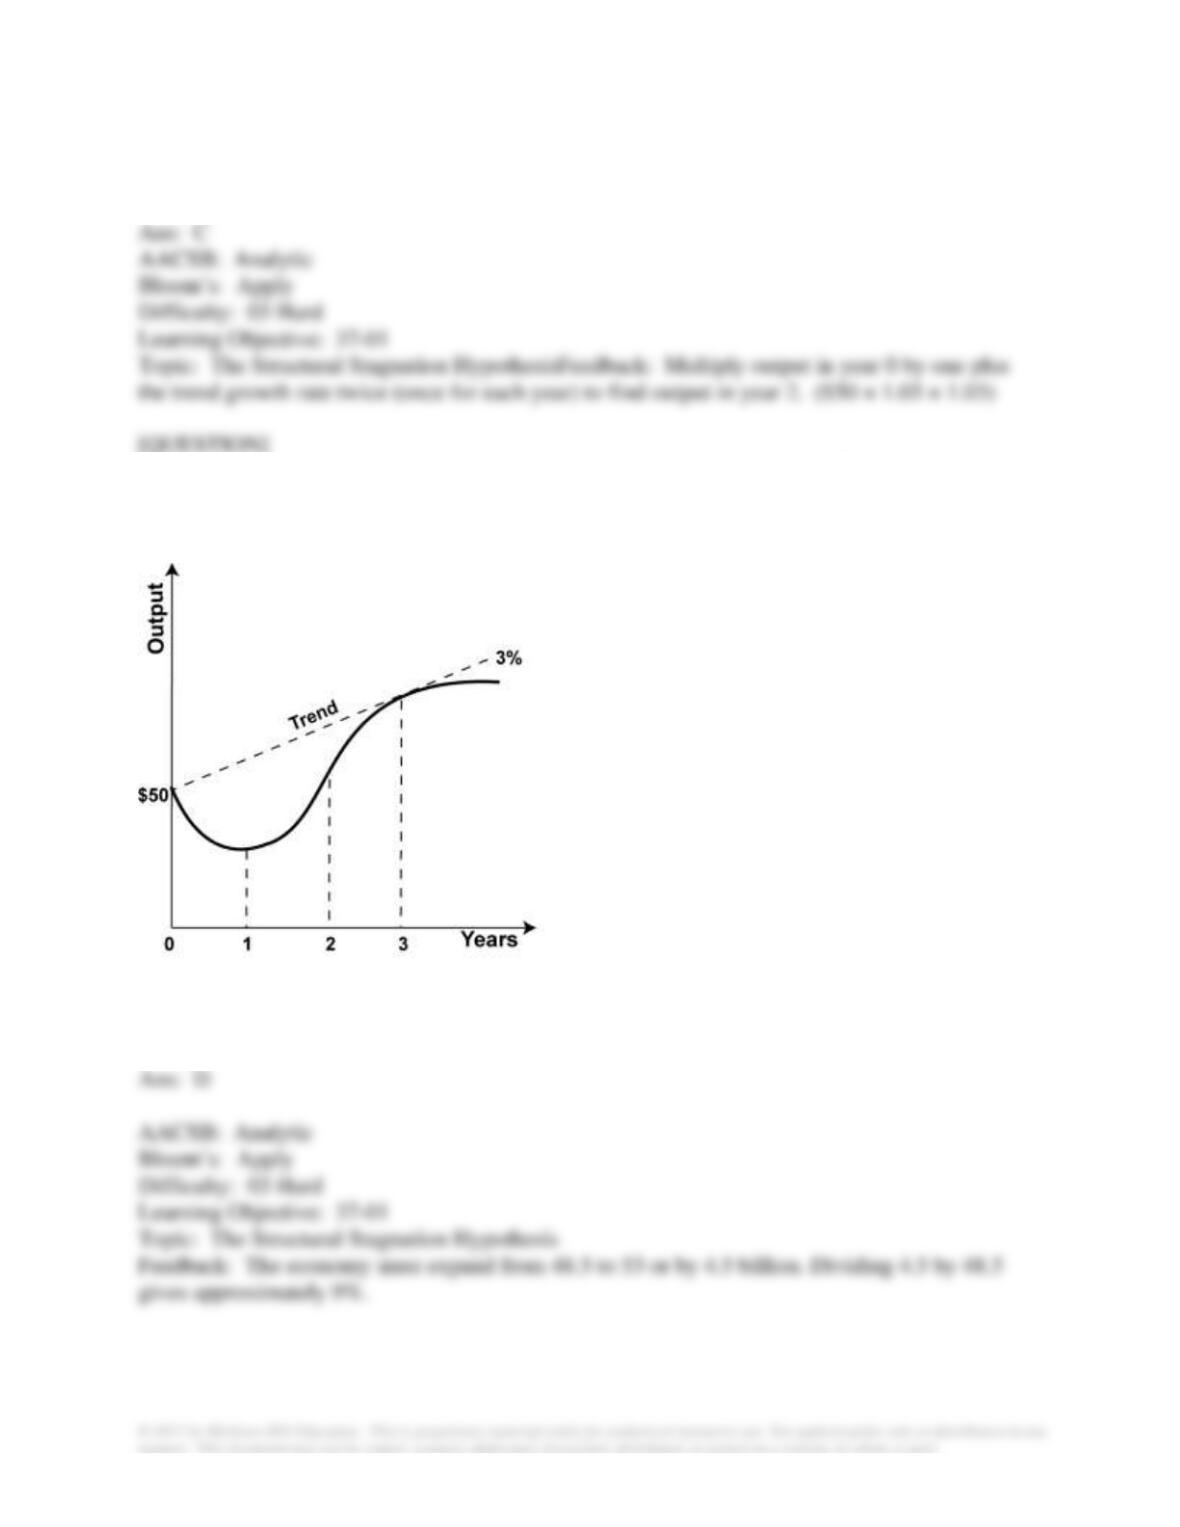
37. Refer to the graph shown. Economic output in year 0 is $50 billion. What is potential output
in year 3?
A. $47.0 billion.
B. $50 billion.
C. $54.6 billion.
D. $56.3 billion.
38. Structural stagnation cannot be treated as a normal business cycle because:
A. it only happens once every thirty years.
B. it only occurs as result of hyperinflation.
C. it is far less responsive to typical demand-side policies.
D. it is far less responsive to supply-side policies.
39. Structural stagnation is used to describe a:
A. downturn followed by a period of slow growth that is not expected to speed up anytime soon
without major structural changes in the economy.
B. downturn followed by a period of slow growth that is not expected to speed up anytime soon
without major political changes in the economy.
C. downturn followed by a period of slow growth that is not expected to speed up anytime soon
without major legal changes in the economy.
D. downturn followed by a period of slow growth that is not expected to speed up anytime soon
without major cyclical changes in the economy.
40. The standard macro policy is the assumption that the long-run trend growth rate is:
A. 1 to 2 percent.
B. 5 to 6 percent.
C. 3 to 3.5 percent.
D. 0 to 1 percent.
41. If an economy declined by 3 percent in one year in order for the economy to return to trend
growth within two years, it would have to increase at an annual rate that is
A. less than three percent.
B. equal to three percent.
C. greater than three percent.
D. unknown.
42. The short-run cause of structural stagnation is tied to:
A. globalization.
B. the financial crisis aftermath.
C. the trade deficit.
D. exchange rates.
43. The structural stagnation hypothesis provides a general explanation for why:
A. the economy is experiencing a weak recovery.
B. a bubble occurred in the housing market.
C. demand-side policies have been successful in the economic recovery in 2010-12.
D. the economy is experiencing such a strong recovery.
44. Structural stagnation focuses on _______ in terms of understanding why the economy
experiences slow growth.
A. low investment
B. low consumption
C. low government spending
D. globalization
45. If the structural stagnation hypothesis is true, what happened to the economy in the early
2000s that made it prone to a financial crisis?
A. Too expansionary demand-side policies.
B. Too expansionary supply-side policies.
C. Increased trade restrictions.
D. Slowing technological advance.
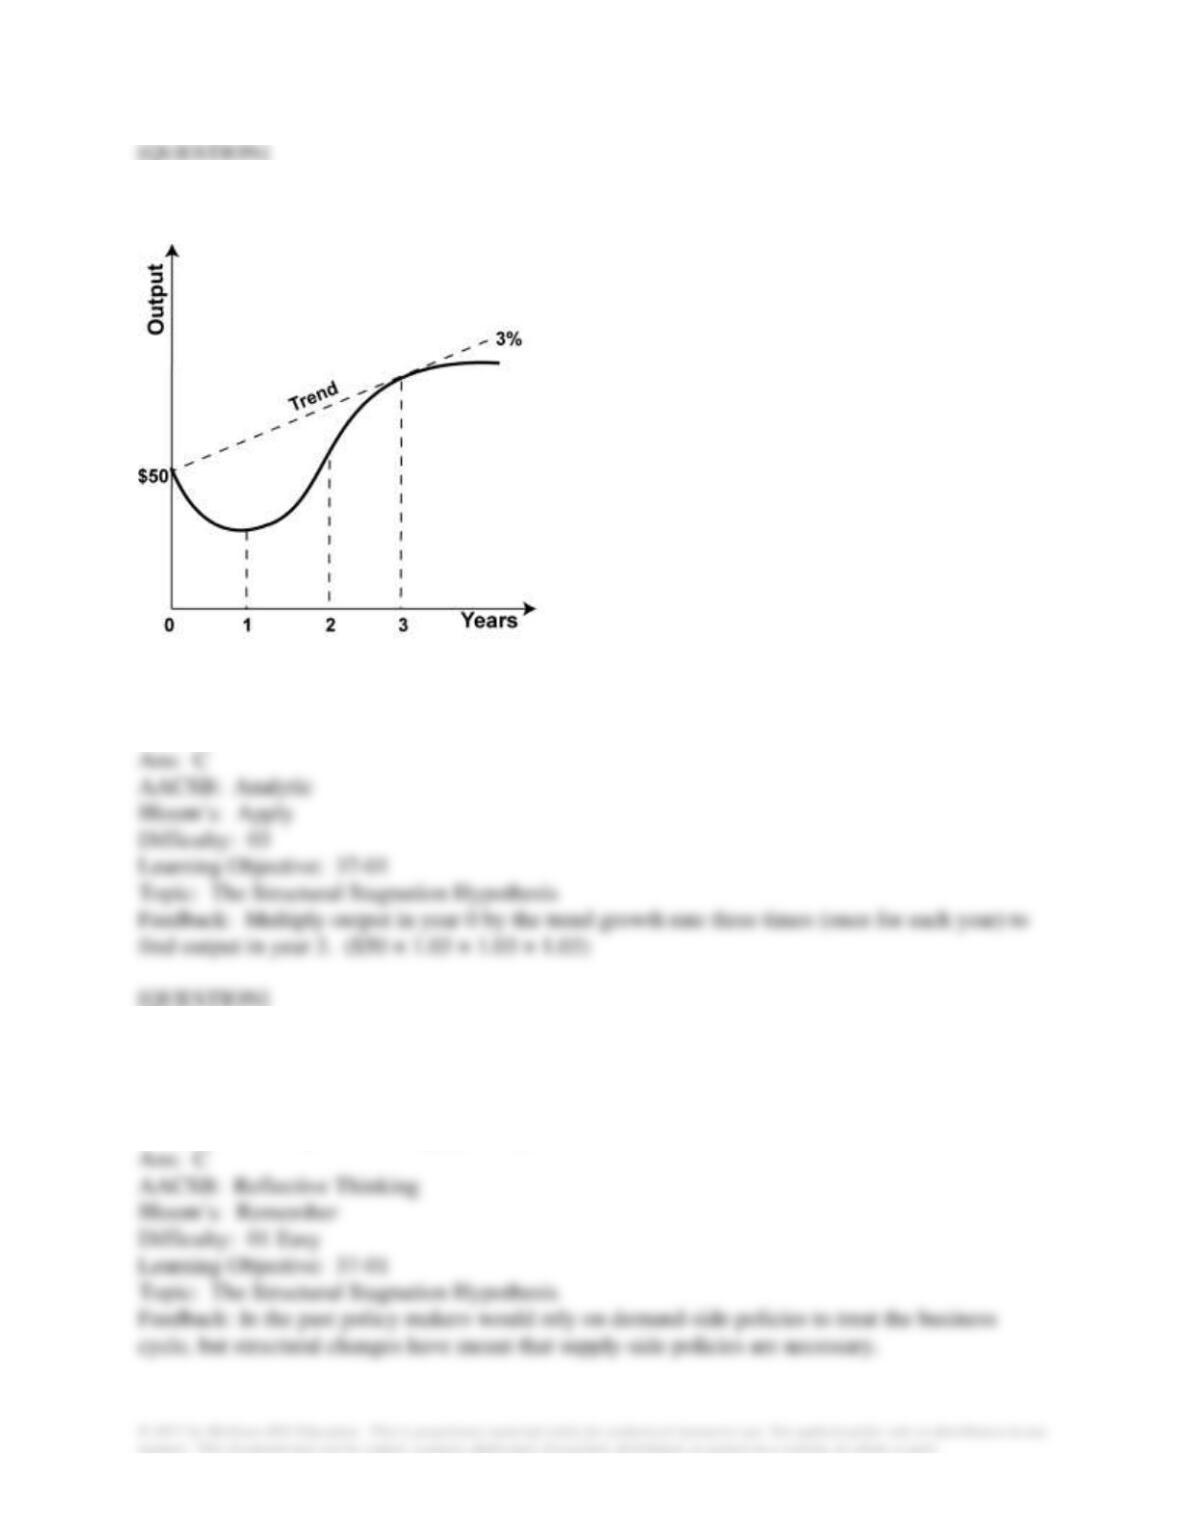
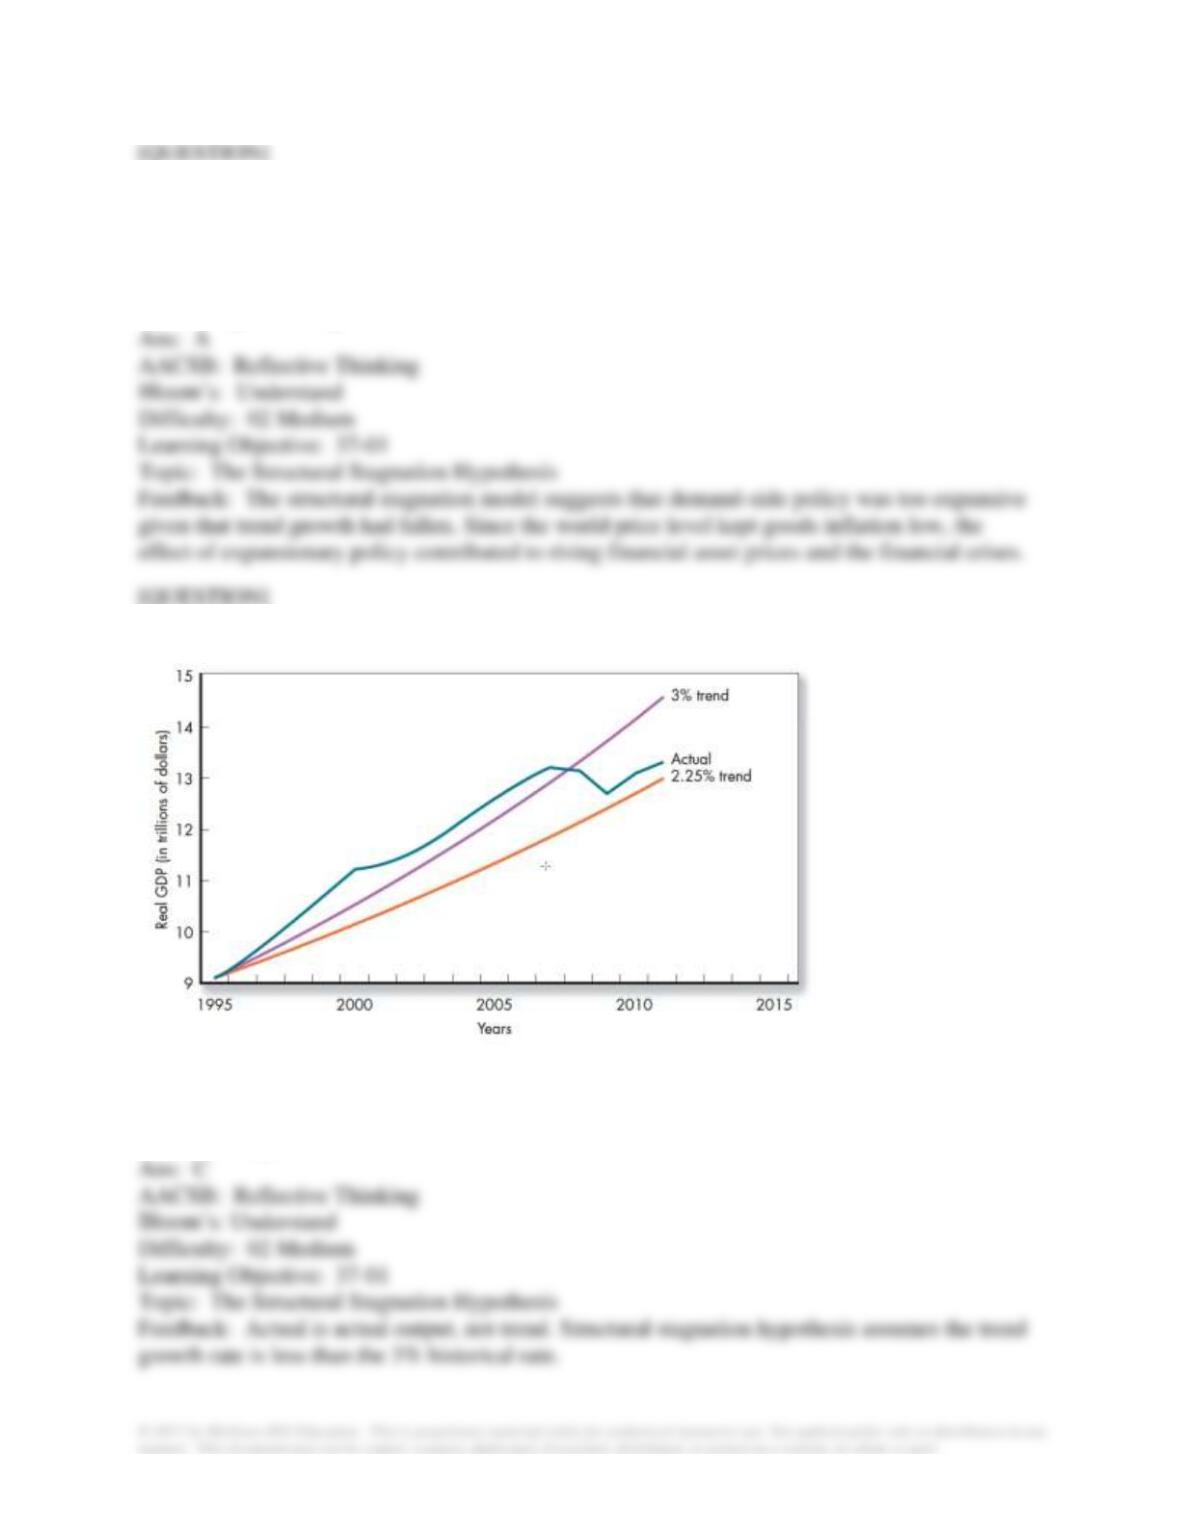
46. Which of the lines represents the structural stagnation’s assumption about trend growth?
A. 3% trend.
B. Actual.
C. 2.25% trend.
D. It is not represented.
47. A theory in which advanced countries stop growing because investment opportunities would
be eliminated is referred to as:
A. structural stagnation.
B. frictional stagnation.
C. reservation stagnation
D. secular stagnation.
48. An explanation after the Great Depression for why output growth would stop is called:
A. the structural stagnation hypothesis.
B. secular stagnation theory.
C. the frictional stagnation hypothesis.
D. the slow growth model.
49. The central difference between the structural stagnation hypothesis and the secular stagnation
theory is that:
A. structural stagnation applied in the 1940s and secular stagnation applies today.
B. structural stagnation focuses on declining investment while secular stagnation focuses on
globalization.
C. structural stagnation focuses on globalization while secular stagnation focuses on declining
investment.
D. structural stagnation is a hypothesis while secular stagnation is theory.