b.
supply-side inflation.
c.
falling prices.
d.
stable prices.
DISC: Aggregate demand and aggre – DISC: Aggregate demand and aggregate supply
United States – BPROG: Analytic
Aggregate demand and aggregate s – Aggregate demand and aggregate supply
Origins of the Phillips Curve
69. Which of the following is most likely to result in unemployment?
a.
Aggregate demand grows more rapidly than aggregate supply.
b.
Aggregate demand and aggregate supply grow at the same rate.
c.
Aggregate supply grows more rapidly than aggregate demand.
d.
Neither aggregate demand nor aggregate supply grows at all.
DISC: Aggregate demand and aggre – DISC: Aggregate demand and aggregate supply
United States – BPROG: Analytic
Aggregate demand and aggregate s – Aggregate demand and aggregate supply
Origins of the Phillips Curve
70. As a generalization, it can be said that
a.
aggregate demand shifts to the right every year, but aggregate supply rarely does.
b.
aggregate supply shifts to the right every year, but aggregate demand rarely does.
c.
both aggregate demand and aggregate supply shift to the right each year.
d.
neither aggregate demand nor aggregate supply curve shifts to the right each year.
DISC: Aggregate demand and aggre – DISC: Aggregate demand and aggregate supply
United States – BPROG: Analytic
Aggregate demand and aggregate s – Aggregate demand and aggregate supply
Origins of the Phillips Curve
71. Aggregate supply tends to grow because
a.
there are more workers in the economy every year.
b.
there is more capital in the economy every year.
c.
technology tends to improve every year.
d.
All of the above are correct.
DISC: Aggregate demand and aggre – DISC: Aggregate demand and aggregate supply
United States – BPROG: Analytic
Aggregate demand and aggregate s – Aggregate demand and aggregate supply
Origins of the Phillips Curve
72. If AD increases at a faster rate than AS, the result will be
a.
demand-side inflation.
b.
supply-side inflation.
c.
falling prices.
d.
stable prices.
DISC: Aggregate demand and aggre – DISC: Aggregate demand and aggregate supply
United States – BPROG: Analytic
Aggregate demand and aggregate s – Aggregate demand and aggregate supply
Origins of the Phillips Curve
73. During the 1960s and early 1970s, economists believed that the Phillips curve indicated
a.
that higher inflation was the price for more unemployment.
b.
that higher levels of employment could be achieved with lower inflation.
c.
a menu of choices for policy makers.
d.
All of the above are correct.
DISC: Aggregate demand and aggre – DISC: Aggregate demand and aggregate supply
United States – BPROG: Analytic
Aggregate demand and aggregate s – Aggregate demand and aggregate supply
Origins of the Phillips Curve
74. If aggregate demand had grown faster than it did from 2009 to 2010, then the U.S. economy would have experienced
a.
higher unemployment and higher inflation.
b.
lower unemployment and lower inflation.
c.
higher unemployment and lower inflation.
d.
lower unemployment and higher inflation.
DISC: Aggregate demand and aggre – DISC: Aggregate demand and aggregate supply
United States – BPROG: Analytic
Aggregate demand and aggregate s – Aggregate demand and aggregate supply
Origins of the Phillips Curve
75. The Phillips curve shows the relationship between
a.
the rate of inflation and the rate of unemployment.
b.
the rate of growth of real GDP and the rate of unemployment.
c.
real prices and real GDP.
d.
the rate of inflation and the rate of growth of real GDP.
DISC: Aggregate demand and aggre – DISC: Aggregate demand and aggregate supply
United States – BPROG: Analytic
Aggregate demand and aggregate s – Aggregate demand and aggregate supply
Origins of the Phillips Curve
76. On the vertical axis, the Phillips curve depicts the
a.
the rate of unemployment.
b.
rate of inflation.
c.
rate of growth of nominal GDP.
d.
rate of growth of real GDP.
DISC: Aggregate demand and aggre – DISC: Aggregate demand and aggregate supply
United States – BPROG: Analytic
Aggregate demand and aggregate s – Aggregate demand and aggregate supply
Origins of the Phillips Curve
77. Which of the following observations concerning the Phillips curve is not true?
a.
They are normally upward-sloping.
b.
They are more commonly constructed for price inflation.
c.
They depict the inverse relation between wage inflation and unemployment.
d.
They depict the rate of unemployment on the horizontal axis.
DISC: Aggregate demand and aggre – DISC: Aggregate demand and aggregate supply
United States – BPROG: Analytic
Aggregate demand and aggregate s – Aggregate demand and aggregate supply
Origins of the Phillips Curve
78. A movement from an upper point to a lower point on the Phillips curve shows
a.
decrease in the inflation and decrease in the unemployment.
b.
increase in the inflation and decrease in the employment.
c.
increase in the inflation and increase in the employment.
d.
decrease in the inflation and increase in the unemployment.
DISC: Aggregate demand and aggre – DISC: Aggregate demand and aggregate supply
United States – BPROG: Analytic
Aggregate demand and aggregate s – Aggregate demand and aggregate supply
Origins of the Phillips Curve
79. The unemployment rate for the U.S. economy in 2014 averaged about
a.
10.2 percent.
b.
8.5 percent.
c.
6.5 percent.
d.
4 percent.
United States – Analytic – BB-Legal
Measuring the Economy
Origins of the Phillips Curve
80. If the fluctuations in the economy’s real growth rate from year to year are caused primarily by variations in the rate at
which aggregate demand increases, then data would show
a.
a cyclical relationship between inflation and unemployment.
b.
a direct relationship between inflation and unemployment.
c.
an inverse relationship between inflation and unemployment.
d.
no relationship between inflation and unemployment.
DISC: Aggregate demand and aggre – DISC: Aggregate demand and aggregate supply
United States – BPROG: Analytic
Aggregate demand and aggregate s – Aggregate demand and aggregate supply
Origins of the Phillips Curve
81. If the fluctuations in the economy’s real growth rate from year to year are caused primarily by variations in the rate at
which aggregate demand increases, then data would show the
a.
worst recession occurs when output expands most rapidly.
b.
slowest inflation occurs when output expands most rapidly.
c.
slowest economic growth occurs when output grows most rapidly.
d.
most rapid inflation occurs when output expands most rapidly.
DISC: Aggregate demand and aggre – DISC: Aggregate demand and aggregate supply
United States – BPROG: Analytic
Aggregate demand and aggregate s – Aggregate demand and aggregate supply
Origins of the Phillips Curve
82. If aggregate demand in the U.S. had grown more slowly than it actually did in 2010, the
a.
unemployment rate would have been even lower.
b.
inflation rate would have been even lower.
c.
unemployment rate would have been the same.
d.
economy would have grown faster.
DISC: Aggregate demand and aggre – DISC: Aggregate demand and aggregate supply
United States – BPROG: Analytic
Aggregate demand and aggregate s – Aggregate demand and aggregate supply
Origins of the Phillips Curve
83. If the fluctuations in the economy’s real growth rate from year to year are caused primarily by variations in the rate at
which aggregate supply increases, then data would show
a.
a cyclical relationship between inflation and unemployment.
b.
a direct relationship between inflation and unemployment.
c.
an inverse relationship between inflation and unemployment.
d.
no relationship between inflation and unemployment.
DISC: Aggregate demand and aggre – DISC: Aggregate demand and aggregate supply
United States – BPROG: Analytic
Aggregate demand and aggregate s – Aggregate demand and aggregate supply
Origins of the Phillips Curve
84. Demand-side inflation is normally accompanied by
a.
falling real GDP, while supply-side inflation may be accompanied by rising real GDP.
b.
falling real GDP; the same is true of supply-side inflation.
c.
rising real GDP, while supply-side inflation may be accompanied by falling real GDP.
d.
rising real GDP; the same is true of supply-side inflation.
DISC: Aggregate demand and aggre – DISC: Aggregate demand and aggregate supply
United States – BPROG: Analytic
Aggregate demand and aggregate s – Aggregate demand and aggregate supply
Origins of the Phillips Curve
85. If the aggregate supply curve is vertical, then the short-run Phillips curve will
a.
be horizontal.
b.
also be vertical.
c.
slope upward.
d.
slope downward.
DISC: Aggregate demand and aggre – DISC: Aggregate demand and aggregate supply
United States – BPROG: Analytic
Aggregate demand and aggregate s – Aggregate demand and aggregate supply
Origins of the Phillips Curve
86. In the short run, fiscal and monetary policy cause unemployment and inflation to move in opposite directions because
a.
the Fed and Congress rarely agree on policy.
b.
one controls aggregate demand, the other controls aggregate supply.
c.
both policies control only aggregate supply.
d.
both policies control only aggregate demand.
DISC: Aggregate demand and aggre – DISC: Aggregate demand and aggregate supply
United States – BPROG: Analytic
Aggregate demand and aggregate s – Aggregate demand and aggregate supply
Origins of the Phillips Curve
87. At the natural rate of unemployment, the long-run Phillips curve has a(n)
a.
vertical slope.
b.
horizontal slope.
c.
upward slope.
d.
downward slope.
United States – BPROG: Analytic
Aggregate demand and aggregate s – Aggregate demand and aggregate supply
Origins of the Phillips Curve
88. In the 1960s and early 1970s, many economists and policy makers thought the Phillips curve was
a.
interesting, but had no theory behind it.
b.
invalid and of no use to policy makers.
c.
of no interest in making macroeconomic policy.
d.
a “menu” of possible choices available to policy makers.
DISC: Aggregate demand and aggre – DISC: Aggregate demand and aggregate supply
United States – BPROG: Analytic
Aggregate demand and aggregate s – Aggregate demand and aggregate supply
Origins of the Phillips Curve
89. If the fluctuations in the economy’s real growth rate from year to year are caused primarily by variations in the rate at
which aggregate demand increases, then data would show the most rapid inflation occurs when
a.
unemployment is the highest, and the lowest inflation occurs when unemployment is the lowest.
b.
AS grows most rapidly, and the lowest inflation occurs when AS grows most slowly.
c.
AD rises most slowly, and the lowest inflation occurs when AD rises most rapidly.
d.
output grows most rapidly and the lowest inflation when output grows most slowly.
DISC: Aggregate demand and aggre – DISC: Aggregate demand and aggregate supply
United States – BPROG: Analytic
Aggregate demand and aggregate s – Aggregate demand and aggregate supply
Origins of the Phillips Curve
90. The origin of the Phillips curve is the idea that an increase in
a.
AD will lead to more inflation and more unemployment.
b.
AD will lead to more inflation and lower unemployment.
c.
AS will lead to lower inflation and lower unemployment.
d.
AS will lead to less inflation and higher unemployment.
DISC: Aggregate demand and aggre – DISC: Aggregate demand and aggregate supply
United States – BPROG: Analytic
Aggregate demand and aggregate s – Aggregate demand and aggregate supply
Origins of the Phillips Curve
91. If business fluctuations are from demand-side forces,
a.
monetary and fiscal policy will move inversely.
b.
interest rates and budget deficits will move inversely.
c.
unemployment and inflation will move inversely.
d.
unemployment and budget deficits will move inversely.
DISC: Aggregate demand and aggre – DISC: Aggregate demand and aggregate supply
United States – BPROG: Analytic
Aggregate demand and aggregate s – Aggregate demand and aggregate supply
Origins of the Phillips Curve
92. One piece of evidence that business fluctuations are caused by demand-side changes would be that
a.
monetary and fiscal policy will move inversely.
b.
interest rates and budget deficits will move inversely.
c.
unemployment and inflation will move inversely.
d.
unemployment and budget deficits will move inversely.
DISC: Aggregate demand and aggre – DISC: Aggregate demand and aggregate supply
United States – BPROG: Analytic
Aggregate demand and aggregate s – Aggregate demand and aggregate supply
93. When the Phillips curve was first formulated (late 1960s), many economists thought that it showed a
a.
“menu” of budget deficits from different budget policies.
b.
“menu” of possible choices available to policy makers.
c.
guide to the appropriate mix of fiscal and monetary policy.
d.
guide of political reactions to economic policy.
DISC: Aggregate demand and aggre – DISC: Aggregate demand and aggregate supply
United States – BPROG: Analytic
Aggregate demand and aggregate s – Aggregate demand and aggregate supply
Origins of the Phillips Curve
94. If unemployment and inflation move inversely, then we can infer that business fluctuations are
a.
from the demand side.
b.
from the supply side.
c.
from both the demand and supply side.
d.
purely random events.
1
DISC: Aggregate demand and aggre – DISC: Aggregate demand and aggregate supply
United States – BPROG: Analytic
Aggregate demand and aggregate s – Aggregate demand and aggregate supply
Origins of the Phillips Curve
95. The Phillips curve is built on the assumption that business fluctuations are
a.
from the demand side.
b.
from the supply side.
c.
from both the demand and supply side.
d.
purely random events.
1
DISC: Aggregate demand and aggre – DISC: Aggregate demand and aggregate supply
United States – BPROG: Analytic
Aggregate demand and aggregate s – Aggregate demand and aggregate supply
Origins of the Phillips Curve
Figure 17-4
96. Figure 17-4 shows four movements of the inflation rate and the unemployment rate. Which panel shows the
movement associated with a “supply shock” like those of the 1970s?
a.
1
b.
2
c.
3
d.
4
1
DISC: Aggregate demand and aggre – DISC: Aggregate demand and aggregate supply
United States – BPROG: Reflective Thinking – BPROG: Analysis
Aggregate demand and aggregate s – Aggregate demand and aggregate supply
Supply-Side Inflation and the Collapse of the Phillips Curve
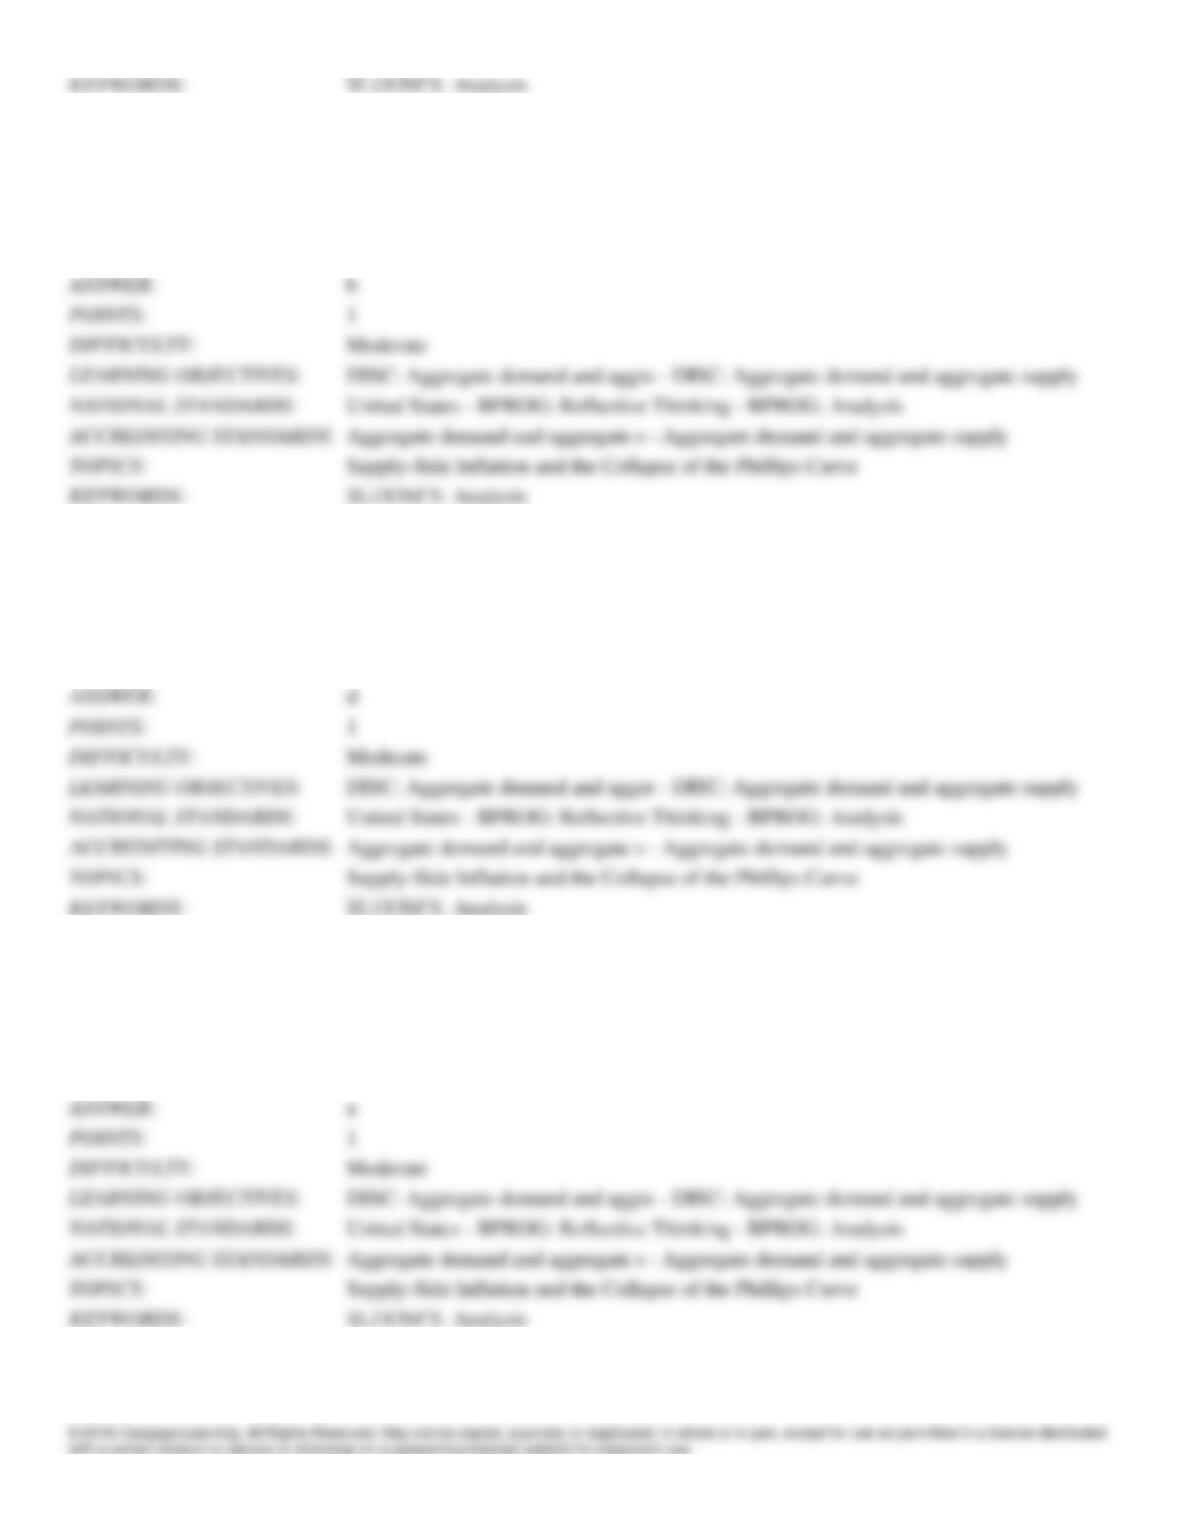
97. Which panel in Figure 17-4 shows the movement associated with a demand-side inflation?
a.
1
b.
2
c.
3
d.
4
b
1
DISC: Aggregate demand and aggre – DISC: Aggregate demand and aggregate supply
United States – BPROG: Reflective Thinking – BPROG: Analysis
Aggregate demand and aggregate s – Aggregate demand and aggregate supply
Supply-Side Inflation and the Collapse of the Phillips Curve
98. Which panel in Figure 17-4 shows the movement associated with the supply-side changes of the 1990s?
a.
1
b.
2
c.
3
d.
4
d
1
DISC: Aggregate demand and aggre – DISC: Aggregate demand and aggregate supply
United States – BPROG: Reflective Thinking – BPROG: Analysis
Aggregate demand and aggregate s – Aggregate demand and aggregate supply
Supply-Side Inflation and the Collapse of the Phillips Curve
99. Which panel in Figure 17-4 shows what happened in 2007-2009?
a.
1
b.
2
c.
3
d.
4
1
DISC: Aggregate demand and aggre – DISC: Aggregate demand and aggregate supply
United States – BPROG: Reflective Thinking – BPROG: Analysis
Aggregate demand and aggregate s – Aggregate demand and aggregate supply
Supply-Side Inflation and the Collapse of the Phillips Curve
100. Which of the factors below contributed to the collapse of the Phillips curve in the 1970s?
a.
Economic research proved there was no relationship between inflation and unemployment rates.
b.
The U.S. government was running triple-digit deficits in the 1970s, compounding the normal shifts in
aggregate demand.
c.
The 1970s were full of adverse supply shocks such as the oil price increases of 1973-1974.
d.
The aggregate demand curve shifted to the left at the end of the Vietnam War.
DISC: Aggregate demand and aggre – DISC: Aggregate demand and aggregate supply
United States – BPROG: Analytic
Aggregate demand and aggregate s – Aggregate demand and aggregate supply
Supply-Side Inflation and the Collapse of the Phillips Curve
101. Which of the following led to the collapse of the Phillips Curve?
a.
Rightward shift in the demand for labor curve
b.
Leftward shift of the Phillips curve
c.
Leftward shift of the aggregate supply curve
d.
Rightward shift of the aggregate demand curve.
DISC: Aggregate demand and aggre – DISC: Aggregate demand and aggregate supply
United States – BPROG: Analytic
Aggregate demand and aggregate s – Aggregate demand and aggregate supply
Supply-Side Inflation and the Collapse of the Phillips Curve
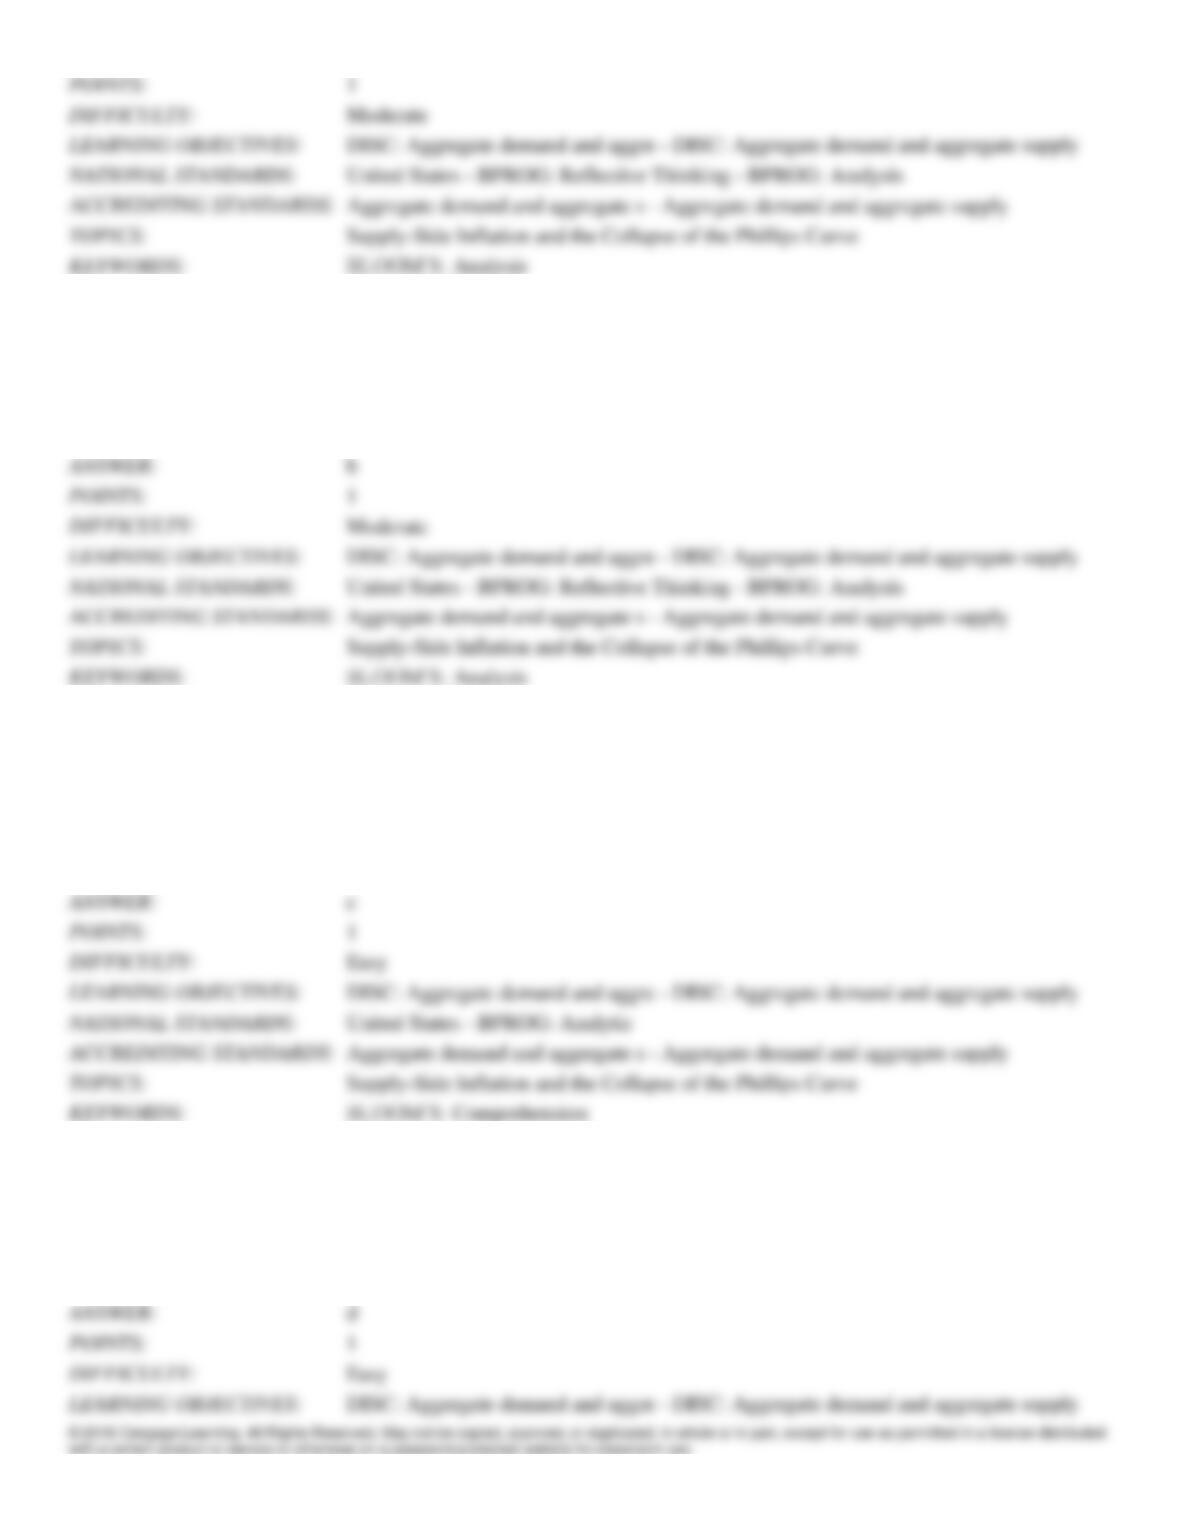
102. Over a five-year period, economists observed that the unemployment-inflation relationship appeared as in Figure 17–
5. Economic theory would conclude that the period
a.
was dominated by supply shocks such as increased energy and food costs.
b.
was affected by both supply and demand shocks, with demand shocks dominating.
c.
was dominated by demand-side changes.
d.
cannot be explained because the relationship is the opposite of what the Phillips curve would predict.
DISC: Aggregate demand and aggre – DISC: Aggregate demand and aggregate supply
United States – BPROG: Reflective Thinking – BPROG: Analysis
Aggregate demand and aggregate s – Aggregate demand and aggregate supply
Supply-Side Inflation and the Collapse of the Phillips Curve
103. The data illustrated in Figure 17-5 would be most representative of which decade?
a.
the 1960s
b.
the 1970s
c.
the 1980s
d.
the 1990s
DISC: Aggregate demand and aggre – DISC: Aggregate demand and aggregate supply
United States – BPROG: Reflective Thinking – BPROG: Analysis
Aggregate demand and aggregate s – Aggregate demand and aggregate supply
Supply-Side Inflation and the Collapse of the Phillips Curve
104. Adverse shocks such as the crop failures of 1972-1973 and the oil price increases of 1974 and 1979 pushed the
economy’s
a.
aggregate supply curve outward.
b.
Phillips curve inward toward the origin.
c.
aggregate supply curve inward.
d.
aggregate demand curve inward.
DISC: Aggregate demand and aggre – DISC: Aggregate demand and aggregate supply
United States – BPROG: Analytic
Aggregate demand and aggregate s – Aggregate demand and aggregate supply
Supply-Side Inflation and the Collapse of the Phillips Curve
105. Empirical research suggests that the steepness of the aggregate supply curve depends on the
a.
size of the multiplier.
b.
interest rate.
c.
level of wage rate.
d.
amount of excess capacity in the economy.
DISC: Aggregate demand and aggre – DISC: Aggregate demand and aggregate supply
United States – BPROG: Analytic
Aggregate demand and aggregate s – Aggregate demand and aggregate supply
Supply-Side Inflation and the Collapse of the Phillips Curve
106. An increase in aggregate demand is most likely to cause an increase in the price level when the economy is
a.
operating near full employment.
b.
on the horizontal part of the aggregate supply curve.
c.
operating with high unemployment.
d.
operating with substantial excess capacity.
DISC: Aggregate demand and aggre – DISC: Aggregate demand and aggregate supply
United States – BPROG: Analytic
Aggregate demand and aggregate s – Aggregate demand and aggregate supply
Supply-Side Inflation and the Collapse of the Phillips Curve
107. Which of the following is most likely to lead to demand-side inflation?
a.
an increase in government spending
b.
a decrease in taxes
c.
an increase in the money supply
d.
All of the above are correct.
DISC: Aggregate demand and aggre – DISC: Aggregate demand and aggregate supply
United States – BPROG: Analytic
Aggregate demand and aggregate s – Aggregate demand and aggregate supply
Supply-Side Inflation and the Collapse of the Phillips Curve
108. Which of the following is most likely to result in inflation?
a.
Aggregate demand and aggregate supply grow at the same rate.
b.
Neither aggregate demand nor aggregate supply grows at all.
c.
Aggregate supply grows more rapidly than aggregate demand.
d.
Aggregate demand grows more rapidly than aggregate supply.
DISC: Aggregate demand and aggre – DISC: Aggregate demand and aggregate supply
United States – BPROG: Analytic
Aggregate demand and aggregate s – Aggregate demand and aggregate supply
Supply-Side Inflation and the Collapse of the Phillips Curve
109. One of the reasons why the Phillips curve is no longer viewed as a “menu” of possible choices available to policy
makers is that
a.
in the 1970s and 1980s there was no inflation at all.
b.
analysis indicates there was no such “menu” in the 1960s.
c.
in the 1970s and 1980s much inflation came from the supply side.
d.
economic theory is unable to explain the curve and, therefore, it has been rejected.
DISC: Aggregate demand and aggre – DISC: Aggregate demand and aggregate supply
United States – BPROG: Analytic
Aggregate demand and aggregate s – Aggregate demand and aggregate supply
Supply-Side Inflation and the Collapse of the Phillips Curve
110. One reason why the Phillips curve “broke down” is
a.
most of the inflation of the 1970s was from the demand side.
b.
most of the inflation of the 1970s was from the supply side.
c.
the inflation of the 1970s was foreseen, unlike the inflation of the 1980s.
d.
the inflation of the 1970s was purely random and could not be explained with economic theory.
DISC: Aggregate demand and aggre – DISC: Aggregate demand and aggregate supply
United States – BPROG: Analytic
Aggregate demand and aggregate s – Aggregate demand and aggregate supply
Supply-Side Inflation and the Collapse of the Phillips Curve
111. If fluctuations in economic activity come from the supply side, higher inflation is associated with
a.
lower interest rates.
b.
structural deficits.
c.
higher rates of unemployment.
d.
lower rates of unemployment.
DISC: Aggregate demand and aggre – DISC: Aggregate demand and aggregate supply
United States – BPROG: Analytic
Aggregate demand and aggregate s – Aggregate demand and aggregate supply
Supply-Side Inflation and the Collapse of the Phillips Curve
112. If the aggregate supply curve shifts outward, then unemployment
a.
and inflation will both decrease.
b.
and inflation will both increase.
c.
will increase and inflation will decrease.
d.
will decrease and inflation will increase.
DISC: Aggregate demand and aggre – DISC: Aggregate demand and aggregate supply
United States – BPROG: Analytic
Aggregate demand and aggregate s – Aggregate demand and aggregate supply
Supply-Side Inflation and the Collapse of the Phillips Curve
113. If unemployment and inflation always move in the same direction, then we can infer that business fluctuations are
a.
from the demand side.
b.
from the supply side.
c.
from both the demand and supply side.
d.
purely random events.
DISC: Aggregate demand and aggre – DISC: Aggregate demand and aggregate supply
United States – BPROG: Analytic
Aggregate demand and aggregate s – Aggregate demand and aggregate supply
Supply-Side Inflation and the Collapse of the Phillips Curve
114. In the 1990s, the rising value of the U.S. dollar made imported goods cheaper and this shifted the
a.
aggregate demand curve outward.
b.
aggregate supply curve inward.
c.
aggregate supply curve outward.
d.
total expenditures curve upward.
DISC: Aggregate demand and aggre – DISC: Aggregate demand and aggregate supply
United States – BPROG: Analytic
Aggregate demand and aggregate s – Aggregate demand and aggregate supply
Supply-Side Inflation and the Collapse of the Phillips Curve
115. In the 1990s, the United States benefited from a series of favorable supply shocks. This caused a(n)
a.
increase in inflation and unemployment.
b.
decrease in inflation and unemployment.
c.
increase in inflation and a decrease in unemployment.
d.
decrease in inflation and an increase in unemployment.
DISC: Aggregate demand and aggre – DISC: Aggregate demand and aggregate supply
United States – BPROG: Analytic
Aggregate demand and aggregate s – Aggregate demand and aggregate supply
Supply-Side Inflation and the Collapse of the Phillips Curve
116. The rapid advance in computer technology is one of the reasons given for the shift of the
a.
aggregate demand curve outward.
b.
aggregate supply curve inward.
c.
aggregate supply curve outward.
d.
total expenditures curve upward.
DISC: Aggregate demand and aggre – DISC: Aggregate demand and aggregate supply
United States – BPROG: Analytic
Aggregate demand and aggregate s – Aggregate demand and aggregate supply
Supply-Side Inflation and the Collapse of the Phillips Curve
117. If the favorable supply shocks of the 1990s were reversed in the future, we should expect a(n)
a.
increase in inflation and unemployment.
b.
decrease in inflation and unemployment.
c.
increase in inflation and a decrease in unemployment.
d.
decrease in inflation and an increase in unemployment.
DISC: Aggregate demand and aggre – DISC: Aggregate demand and aggregate supply
United States – BPROG: Analytic
Aggregate demand and aggregate s – Aggregate demand and aggregate supply
Supply-Side Inflation and the Collapse of the Phillips Curve
Figure 17-6
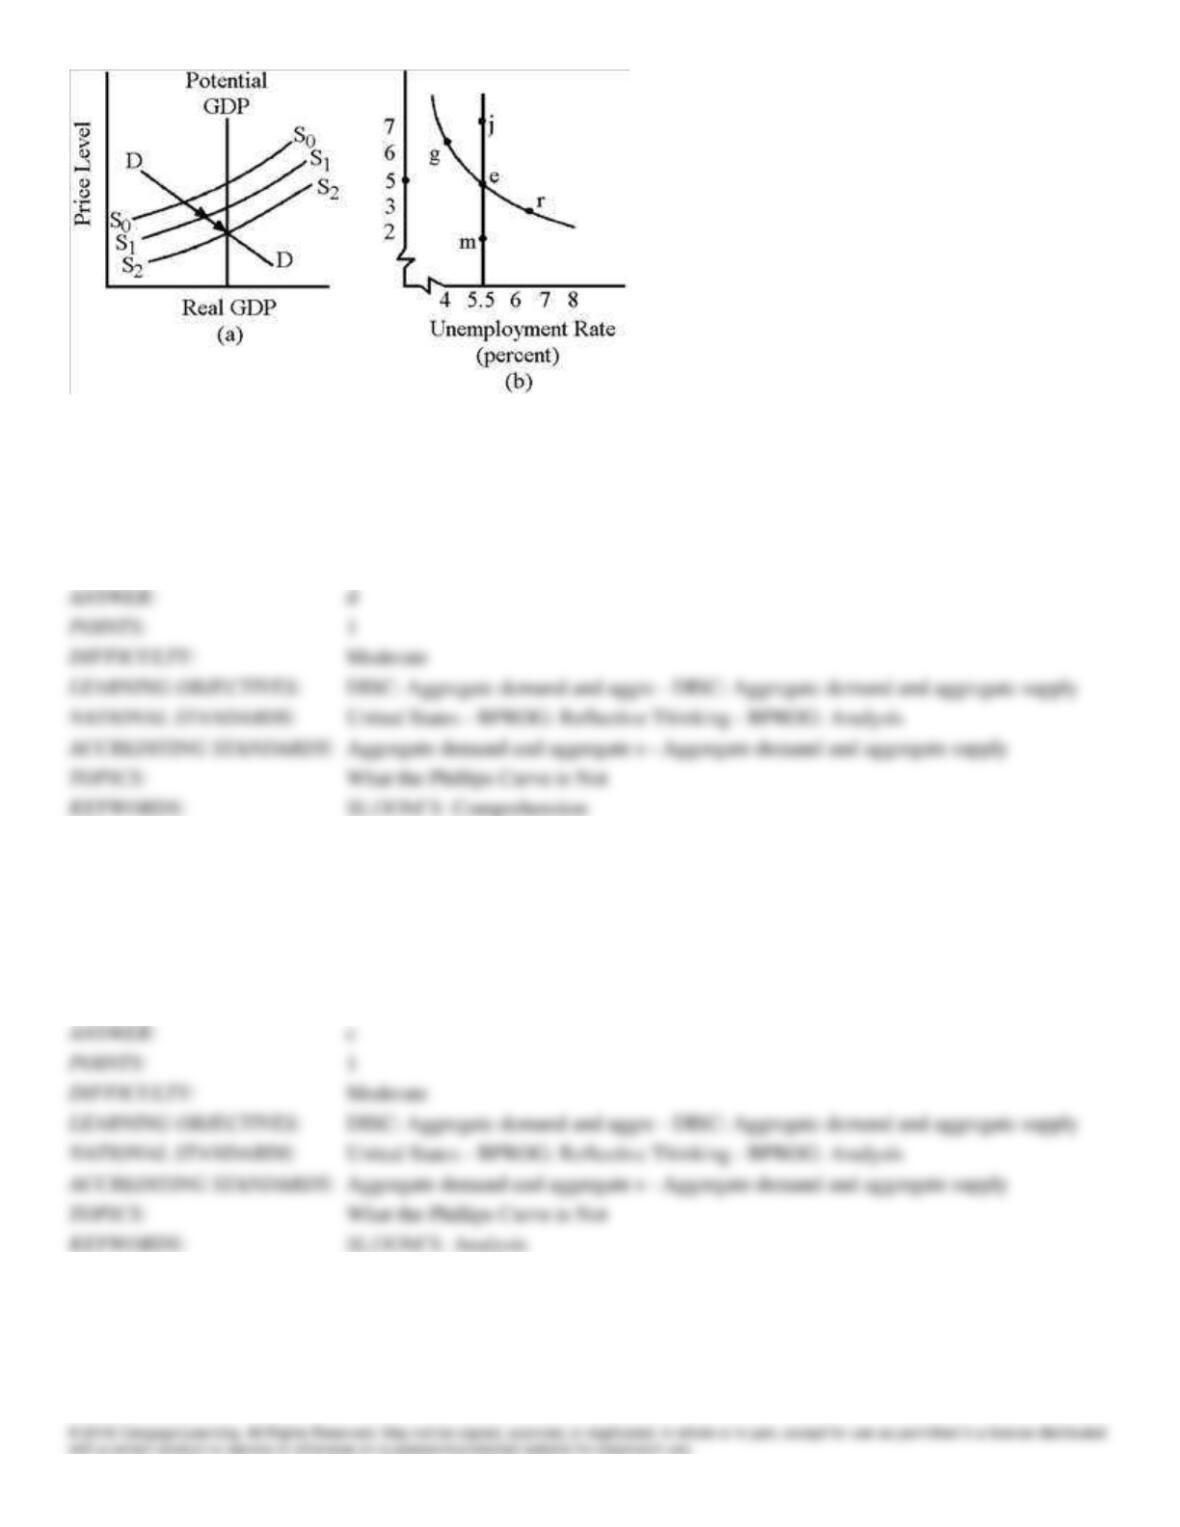
118. If Figure 17-6 (a) illustrates the elimination of a recessionary gap, then the economy should move to what point on
the curves shown in Figure 17-6 (b)?
a.
from e to r
b.
from g to j
c.
from r to j
d.
from r to m
DISC: Aggregate demand and aggre – DISC: Aggregate demand and aggregate supply
United States – BPROG: Reflective Thinking – BPROG: Analysis
Aggregate demand and aggregate s – Aggregate demand and aggregate supply
What the Phillips Curve is Not
119. If the economy in 34-6 (b) is experiencing an inflationary gap (point g), the economy’s self-correcting process will
move unemployment to ____ and inflation to ____.
a.
4 percent; 6 percent
b.
5.5 percent; 5 percent
c.
5.5 percent; 7 percent
d.
5.5 percent; 2 percent
DISC: Aggregate demand and aggre – DISC: Aggregate demand and aggregate supply
United States – BPROG: Reflective Thinking – BPROG: Analysis
Aggregate demand and aggregate s – Aggregate demand and aggregate supply
What the Phillips Curve is Not
120. The short-run Phillips curve in Figure 17-6 would include which of the following points?
a.
g, e, m
b.
g, e, r
c.
j, e, r
d.
j, e, m
DISC: Aggregate demand and aggre – DISC: Aggregate demand and aggregate supply
United States – BPROG: Reflective Thinking – BPROG: Analysis
Aggregate demand and aggregate s – Aggregate demand and aggregate supply
What the Phillips Curve is Not
121. The long-run Phillips curve in Figure 17-6 (b) would include which of the following points?
a.
g, e, m
b.
g, e, r
c.
j, e, r
d.
j, e, m
DISC: Aggregate demand and aggre – DISC: Aggregate demand and aggregate supply
United States – BPROG: Reflective Thinking – BPROG: Analysis
Aggregate demand and aggregate s – Aggregate demand and aggregate supply
What the Phillips Curve is Not
122. Figure 17-6 (b) illustrates that
a.
in the short run, it is possible to “ride the Phillips curve” down toward lower rates of inflation.
b.
in the short run, it is possible to “ride the Phillips curve” up toward lower unemployment by stimulating
aggregate demand.
c.
the Phillips curve connecting points g, e, and r is not a menu of policy choices.
d.
All of the above are correct.
DISC: Aggregate demand and aggre – DISC: Aggregate demand and aggregate supply
United States – BPROG: Reflective Thinking – BPROG: Analysis
Aggregate demand and aggregate s – Aggregate demand and aggregate supply
What the Phillips Curve is Not
123. If an economy’s resources are fully employed,
a.
a great deal of unemployment will be needed to achieve even a small reduction in inflation.
b.
the aggregate supply curve (and thus the Phillips curve) will be flat.
c.
the aggregate supply curve (and thus the Phillips curve) will be steep.
d.
Both a and c are correct.
Moderate
DISC: Aggregate demand and aggre – DISC: Aggregate demand and aggregate supply
United States – BPROG: Analytic
Aggregate demand and aggregate s – Aggregate demand and aggregate supply
What the Phillips Curve is Not
124. The main reason why the economy’s aggregate supply curve slopes upward is that
a.
as the price level rises, businesses incur additional costs.
b.
businesses typically purchase labor and other inputs under long-term contracts that fix the cost of the input in
money terms.
c.
as the price level rises, workers have higher real wages to spend for additional consumer goods.
d.
All of the above are correct.
Moderate
DISC: Aggregate demand and aggre – DISC: Aggregate demand and aggregate supply
United States – BPROG: Analytic
Aggregate demand and aggregate s – Aggregate demand and aggregate supply
What the Phillips Curve is Not
125. One way in which the Phillips curve is misinterpreted is to think of it as
a.
a model of economic activity that explains changes in unemployment and inflation by changes in aggregate
demand.
b.
a statistical relationship between inflation and unemployment.
c.
depicting a number of alternative equilibrium points the economy could achieve.
d.
All of the above.
c
Difficult
DISC: Aggregate demand and aggre – DISC: Aggregate demand and aggregate supply
United States – BPROG: Analytic
Aggregate demand and aggregate s – Aggregate demand and aggregate supply
What the Phillips Curve is Not
126. Most economists think that the economy’s self-correcting mechanism is
a.
relatively rapid.
b.
rapid in the short run and sluggish in the long run.
c.
sluggish in the short run and rapid in the long run.
d.
relatively sluggish.
Easy
DISC: Aggregate demand and aggre – DISC: Aggregate demand and aggregate supply
United States – BPROG: Analytic
Aggregate demand and aggregate s – Aggregate demand and aggregate supply
What the Phillips Curve is Not
127. Most economists agree that the self-correcting mechanism works
a.
very slowly.
b.
very rapidly.
c.
rapidly in the short run and slowly in the long run.
d.
slowly in the short run and rapidly in the long run.
DISC: Aggregate demand and aggre – DISC: Aggregate demand and aggregate supply
United States – BPROG: Analytic
Aggregate demand and aggregate s – Aggregate demand and aggregate supply
What the Phillips Curve is Not
128. One reason that the Phillips curve “broke down” is that it
a.
is unable to explain short-run movements in inflation and unemployment, but does a better job of explaining
long-run movements.
b.
assumes a quick-acting self-correcting mechanism, and the economy has a very slow self-correcting
mechanism.
c.
is a statistical relationship, and some of the points are not sustainable in the long run.
d.
cannot explain demand-side inflation, and it collapsed when demand-side inflation was predominant in the
1970s.
DISC: Aggregate demand and aggre – DISC: Aggregate demand and aggregate supply
United States – BPROG: Analytic
Aggregate demand and aggregate s – Aggregate demand and aggregate supply
What the Phillips Curve is Not
129. The Phillips curve is a statistical relationship that was misrepresented as showing
a.
disequilibrium outcomes of uncoordinated policy.
b.
alternative equilibrium points that the economy could achieve.
c.
the unemployment rates necessary to close a recessionary gap.
d.
the increases in interest rates from different inflation rates.
DISC: Aggregate demand and aggre – DISC: Aggregate demand and aggregate supply
United States – BPROG: Analytic