1112 Miller Economics Today, 16th Edition
21) Refer to the above figure. The marginal benefit of pollution abatement is curve
A) (1). B) (2). C) (3). D) (4).
22) Refer to the above figure. If the marginal cost curve for pollution abatement shifts to the right,
everything considered, the
A) degree of air quality or cleanliness will also decrease.
B) the degree of air quality or cleanliness will stay unchanged.
C) the degree of air quality will improve.
D) the marginal cost of pollution abatement has nothing to do with air quality.
23) Refer to the above figure. Suppose the marginal benefit and the marginal cost curves of
pollution abatement are normally shaped. Technological change that made it easier to produce
in a cleaner fashion would cause
A) curve (4) to shift out, increasing the optimal amount of pollution abatement.
B) curve (3) to shift up, raising the marginal benefits and costs and reducing the amount of
pollution abatement.
C) curve (2) to shift out, increasing the optimal amount of pollution abatement.
D) curve (1) to shift out, increasing the optimal amount of pollution abatement.
24) Refer to the above figure. Suppose the marginal benefit and the marginal cost curves of
pollution abatement are normally shaped. Suppose the equilibrium is for a factory in Los
Angeles. What would happen if the same factory were in the middle of Nevada?
A) The marginal cost curve (1) would shift to (2) and there would be no difference in the level
of abatement.
B) The marginal cost curve (2) would shift to the left and there would be less abatement in
Nevada.
C) The marginal benefit curve (4) would shift to the left and there would be less abatement in
Nevada.
D) The marginal benefit curve (2) would shift to the right and there would be more abatement
in Nevada.
25) The marginal cost curve of pollution abatement is
A) downward sloping. B) upward sloping.
C) horizontal. D) vertical.
26) Technological change that makes it easier to produce in a cleaner fashion would cause
A) the marginal cost curve of pollution abatement to shift left, increasing the degree of air
quality.
B) the marginal cost curve of pollution abatement to shift right, increasing the degree of air
quality
C) the marginal benefit curve of pollution abatement to shift right, increasing the degree of air
quality
D) the marginal benefit curve of pollution abatement to shift left, increasing the degree of air
quality
27) Suppose people value clean air more as their incomes increase, then
A) the marginal cost curve of pollution abatement to shift left, increasing the degree of air
quality.
B) the marginal cost curve of pollution abatement to shift right, increasing the degree of air
quality
C) the marginal benefit curve of pollution abatement to shift right, increasing the degree of air
quality
D) the marginal benefit curve of pollution abatement to shift left, increasing the degree of air
quality
28) The marginal cost curve of pollution abatement
A) slopes upward because of the law of diminishing product.
B) slopes upward because firms will maximize profits.
C) slopes downward because of the law of diminishing marginal utility.
D) slopes downward because of the law of diminishing returns.
29) The optimal amount of air pollution is
A) found by equating the marginal benefits from reducing pollution by one more unit with
the marginal costs of reducing pollution by an additional unit.
B) found by equating the total benefits from reducing pollution by one more unit with the
total costs of reducing pollution by an additional unit.
C) found by setting the marginal benefits from reducing pollution by one more unit equal to
zero.
D) a meaningless concept since we cannot monetize the environment.
30) Which of the following statements is true about the optimal quantity of pollution?
A) It equals zero.
B) Pollution abatement should continue up to the point where marginal cost equals the
average total cost.
C) Trade offs exist between producing a cleaner environment and producing other goods
and services.
D) Firms should be allowed to determine the profit maximizing amount of pollution
abatement.
31) Why is the optimal quantity of pollution not less than the point at which the marginal benefit
equals the marginal cost?
A) The point of intersection occurs at a low level of pollution.
B) There are no external costs below that level.
C) Below that point firms will have to reduce the quantity that they are currently producing
and lower the price.
D) Below that point the value that people place on less pollution is less than the cost of
reducing the pollution.
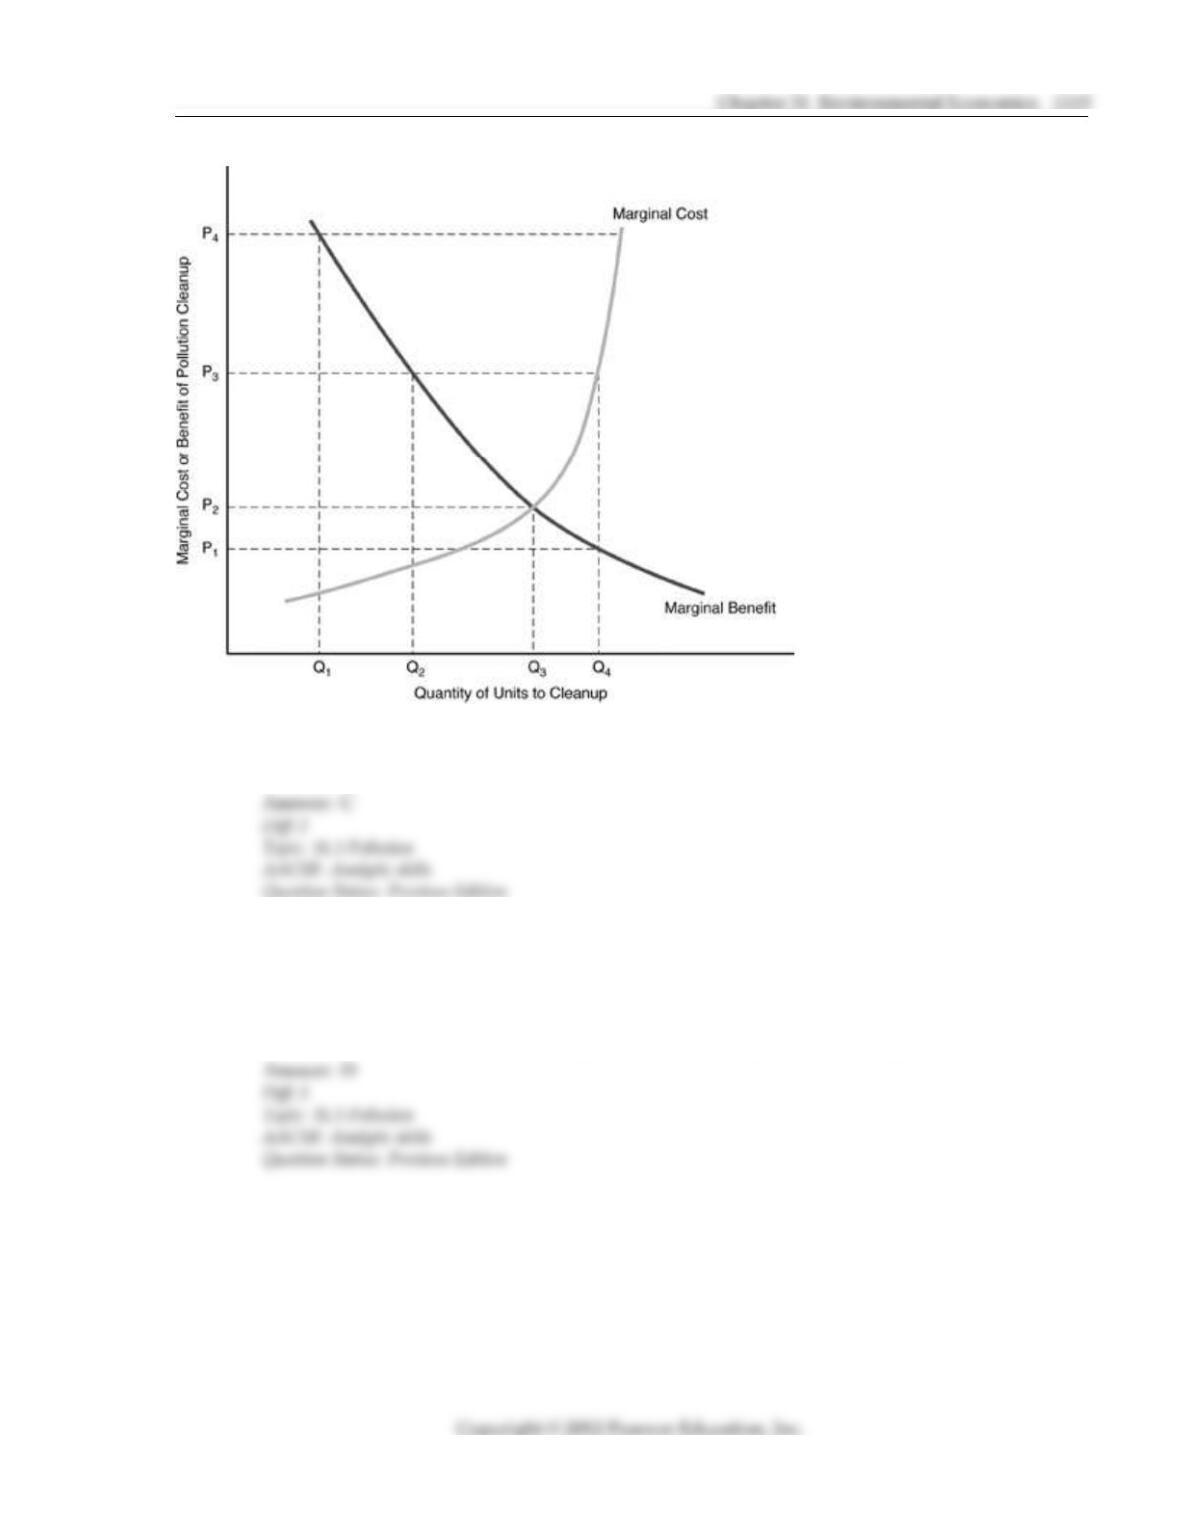
32) In the above figure, the optimal level of pollution cleanup is
A) Q1. B) Q2. C) Q3. D) Q4.
33) In the above figure, if a firm is cleaning up Q4units of pollution, it is an
A) efficient solution, because marginal social benefits are greater than marginal social costs.
B) efficient solution, because marginal social benefits are equal to marginal social costs.
C) inefficient solution, because marginal social benefits are greater than marginal social costs.
D) inefficient solution, because marginal social costs are greater than marginal social benefits.
34) In the above figure, if a firm is cleaning up Q2units of pollution, it is an
A) efficient solution, because marginal social benefits are greater than marginal social costs.
B) efficient solution, because marginal social benefits are equal to marginal social costs.
C) inefficient solution, because marginal social benefits are greater than marginal social costs.
D) inefficient solution, because marginal social costs are greater than marginal social benefits.
35) In the above figure, if a firm is cleaning up Q3units of pollution, it is an
A) efficient solution because marginal social benefits are greater than marginal social costs.
B) efficient solution because marginal social benefits are equal to marginal social costs.
C) inefficient solution because marginal social benefits are greater than marginal social costs.
D) inefficient solution because marginal social costs are greater than marginal social benefits.
36) According to economic analysis, the optimal quantity of pollution exists at the point at which
the
A) total benefit of pollution control is equal to the total cost.
B) marginal benefit of pollution control is equal to the marginal cost.
C) level of pollution is at zero.
D) level of pollution is acceptable to the society.
37) Pollution
A) creates a negative externality.
B) is increased when property rights are defined.
C) is the result of capitalism.
D) exists because air and water are privately owned resources.
38) The idea that it takes 90 percent of your time to clean up the last 10 percent of your house
illustrates that
A) the marginal cost of cleaning up slopes downward.
B) the marginal cost of cleaning up slopes upward.
C) the marginal benefit of cleaning up is constant.
D) the marginal benefit of cleaning up slopes upward.
39) The marginal benefit of the pollution abatement curve
A) has a zero slope. B) has a positive slope.
C) slopes upward. D) slopes downward.
40) Voluntary agreements about cleaning up pollution attempt to
A) internalize externalities. B) internalize private costs.
C) externalize social costs. D) externalize private costs.
41) Generally, as levels of pollution are reduced,
A) marginal benefits from the reduction decrease.
B) marginal benefits from the reduction increase.
C) marginal costs from the reduction decrease.
D) marginal cost from the reduction are constant.
42) Generally, as levels of pollution are reduced,
A) marginal benefits from the reduction increase.
B) marginal costs from the reduction increase.
C) marginal costs from the reduction stay the same.
D) marginal costs from the reduction decrease.
43) The level of pollution at which the marginal benefits equal the marginal cost of cleaning up is
always
A) the zero pollution level. B) the optimal quantity of pollution.
C) the pollution maximum. D) the pollution minimum.
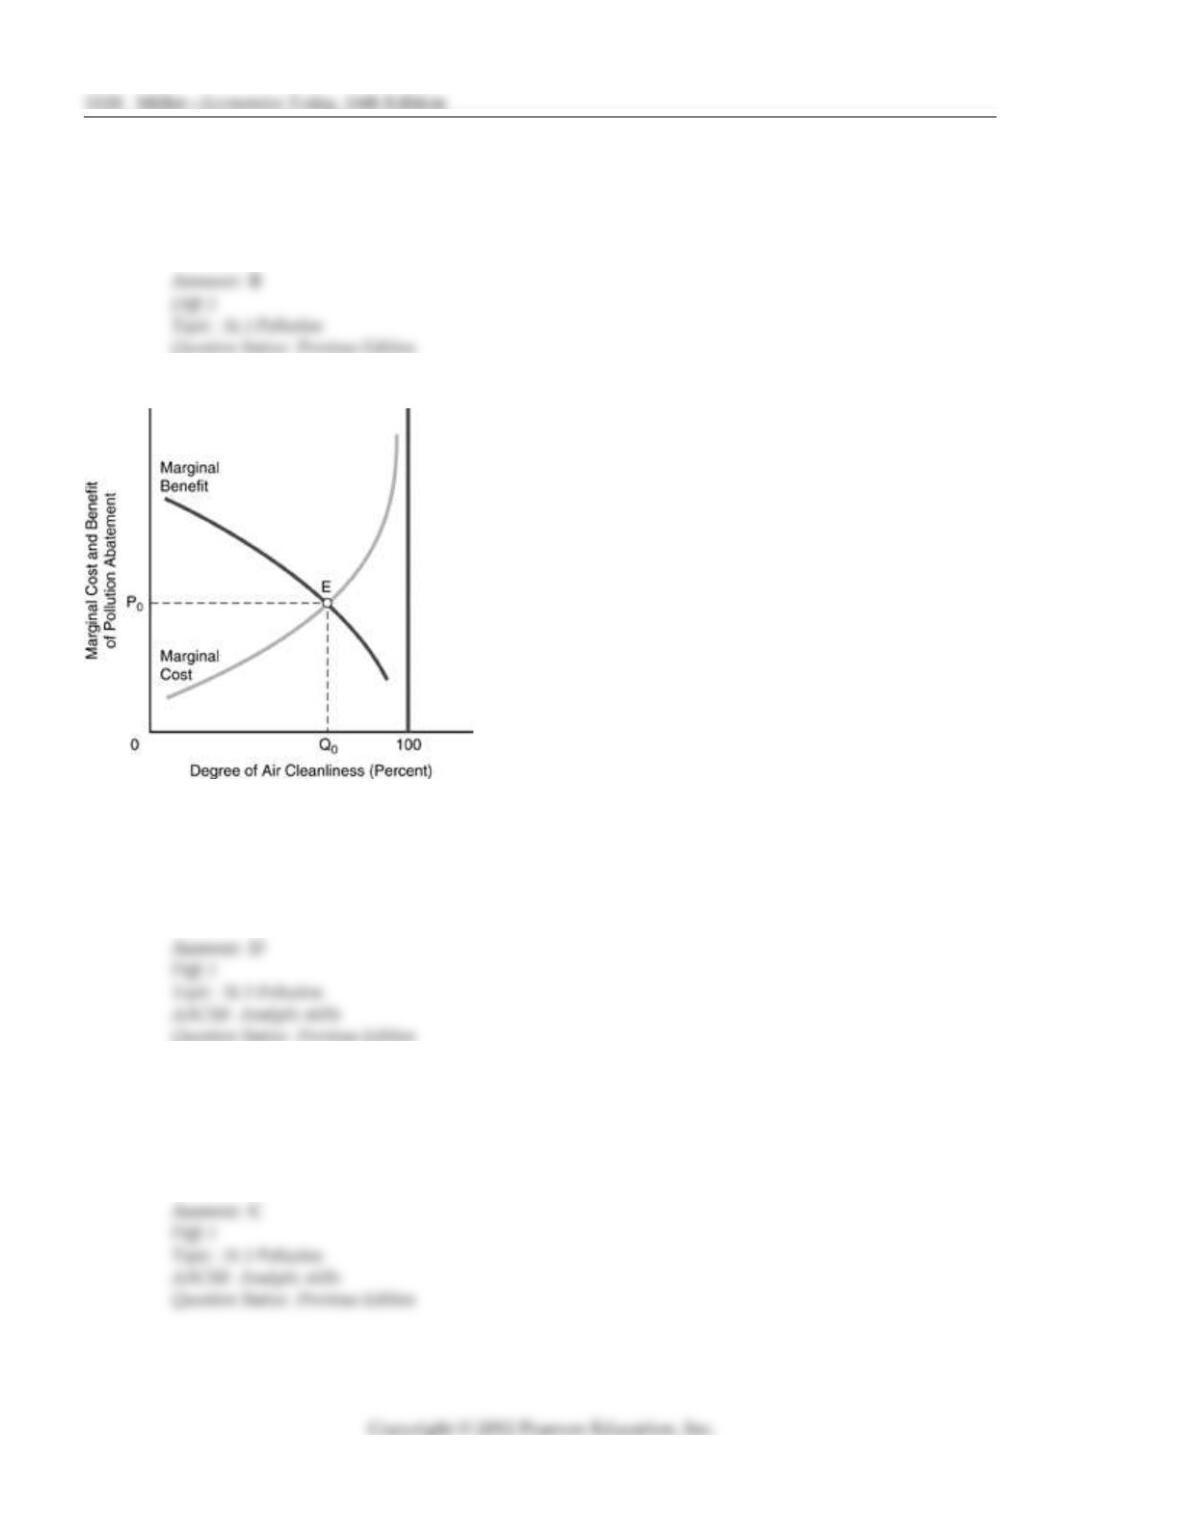
44) In the above figure,
A) the optimal degree of air cleanliness is less than 100 percent.
B) the marginal cost curve slopes up because of the law of diminishing returns.
C) Neither A nor B are correct.
D) Both A and B are correct.
45) The optimal quantity of pollution in the above figure
A) is defined as the level where the marginal benefit is at a maximum.
B) is where the optimal degree of air cleanliness is 100 percent.
C) is the level of pollution at which the marginal benefit equals the marginal cost.
D) cannot be determined.
Chapter 31 Environmental Economics 1119
Quantity of Marginal Marginal
Clean Air (%) Cost ($) Benefit ($)
0 10,000 100,000
25 25,000 50,000
50 37,500 37,500
75 75,000 25,000
100 Infinite 0
46) The above table shows marginal costs and marginal benefits of clean air in a particular
industrial area. In the table, when the quantity of clean air is at 25 percent,
A) the quantity of polluted air is 25 percent.
B) the marginal benefit of clean air exceeds the marginal cost.
C) the marginal benefit of clean air is less than the marginal cost.
D) the quantity of clean air is optimal.
47) The above table shows marginal costs and marginal benefits of clean air in a particular
industrial area. In the table, when the quantity of clean air is at 75 percent,
A) the quantity of polluted air is 75 percent.
B) the marginal benefit of clean air exceeds the marginal cost.
C) the marginal benefit of clean air is less than the marginal cost.
D) the quantity of clean air is optimal.
48) In the above table, the optimal quantity of clean air is
A) 25 percent. B) 50 percent. C) 75 percent. D) 100 percent.
49) The marginal cost of pollution abatement is the
A) additional cost to clean up an additional unit of pollution.
B) additional benefit from cleaning up an additional unit of pollution.
C) total social costs of pollution clean up divided by total social benefits.
D) total social costs of pollution clean up divided by the total units of clean up.
50) The marginal benefit of pollution abatement is the
A) additional cost to clean up an additional unit of pollution.
B) additional benefit from cleaning up an additional unit of pollution.
C) total social costs of pollution clean up divided by total social benefits.
D) total social costs of pollution clean up divided by the total units of clean up.
51) Explain how the optimal quantity of air pollution is determined.
52) The optimal level of pollution is zero. Do you agree or disagree? Why?
53) Suppose people value clean air more as their incomes increase. What would happen to the
optimal amount of clean air as a country develops economically? Is there an economic
prediction we can make from this?
54) Why do economists believe that it is socially optimal to have some amount of pollution?
31.4 Common Property
1) When negative externalities exist, a voluntary agreement can be negotiated. Which of the
following statements is true?
A) Voluntary agreements usually do not work since the owner has no incentive to negotiate.
B) Transactions costs must be low relative to the expected benefits of reaching an agreement.
C) Voluntary agreements are difficult to negotiate because they usually involve government
intervention.
D) Voluntary agreements always leave the owner worse off.
2) Which of the following would be viewed as a common property problem?
A) Your property is burglarized.
B) Vandals damage your property.
C) People pick all of the flowers in a public park.
D) To be safe you must lock your door at night.
3) All the costs associated with making, reaching, and enforcing agreements are called
A) private costs. B) internal costs.
C) transaction costs. D) social costs.
4) The exclusive rights of ownership that allow the use, transfer, and exchange of property are
called
A) common property rights. B) private property rights.
C) externalities. D) social benefits.
5) Economic theory suggests that if natural resources can be held as private property, then
A) conservation will be nonexistent.
B) owners will have an incentive not to abuse them.
C) natural resources will be sold off for immediate use.
D) people will simply hold them and refuse to make them available.
6) Common property ownership is most apt to lead to
A) an efficient allocation of resources.
B) production at a rate at which price is less than social cost.
C) a decrease of externalities.
D) an increase in pollution.
7) When no property rights exist,
A) no one has an economic incentive to care for common property, and an externality may
well occur.
B) there will be no production.
C) externalities will be internalized by voluntary arrangements among a small group of
parties.
D) society will produce beyond the production possibilities frontier, but the allocation of
resources is not apt to be optimal.
8) Private property rights involve
A) exclusive rights to use, transfer, and exchange the property.
B) exclusive rights to use property, but not to exchange the property.
C) rights to enjoy the property in any way desired but not to transfer or exchange the
property.
D) rights granted by the government for renewable terms of 100 years or more.
9) Common property is
A) property that has mineral or oil deposits.
B) a resource that everyone is free to use as much as they want.
C) property owned by a group such as a club.
D) property that has little economic value.
10) Buffalo in the United States almost became extinct while cattle have never been close to
extinction. The difference is due to
A) the greater marginal value of a buffalo relative to a head of cattle, leading to greater
harvesting of buffalo.
B) the use of private property rights on cattle and common property rights on buffalo.
C) the greater marginal value of a head of cattle relative to buffalo, leading to over hunting
of buffalo.
D) the differences in size between the two animals, and the effect of size differences on the
costs of hunting them.
11) Government intervention will not be necessary when voluntary contracting internalizes an
externality. Which of the following is NOT a necessary condition for this to occur?
A) Well defined private property rights
B) Low transaction costs
C) Large numbers of individuals involved in the transactions
D) Low contract enforcement costs
12) The costs associated with reaching and enforcing agreements are called
A) private property costs. B) common property costs.
C) transaction costs. D) public costs.
13) With defined property rights, an externality
A) can only be corrected with government intervention.
B) will not lead to a misallocation of resources.
C) may be internalized with voluntary contracting, under certain circumstances.
D) must lead to society producing inside its production possibilities frontier.
14) A farmer notices that a neighboring rancher s cattle are wandering and destroying some of his
crops. The farmer decides to offer a payment to the rancher if the rancher will reduce the size of
his herd. By doing so, the farmer
A) can be sure that the size of the herd will be reduced and the size of his own harvest will be
increased.
B) indicates to the rancher that there is an opportunity cost to the wandering of the cattle, and
thereby internalizes the externality.
C) inadvertently bears the costs of the externality when the rancher should be liable for the
costs.
D) informs the rancher that the cattle have destroyed crops, which should induce the farmer
to build a fence in order to maintain good relations.
15) One difficulty in using voluntary transactions to internalize externalities is that
A) people are motivated by self interest and are often unwilling to engage in a transaction
that might make another person better off.
B) the government usually will not enforce contracts of this type.
C) transaction costs of coming to an agreement can be very large when numerous people are
involved.
D) people usually don t understand what the real opportunity costs are that they face.
16) Transaction costs are
A) the costs, such as sales taxes, that are imposed by the government.
B) equal to the hourly cost of a lawyer used to write a contract.
C) the costs associated with making, reaching, and enforcing agreements.
D) not true costs because they relate to time rather than real resources.
17) In general, pollution exists if
A) people are unconcerned about the hazards associated with pollution.
B) there are poorly defined private property rights.
C) there are poorly defined common property rights.
D) profit making activity is taken to an extreme.
18) The crux of the problem of pollution is
A) a poorly run Environmental Protection Agency.
B) greed on the part of consumers.
C) greed on the part of producers.
D) poorly defined property rights are expensive to enforce.
19) Changing the ownership of the ocean from common property to private property would
A) ensure that this resource would be allocated in a more efficient manner.
B) ensure that this resource would be allocated in a less efficient manner than under common
property rights.
C) not be economically desirable.
D) result in no appreciable change in efficiency of utilization of this resource.
20) Exclusive rights of ownership that allow the use, transfer, and exchange of property are called
A) common property rights. B) nonexclusive property rights.
C) private property rights. D) public property rights.
21) When no one owns a particular resource,
A) property rights are clearly defined.
B) individuals have legal recourse for any damages caused to their resource.
C) no one has any incentive to consider externality spillovers associated with that resource.
D) positive externalities will arise.
22) Private property rights are
A) an externality.
B) a social cost.
C) property that is owned by everyone and therefore by no one.
D) exclusive rights of ownership.
23) Common property is
A) an externality.
B) a social cost.
C) property that is owned by everyone and therefore by no one.
D) exclusive rights of ownership.
24) Common property often results in
A) a negative externality. B) a social benefit.
C) a private cost. D) exclusive rights of ownership.
25) Common property is
A) a resource that everyone is free to use as much as they want.
B) property that belongs to both spouses in a marriage.
C) property owned by a group such as a club or a church.
D) generic property as opposed to specific property.
26) In general, pollution exists in situations in which
A) people are selfish.
B) people refuse to take social responsibility seriously.
C) there are poorly defined private property rights.
D) there exists public property.
27)
J
oe has broken the mirror of my car. I have legal recourse to sue for damages because of
A) social costs. B) transactions costs.
C) common property rights. D) private property rights.
28) Buffalo in the United States almost became extinct while cattle, an animal that provides similar
products, never has been close to extinction. The difference is due to
A) the greater marginal value of a head of cattle relative to buffalo, leading to over hunting
of buffalo.
B) the greater marginal value of a buffalo relative to a steer, leading to the overharvesting of
buffalo.
C) cattle existing in Europe also while buffalo were specific to North America.
D) the use of private property rights on cattle and common property rights on buffalo.
29) Transaction costs are
A) the costs associated with making a transaction that is required by the government.
B) not true costs since they are often not paid.
C) the costs associated with exchanges in the service area.
D) the costs associated with making, reaching and enforcing agreements.