141) What are social costs? How do they differ from private costs?
142) What is an externality?
143) Why don’t people take into consideration the external costs of their actions and reduce the
amount of externalities?
144) What are the private costs of driving an automobile? What are the external costs?
145) “Private costs are borne by individuals while social costs are borne by society.” Do you
agree or disagree? Why?
146) Suppose that the nation wide average cost of air pollution generated by a car is $1,000.
Would a tax of $1,000 on every car induce people to take external costs into consideration and
bring about the optimal price and output for autos? Explain.
147) Using a graph, show the effects of a negative externality. Where is the socially optimum
point of output? How can it be achieved?
148) Is a uniform per-unit tax on firms that cause an externality an optimal policy for correcting
the externality? Explain.
31.2 Pollution
1) Assuming that pollution cannot be removed from the environment at zero cost, the optimal
level of pollution
A) will be zero.
B) will be negative.
C) will be greater than zero.
D) cannot be determined.
2) As society approaches total pollution abatement
A) the marginal benefit to society declines.
B) the marginal benefit to society increases.
C) the marginal benefit to society increases, but at a decreasing rate.
D) the marginal cost to society declines.
3) As society is near total pollution abatement
A) the marginal cost to society falls.
B) the marginal cost to society rises.
C) the marginal cost to society equals the marginal benefit to society.
D) the marginal cost to society falls but then rises.
4) It is assumed that the marginal benefit of air cleanliness falls with the degree of cleanliness
since
A) the marginal cost of air cleanliness increases.
B) air cleanliness is a public good and not a private good.
C) the marginal utility of air cleanliness falls with the degree of cleanliness.
D) the generation of pollution should be considered an externality.
5) The marginal cost of pollution abatement is graphically illustrated by
A) an upward sloping curve.
B) a downward sloping curve.
C) a horizontal curve.
D) a vertical curve.
6) The marginal benefit of pollution abatement is graphically illustrated by
A) an upward sloping curve.
B) a downward sloping curve.
C) a horizontal curve.
D) a vertical curve.
7) Attaining higher and higher levels of air cleanliness causes
A) additional costs to rise to increasingly high levels.
B) larger and larger increases in per capita incomes.
C) additional costs to fall to lower and lower levels.
D) larger and larger marginal benefits to society.
8) According to economic analysis, the optimal level of pollution is
A) always zero.
B) at the point at which the marginal benefits of pollution control exceed the marginal cost.
C) at the point at which the marginal benefits of pollution control are less than the marginal cost.
D) at the point at which the marginal benefits from pollution control are equal to the marginal
cost.
9) In the process of reducing pollutants in our environment, we are
A) achieving a cleaner environment at no real cost.
B) causing higher levels of unemployment.
C) reallocating resources in an inefficient manner.
D) trading off less of other goods and services for a cleaner environment.
10) In general, we would expect the marginal cost of pollution abatement to be
A) zero.
B) decreasing.
C) increasing.
D) constant.
11) The marginal benefit from pollution abatement
A) increases as pollution abatement increases because people learn to want an even cleaner
environment as the environment gets cleaner.
B) decreases as pollution abatement increases because of the law of diminishing marginal
product.
C) is constant as pollution abatement increases because pollution abatement is valued for its own
sake and not for the utility it provides.
D) decreases as pollution abatement increases because of the law of diminishing marginal utility.
12) The total benefits to society from pollution abatement
A) increase at an increasing rate with the increase of pollution abatement.
B) increase at a decreasing rate with the increase of pollution abatement.
C) decrease at an increasing rate with the increase of pollution abatement.
D) decrease at a decreasing rate with the increase of pollution abatement.
13) The optimal quantity of air pollution is
A) whatever amount of pollution is produced by the profit maximizing firm.
B) found by equating the marginal benefits from further reductions in pollution and the marginal
costs of further reductions in pollution.
C) found by setting the quantity of air pollution equal to the quantity of water pollution.
D) a meaningless concept since monetary values cannot be attached to problems associated with
pollution.
14) Which of the following statements concerning pollution is correct?
A) Economic efficiency requires that pollution be completely eliminated.
B) Economic efficiency dictates that the optimal amount of pollution arises at the point at which
price equals private marginal cost.
C) Pollution should be reduced to the point at which the marginal benefit from further reduction
equals the marginal cost of further reduction.
D) Pollution should be reduced to the extent necessary to return production to the production
possibilities frontier.
15) In economic analysis, the optimal level of pollution
A) is always zero.
B) arises at the point at which the marginal benefit from further reduction equals the marginal
cost of further reduction.
C) occurs at the point at which demand crosses the private cost supply curve.
D) should be determined by the private market without any government intervention.
16) From an economic standpoint, the amount of pollution should be
A) zero.
B) the amount that allows firms to maximize profits.
C) the amount where firms are earning a normal rate of return on investment.
D) at the point at which the marginal benefit from further reduction equals the marginal cost of
further reduction.
17) The optimal amount of pollution is NOT zero because
A) it has been found that pollution in moderate amounts actually has positive benefits.
B) there are no benefits to anyone from having zero pollution.
C) zero pollution would be too costly.
D) we don’t have the political structure that could accomplish the goal.
18) The marginal benefit of pollution abatement
A) increases at an increasing rate as abatement increases.
B) decreases as pollution abatement increases because of the law of diminishing marginal utility.
C) increases as pollution abatement increases because of the law of increasing marginal returns.
D) is constant as pollution abatement increases.
19) The costs of pollution abatement
A) increase at an increasing rate with the increase in pollution abatement.
B) increase at a decreasing rate with the increase in pollution abatement.
C) decrease at an increasing rate with the increase in pollution abatement.
D) decrease at a decreasing rate with the increase in pollution abatement.
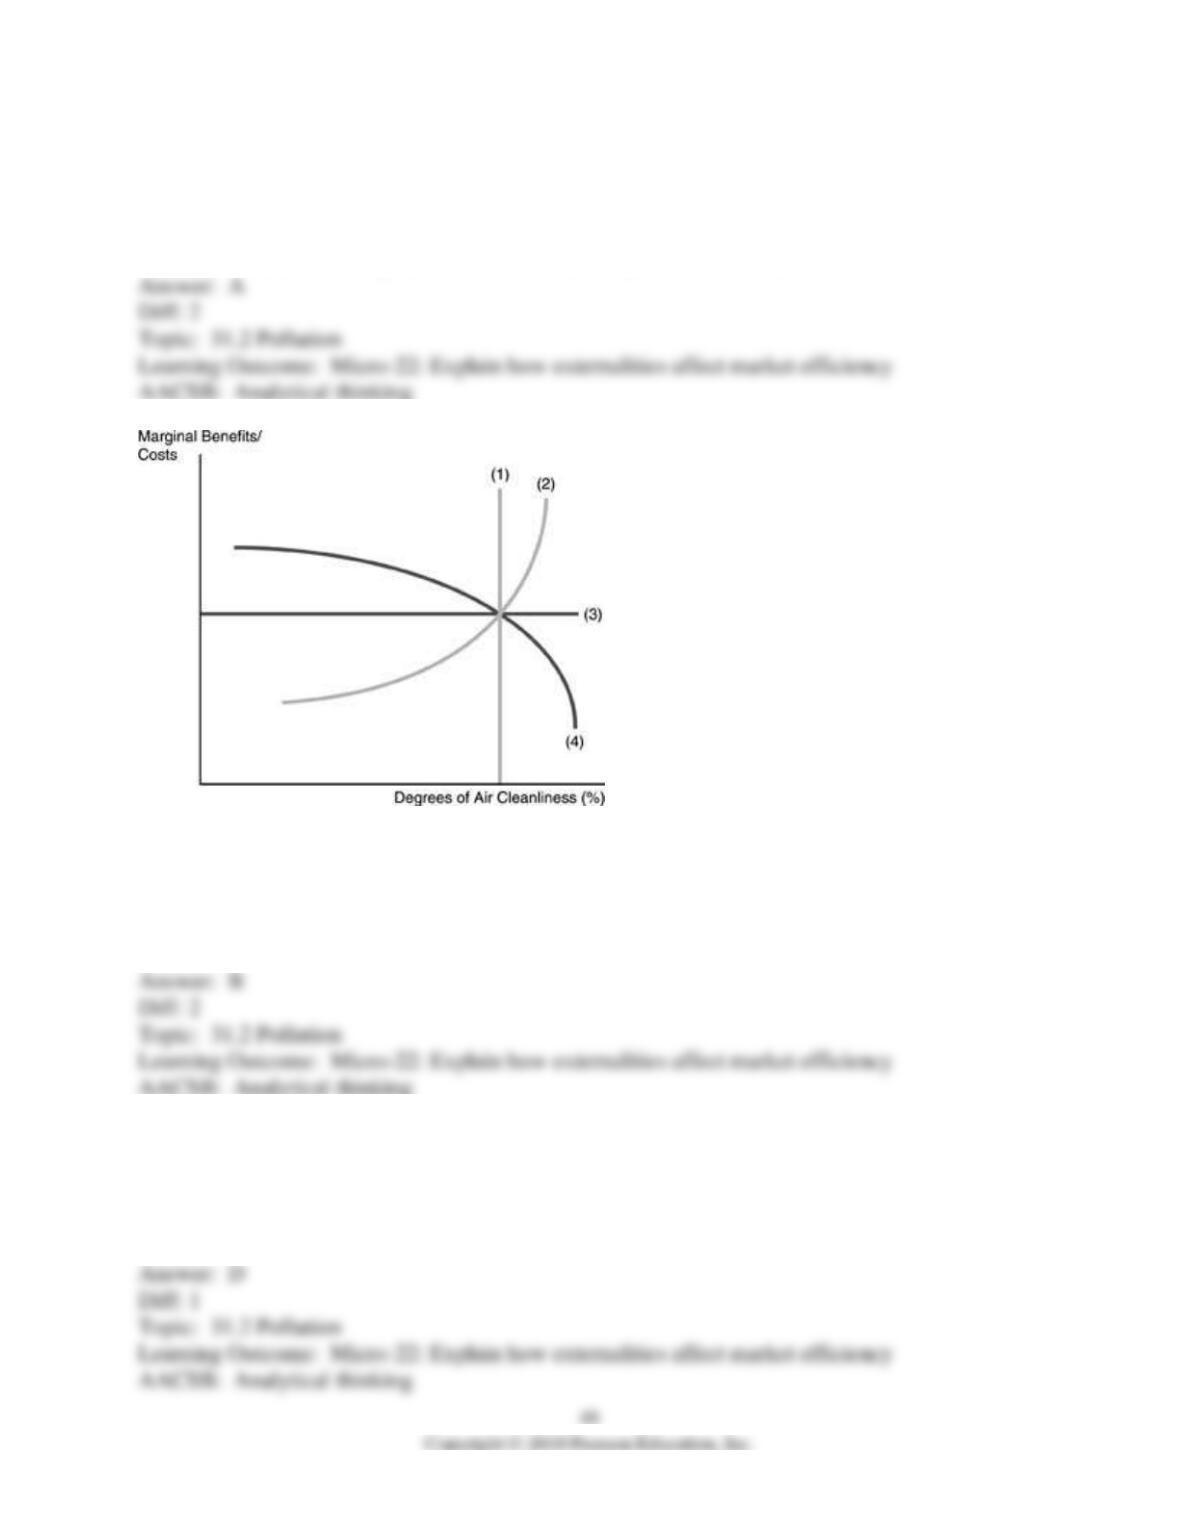
20) Refer to the above figure. The marginal cost of pollution abatement is curve
A) (1).
B) (2).
C) (3).
D) (4).
21) Refer to the above figure. The marginal benefit of pollution abatement is curve
A) (1).
B) (2).
C) (3).
D) (4).
22) Refer to the above figure. If the marginal cost curve for pollution abatement shifts to the
right, everything considered, the
A) degree of air quality or cleanliness will also decrease.
B) the degree of air quality or cleanliness will stay unchanged.
C) the degree of air quality will improve.
D) the marginal cost of pollution abatement has nothing to do with air quality.
23) Refer to the above figure. Suppose the marginal benefit and the marginal cost curves of
pollution abatement are normally shaped. Technological change that made it easier to produce in
a “cleaner” fashion would cause
A) curve (4) to shift out, increasing the optimal amount of pollution abatement.
B) curve (3) to shift up, raising the marginal benefits and costs and reducing the amount of
pollution abatement.
C) curve (2) to shift out, increasing the optimal amount of pollution abatement.
D) curve (1) to shift out, increasing the optimal amount of pollution abatement.
24) Refer to the above figure. Suppose the marginal benefit and the marginal cost curves of
pollution abatement are normally shaped. Suppose the equilibrium is for a factory in Los
Angeles. What would happen if the same factory were in the middle of Nevada?
A) The marginal cost curve (1) would shift to (2) and there would be no difference in the level of
abatement.
B) The marginal cost curve (2) would shift to the left and there would be less abatement in
Nevada.
C) The marginal benefit curve (4) would shift to the left and there would be less abatement in
Nevada.
D) The marginal benefit curve (2) would shift to the right and there would be more abatement in
Nevada.
25) The marginal cost curve of pollution abatement is
A) downward sloping.
B) upward sloping.
C) upward sloping up to a given level and then downward sloping.
D) vertical.
26) Technological change that makes it easier to produce in a “cleaner” fashion would cause
A) the marginal cost curve of pollution abatement to shift left, increasing the degree of air
quality.
B) the marginal cost curve of pollution abatement to shift right, increasing the degree of air
quality.
C) the marginal benefit curve of pollution abatement to shift right, increasing the degree of air
quality.
D) the marginal benefit curve of pollution abatement to shift left, increasing the degree of air
quality.
27) Suppose people value clean air more as their incomes increase, then
A) the marginal cost curve of pollution abatement to shift left, increasing the degree of air
quality.
B) the marginal cost curve of pollution abatement to shift right, increasing the degree of air
quality.
C) the marginal benefit curve of pollution abatement to shift right, increasing the degree of air
quality.
D) the marginal benefit curve of pollution abatement to shift left, increasing the degree of air
quality.
28) The marginal cost curve of pollution abatement
A) slopes upward because of the law of diminishing product.
B) slopes upward because firms will maximize profits.
C) slopes downward because of the law of diminishing marginal utility.
D) slopes downward because of the law of diminishing returns.
29) The optimal amount of air pollution is
A) found by equating the marginal benefits from reducing pollution by one more unit with the
marginal costs of reducing pollution by an additional unit.
B) found by equating the total benefits from reducing pollution by one more unit with the total
costs of reducing pollution by an additional unit.
C) found by setting the marginal benefits from reducing pollution by one more unit equal to zero.
D) a meaningless concept since we cannot monetize the environment.
30) Which of the following statements is TRUE about the optimal quantity of pollution?
A) It equals zero.
B) Pollution abatement should continue up to the point where marginal cost equals the average
total cost.
C) Trade-offs exist between producing a cleaner environment and producing other goods and
services.
D) Firms should be allowed to determine the profit-maximizing amount of pollution abatement.
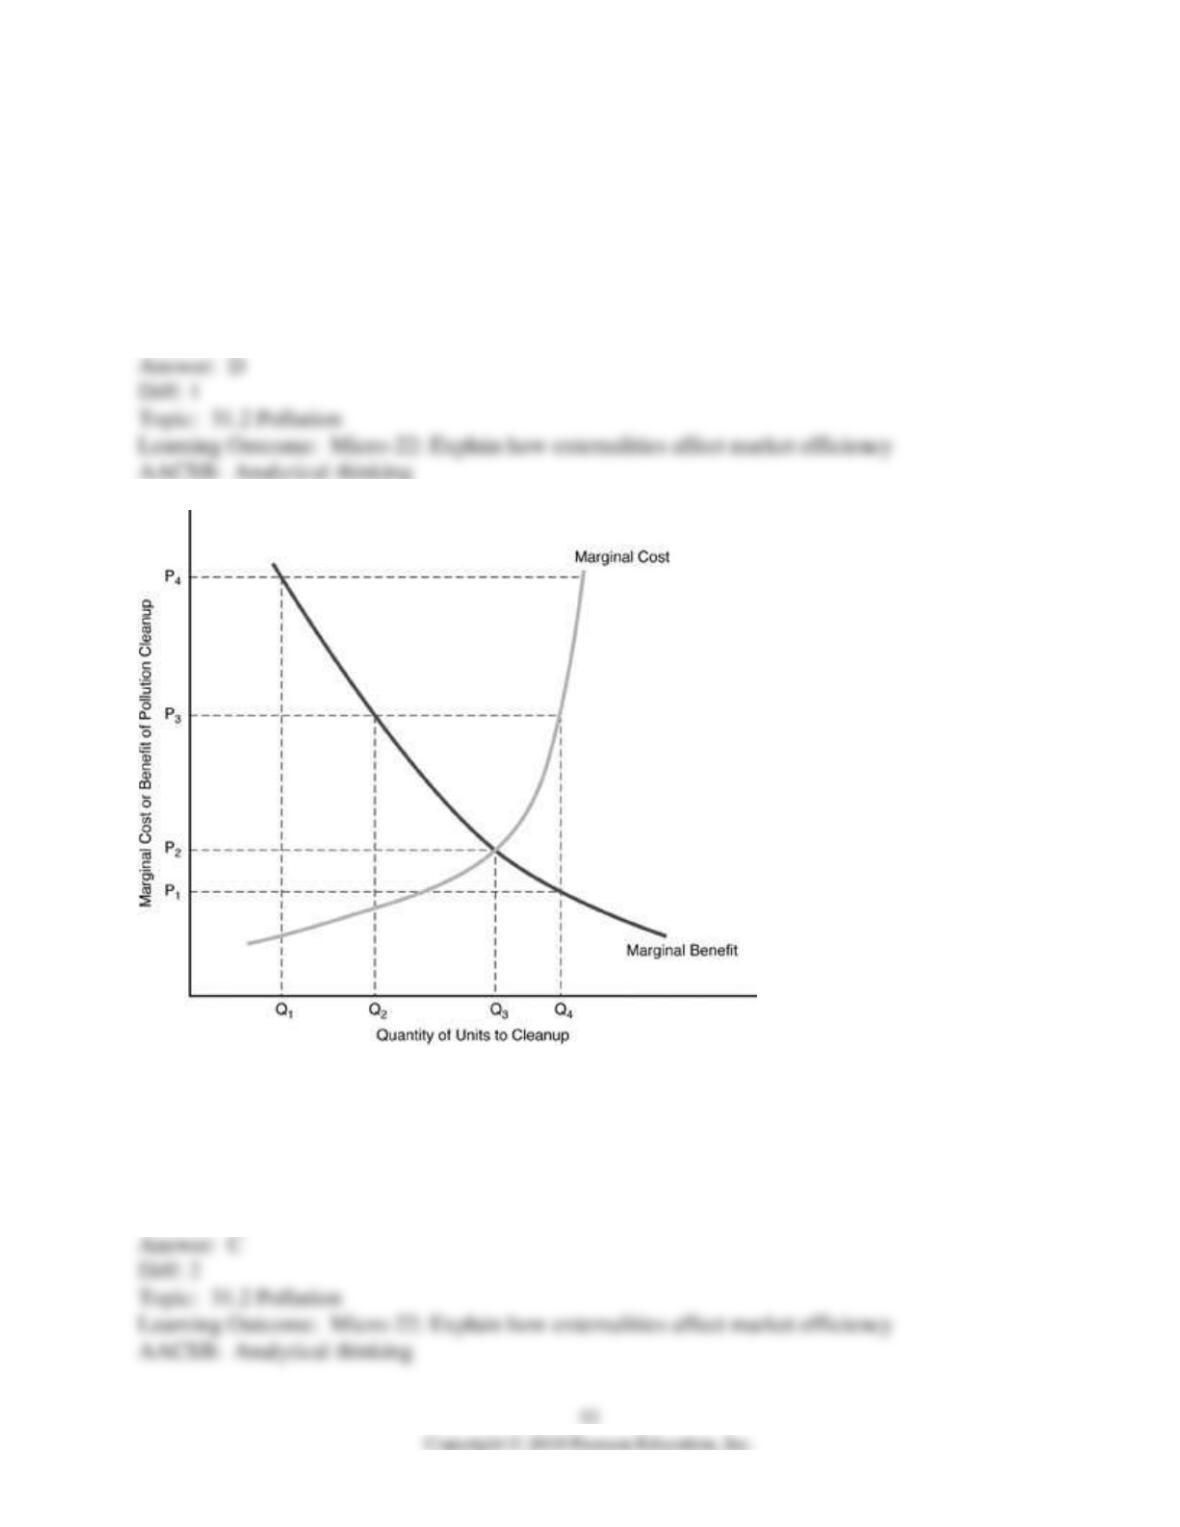
31) Why is the optimal quantity of pollution not less than the point at which the marginal benefit
equals the marginal cost?
A) The point of intersection occurs at a low level of pollution.
B) There are no external costs below that level.
C) Below that point firms will have to reduce the quantity that they are currently producing and
lower the price.
D) Below that point the value that people place on less pollution is less than the cost of reducing
the pollution.
32) In the above figure, the optimal level of pollution cleanup is
A) Q1.
B) Q2.
C) Q3.
D) Q4.
33) In the above figure, if a firm is cleaning up Q4 units of pollution, it is an
A) efficient solution, because marginal social benefits are greater than marginal social costs.
B) efficient solution, because marginal social benefits are equal to marginal social costs.
C) inefficient solution, because marginal social benefits are greater than marginal social costs.
D) inefficient solution, because marginal social costs are greater than marginal social benefits.
34) In the above figure, if a firm is cleaning up Q2 units of pollution, it is an
A) efficient solution, because marginal social benefits are greater than marginal social costs.
B) efficient solution, because marginal social benefits are equal to marginal social costs.
C) inefficient solution, because marginal social benefits are greater than marginal social costs.
D) inefficient solution, because marginal social costs are greater than marginal social benefits.
35) In the above figure, if a firm is cleaning up Q3 units of pollution, it is an
A) efficient solution because marginal social benefits are greater than marginal social costs.
B) efficient solution because marginal social benefits are equal to marginal social costs.
C) inefficient solution because marginal social benefits are greater than marginal social costs.
D) inefficient solution because marginal social costs are greater than marginal social benefits.
36) According to economic analysis, the optimal quantity of pollution exists at the point at which
the
A) total benefit of pollution control is equal to the total cost.
B) marginal benefit of pollution control is equal to the marginal cost.
C) level of pollution is at zero.
D) level of pollution is acceptable to the society.
37) Pollution
A) creates a negative externality.
B) is increased when property rights are defined.
C) is absent in a free market economy.
D) exists because air and water are privately owned resources.
38) The idea that it takes 80 percent of your time to clean up the last 5 percent of your house
illustrates that
A) the marginal cost of cleaning up slopes downward.
B) the marginal cost of cleaning up slopes upward.
C) the marginal benefit of cleaning up is constant.
D) the marginal benefit of cleaning up slopes upward.
39) The marginal benefit of the pollution abatement curve
A) has a zero slope.
B) has a positive slope up to a certain point and then a negative slope.
C) slopes upward.
D) slopes downward.
40) Voluntary agreements about cleaning up pollution attempt to
A) internalize externalities.
B) internalize private costs.
C) externalize social costs.
D) externalize private costs.
41) Generally, as levels of pollution are reduced
A) marginal benefits from the reduction decrease.
B) marginal benefits from the reduction increase.
C) marginal costs from the reduction decrease.
D) marginal benefits totally offset marginal costs.
42) Generally, as levels of pollution are reduced
A) marginal benefits from the reduction increase.
B) marginal costs from the reduction increase.
C) marginal costs from the reduction stay the same.
D) marginal costs from the reduction decrease.
43) The level of pollution at which the marginal benefits equal the marginal cost of cleaning up
is always
A) the zero pollution level.
B) the optimal quantity of pollution.
C) the pollution maximum.
D) the pollution minimum.
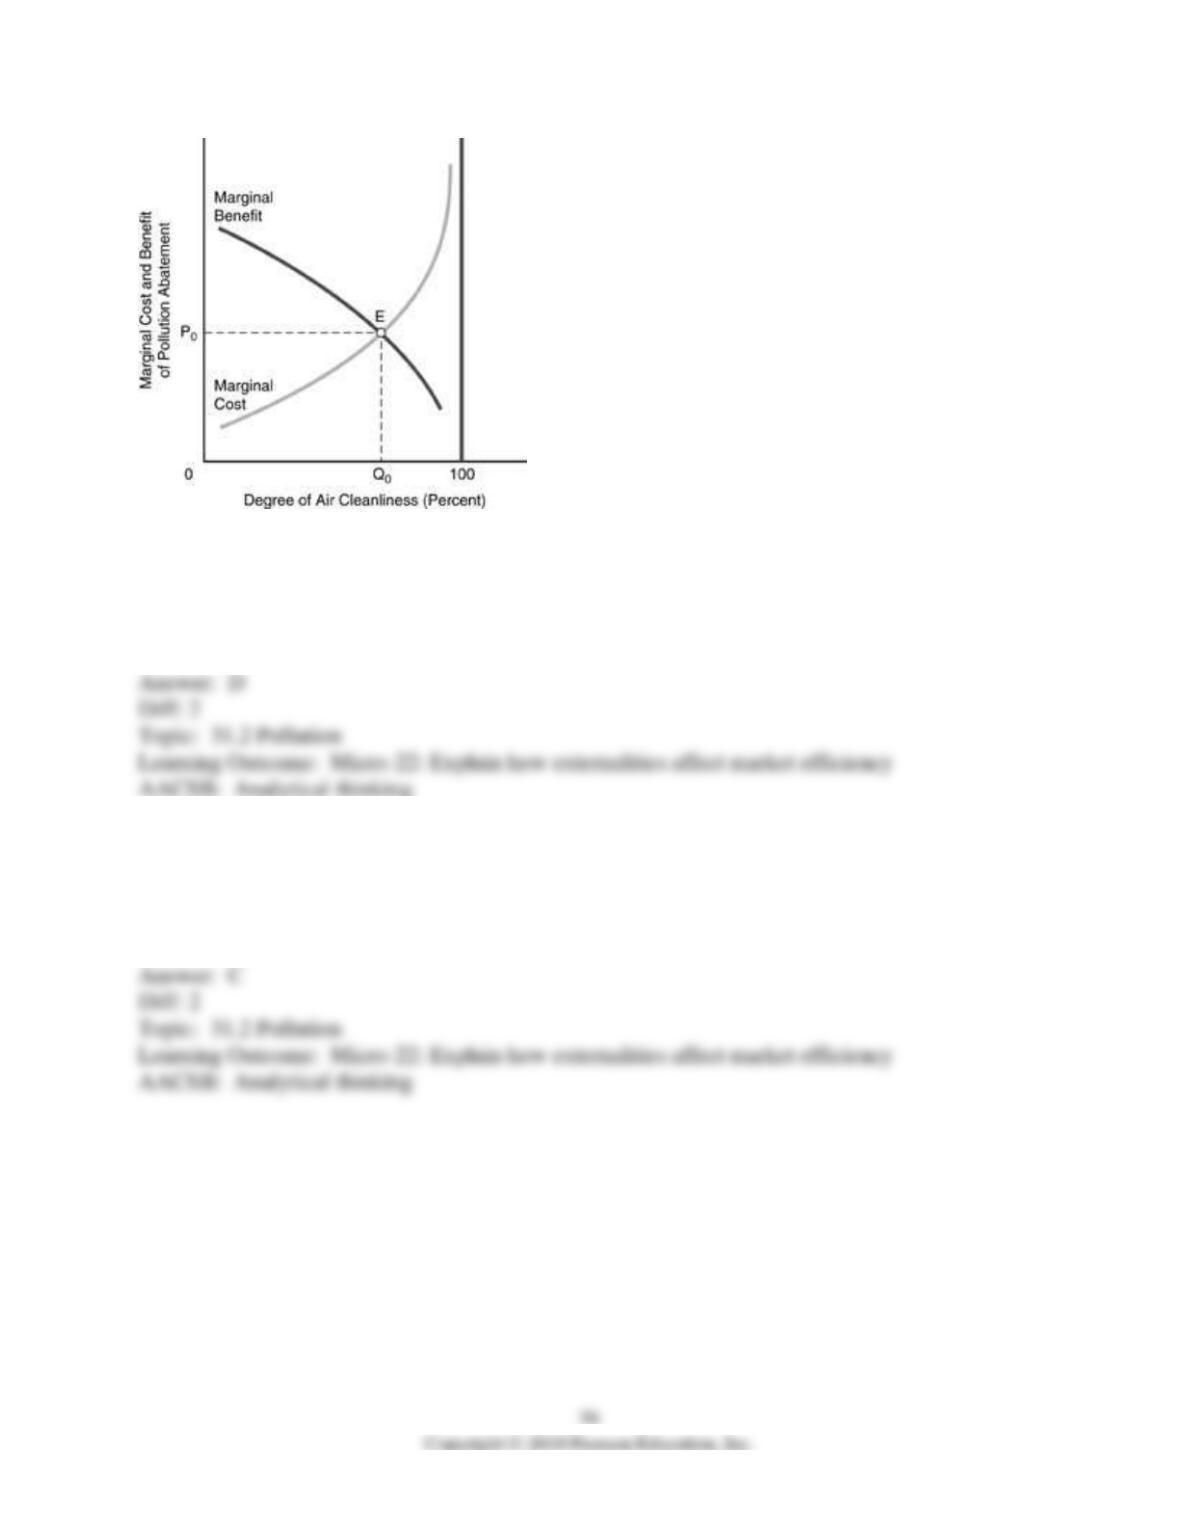
44) In the above figure
A) the optimal degree of air cleanliness is less than 100 percent.
B) the marginal cost curve slopes up because of the law of diminishing returns.
C) Neither A nor B are correct.
D) Both A and B are correct.
45) The optimal quantity of pollution in the above figure
A) is defined as the level where the marginal benefit is at a maximum.
B) is where the optimal degree of air cleanliness is 100 percent.
C) is the level of pollution at which the marginal benefit equals the marginal cost.
D) cannot be determined.
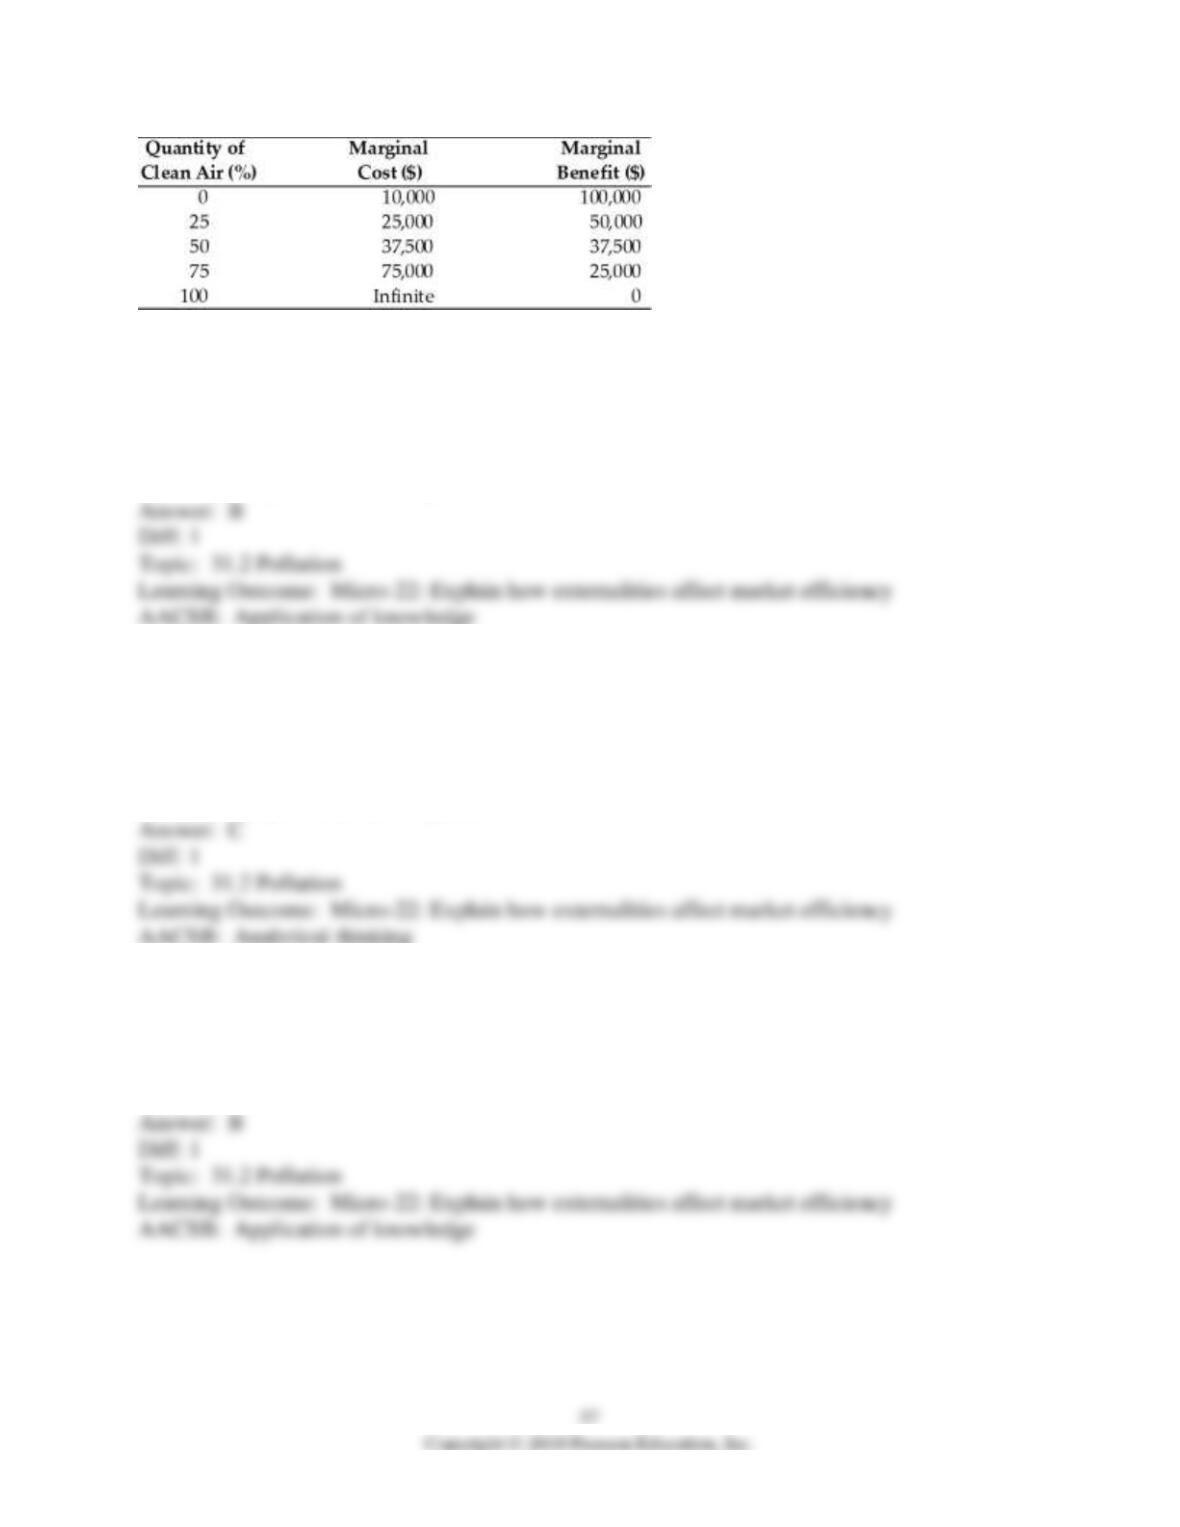
46) The above table shows marginal costs and marginal benefits of clean air in a particular
industrial area. In the table, when the quantity of clean air is at 25 percent
A) the quantity of polluted air is 25 percent.
B) the marginal benefit of clean air exceeds the marginal cost.
C) the marginal benefit of clean air is less than the marginal cost.
D) the quantity of clean air is optimal.
47) The above table shows marginal costs and marginal benefits of clean air in a particular
industrial area. In the table, when the quantity of clean air is at 75 percent
A) the quantity of polluted air is 75 percent.
B) the marginal benefit of clean air exceeds the marginal cost.
C) the marginal benefit of clean air is less than the marginal cost.
D) the quantity of clean air is optimal.
48) In the above table, the optimal quantity of clean air is
A) 25 percent.
B) 50 percent.
C) 75 percent.
D) 100 percent.
49) The marginal cost of pollution abatement is the
A) additional cost to clean up an additional unit of pollution.
B) additional benefit from cleaning up an additional unit of pollution.
C) total social costs of pollution clean-up divided by total social benefits.
D) total social costs of pollution clean-up divided by the total units of clean-up.
50) The marginal benefit of pollution abatement is the
A) additional cost to clean up an additional unit of pollution.
B) additional benefit from cleaning up an additional unit of pollution.
C) total social costs of pollution clean-up divided by total social benefits.
D) total social costs of pollution clean-up divided by the total units of clean-up.
51) Explain how the optimal quantity of air pollution is determined.
52) “The optimal level of pollution is zero.” Do you agree or disagree? Why?
53) Suppose people value clean air more as their incomes increase. What would happen to the
optimal amount of clean air as a country develops economically? Is there an economic prediction
we can make from this?
54) Why do economists believe that it is socially optimal to have some amount of pollution?
31.3 Reducing Humanity’s Carbon Footprint: Restraining Pollution-Causing Activities
1) The Framework Convention on Climate Change took place in
A) the 1973-1979 Tokyo Round.
B) the 1987-1993 Uruguay Round.
C) the 1997 Kyoto Protocol.
D) the 2001 Doha Round.
2) In the Kyoto Protocol, participating nations agreed to
A) trade carbon-dioxide permits.
B) eliminate all emissions of greenhouse gases by 2020.
C) reduce their overall emissions of greenhouse gases between 1997 and 2020 to as much as 20
percent below 1990 levels.
D) buy greenhouse gas emission permits from developing nations.

3) In 2005, the European Union began a program to
A) reduce greenhouse gas emissions by 10 percent within 5 years.
B) eliminate greenhouse gas emissions by 50 percent within 15 years.
C) subsidize firms that pollute more than a given limit.
D) allow the trading of carbon-dioxide permits among firms.
4) In a market for emission permits, firms that emit over their allowed limits
A) are forced to shut down.
B) are taxed by the government for the amount of emissions.
C) receive a subsidy for the amount of emissions.
D) pay a price of these emissions.
5) In a market for emission permits, firms that emit over their allowed limits
A) are forced to shut down.
B) are taxed by the government for the amount of emissions.
C) will sell their excess allowances through a trading system.
D) must buy more allowances through a trading system.
6) In a market for emission permits, firms that emit below their allowed limits
A) will buy even more allowances through a trading system.
B) are taxed by the government for the amount of emissions.
C) receive a subsidy for the amount of emissions.
D) will sell their excess allowances through a trading system.