Page 1
1.
An industry with only two firms is generally called:
A)
a monopoly.
B)
monopolistic competition.
C)
a duopoly.
D)
perfect competition.
2.
A duopoly is an industry that consists of:
A)
a single firm.
B)
two firms.
C)
three or more firms.
D)
a large number of small firms.
3.
An industry that consists of two firms is:
A)
a duopoly.
B)
a monopoly.
C)
a monopsony.
D)
monopolistic competition.
4.
_____ occurs when the only two firms in an industry agree to fix the price at a given
level.
A)
Collusion
B)
The ability to satisfy demand
C)
Price extortion
D)
Price leadership
5.
An extreme case of oligopoly in which firms collude to raise joint profits is known as a:
A)
duopoly.
B)
cartel.
C)
dominant producer.
D)
price war.
6.
If there are two gas stations in a very small town, then the gas station business there is
probably best characterized as:
A)
perfectly competitive.
B)
monopolistically competitive.
C)
monopolistic.
D)
oligopolistic.
Page 2
7.
Collusive agreements are typically difficult for cartels to maintain because each firm can
increase profits by:
A)
producing more than the quantity that maximizes joint profits.
B)
producing less than the quantity that maximizes joint profits.
C)
charging more than the price that maximizes joint cartel profits.
D)
advertising less than will maximize joint cartel profits.
8.
The owners of the gas stations in a town are trying to set up a cartel that will raise the
price of gasoline. Which scenario will increase the chances that the cartel will fail
because of cheating by the owners?
A)
All of the gas stations face the same costs.
B)
There are only a few gas stations.
C)
The gas stations are producing as much as they can.
D)
The gas stations vary in terms of the services that they provide.
9.
In an oligopoly market, collusion between firms usually leads to higher profits than does
noncooperative behavior. However, formal, overt collusion doesn’t usually occur in the
United States because:
I. it is illegal.
II. there is an incentive for each firm to cheat on a collusive agreement.
III. an oligopolistic firm will typically prefer lower profits for itself if the only way to
make higher collective profits in the industry is to improve the profit position of its
rivals.
A)
I only
B)
II only
C)
I and II
D)
II and III
10.
Gary’s Gas and Frank’s Fuel are the only two providers of gasoline in their small town.
Gary and Frank decide to form a cartel to raise the price of gasoline. The total industry
profits are highest when _____ cheat(s) on the agreement, and Gary’s profits are highest
when _____.
A)
neither firm; neither firm cheats on the agreement
B)
neither firm; Gary cheats but Frank does not
C)
both firms; Gary cheats but Frank does not
D)
both Gary and Frank; both Gary and Frank cheat

Page 3
11.
In which situation does overt collusion take place?
A)
Smaller firms in an industry have an unspoken agreement to charge the same price
as the largest firm.
B)
Firms in an industry agree openly on price and output, and they jointly make other
decisions aimed at achieving monopoly profits.
C)
Competition among a large number of small firms generates similar but slightly
different prices.
D)
Competition among a large number of small firms generates a stable market price.
Use the following to answer questions 12-38:
12.
(Ref 30-1 Table: Demand Schedule of Gadgets) Use Table 30-1: Demand Schedule of
Gadgets. The market for gadgets consists of two producers, Margaret and Ray. Each
firm can produce gadgets with no marginal cost or fixed cost. If these two producers
formed a cartel and acted to maximize total industry profits, total industry output would
be _____, and the price would be _____.
A)
1,000; $10
B)
100; $9
C)
400; $6
D)
500; $5
Page 4
13.
(Ref 30-1 Table: Demand Schedule of Gadgets) Use Table 30-1: Demand Schedule of
Gadgets. The market for gadgets consists of two producers, Margaret and Ray. Each
firm can produce gadgets with no marginal cost or fixed cost. If these two producers
formed a cartel and acted to maximize total industry profits, total industry profit would
be:
A)
$10,000.
B)
$5,000.
C)
$2,500.
D)
$1,250.
14.
(Ref 30-1 Table: Demand Schedule of Gadgets) Use Table 30-1: Demand Schedule of
Gadgets. The market for gadgets consists of two producers, Margaret and Ray. Each
firm can produce gadgets with no marginal cost or fixed cost. If these two producers
formed a cartel, split the production of output equally, and acted to maximize total
industry profits, each firm’s output would be _____, and each firm’s profit would be
_____.
A)
500; $2,500
B)
250; $1,250
C)
1,000; $500
D)
1,000; $10,000
15.
(Ref 30-1 Table: Demand Schedule of Gadgets) Use Table 30-1: Demand Schedule of
Gadgets. The market for gadgets consists of two producers, Margaret and Ray. Each
firm can produce gadgets with no marginal cost or fixed cost. Suppose that these two
producers have formed a cartel and are maximizing total industry profits and splitting
the production of output evenly between themselves. If Margaret decides to cheat on the
agreement and sell 100 more gadgets, how many gadgets will she sell?
A)
0
B)
250
C)
350
D)
600
16.
(Ref 30-1 Table: Demand Schedule of Gadgets) Use Table 30-1: Demand Schedule of
Gadgets. The market for gadgets consists of two producers, Margaret and Ray. Each
firm can produce gadgets with no marginal cost or fixed cost. Suppose that these two
producers have formed a cartel, agreed to split production of output evenly, and are
maximizing total industry profits. If Margaret decides to cheat on the agreement and sell
100 more gadgets, the market price of gadgets will be:
A)
$4.
B)
$5.
C)
$6.
D)
$7.
Page 5
17.
(Ref 30-1 Table: Demand Schedule of Gadgets) Use Table 30-1: Demand Schedule of
Gadgets. The market for gadgets consists of two producers, Margaret and Ray. Each
firm can produce gadgets with no marginal cost or fixed cost. Suppose that these two
producers have formed a cartel, agreed to split production of output evenly, and are
maximizing total industry profits. If Margaret decides to cheat on the agreement and sell
100 more gadgets, Margaret’s profit will be _____, and Ray’s profit will be _____.
A)
$1,250; $1,250
B)
$500; $500
C)
$1,400; $1,000
D)
$1,000; $1,400
18.
(Ref 30-1 Table: Demand Schedule of Gadgets) Use Table 30-1: Demand Schedule of
Gadgets. The market for gadgets consists of two producers, Margaret and Ray. Each
firm can produce gadgets with no marginal cost or fixed cost. Suppose that these two
producers have formed a cartel, agreed to split production of output evenly, and are
maximizing total industry profits. If Margaret decides to cheat on the agreement and sell
100 more gadgets, Margaret’s quantity effect will be a(n) _____ in profit of _____.
A)
decrease; $250
B)
increase; $150
C)
increase; $400
D)
decrease; $400
19.
(Ref 30-1 Table: Demand Schedule of Gadgets) Use Table 30-1: Demand Schedule of
Gadgets. The market for gadgets consists of two producers, Margaret and Ray. Each
firm can produce gadgets with no marginal cost or fixed cost. Suppose that these two
producers have formed a cartel, agreed to split production of output evenly, and are
maximizing total industry profits. If Margaret decides to cheat on the agreement and sell
100 more gadgets, Margaret’s price effect will be a(n) _____ in profit of _____.
A)
decrease; $400
B)
increase; $400
C)
increase; $250
D)
decrease; $250
Page 6
20.
(Ref 30-1 Table: Demand Schedule of Gadgets) Use Table 30-1: Demand Schedule of
Gadgets. The market for gadgets consists of two producers, Margaret and Ray. Each
firm can produce gadgets with no marginal cost or fixed cost. Suppose that these two
producers have formed a cartel, agreed to split production of output evenly, and are
maximizing total industry profits. If Margaret decides to cheat on the agreement and sell
100 more gadgets but Ray continues to sell 250 gadgets, Ray’s profits will be:
A)
$1,400.
B)
$1,250.
C)
$1,000.
D)
$400.
21.
(Ref 30-1 Table: Demand Schedule of Gadgets) Use Table 30-1: Demand Schedule of
Gadgets. The market for gadgets consists of two producers, Margaret and Ray. Each
firm can produce gadgets with no marginal cost or fixed cost. If industry output is 350
gadgets produced by Margaret and 250 gadgets produced by Ray and if Ray decides to
increase output by an additional 100 gadgets, industry output will be:
A)
700.
B)
600.
C)
500.
D)
400.
22.
(Ref 30-1 Table: Demand Schedule of Gadgets) Use Table 30-1: Demand Schedule of
Gadgets. The market for gadgets consists of two producers, Margaret and Ray. Each
firm can produce gadgets with no marginal cost or fixed cost. If industry output is 350
gadgets produced by Margaret and 250 gadgets produced by Ray and if Ray decides to
increase output by an additional 100 gadgets, industry price will be:
A)
$3.
B)
$2.
C)
$1.
D)
$0.
23.
(Ref 30-1 Table: Demand Schedule of Gadgets) Use Table 30-1: Demand Schedule of
Gadgets. The market for gadgets consists of two producers, Margaret and Ray. Each
firm can produce gadgets with no marginal cost or fixed cost. If industry output is 350
gadgets produced by Margaret and 250 gadgets produced by Ray and if Ray decides to
increase output by an additional 100 gadgets, Margaret’s profit will be _____, and Ray’s
profit will be _____.
A)
$1,750; $1,250
B)
$1,250; $1,250
C)
$1,400; $1,000
D)
$1,050; $1,050
Page 7
24.
(Ref 30-1 Table: Demand Schedule of Gadgets) Use Table 30-1: Demand Schedule of
Gadgets. The market for gadgets consists of two producers, Margaret and Ray. Each
firm can produce gadgets with no marginal cost or fixed cost. If industry output is 700,
each firm’s profits will be _____ than they would be at the output of 500, which
maximizes industry profit.
A)
$150 less
B)
$150 more
C)
$200 more
D)
$200 less
25.
(Ref 30-1 Table: Demand Schedule of Gadgets) Use Table 30-1: Demand Schedule of
Gadgets. The market for gadgets consists of two producers, Margaret and Ray. Each
firm can produce gadgets with no marginal cost or fixed cost. Suppose that these two
producers have formed a cartel, agreed to split production of output evenly, and are
maximizing total industry profits. Total industry output would be _____ gadgets.
A)
10
B)
5
C)
50
D)
500
26.
(Ref 30-1 Table: Demand Schedule of Gadgets) Use Table 30-1: Demand Schedule of
Gadgets. The market for gadgets consists of two producers, Margaret and Ray. Each
firm can produce gadgets at a marginal cost of $2 and no fixed cost. If these two
producers formed a cartel, agreed to split production of output evenly, and acted to
maximize total industry profits, total industry output would be _____, and the price
would be _____.
A)
1,000; $10
B)
100; $9
C)
400; $6
D)
500; $5
27.
(Ref 30-1 Table: Demand Schedule of Gadgets) Use Table 30-1: Demand Schedule of
Gadgets. The market for gadgets consists of two producers, Margaret and Ray. Each
firm can produce gadgets at a marginal cost of $2 and no fixed cost. If these two
producers formed a cartel, agreed to split production of output evenly, and acted to
maximize total industry profits, total industry profit would be:
A)
$10,000.
B)
$5,000.
C)
$2,500.
D)
$1,600.
Page 8
28.
(Ref 30-1 Table: Demand Schedule of Gadgets) Use Table 30-1: Demand Schedule of
Gadgets. The market for gadgets consists of two producers, Margaret and Ray. Each
firm can produce gadgets at a marginal cost of $2 and no fixed cost. Suppose that these
two producers have formed a cartel, agreed to split production of output evenly, and are
maximizing total industry profits. Each firm’s output would be _____, and each firm’s
profit would be _____.
A)
500; $2,500
B)
200; $800
C)
1,000; $500
D)
1,000; $10,000
29.
(Ref 30-1 Table: Demand Schedule of Gadgets) Use Table 30-1: Demand Schedule of
Gadgets. The market for gadgets consists of two producers, Margaret and Ray. Each
firm can produce gadgets at a marginal cost of $2 and no fixed cost. Suppose that these
two producers have formed a cartel, agreed to split production of output evenly, and are
maximizing total industry profits. If Margaret decides to cheat on the agreement and sell
100 more gadgets, how many gadgets will Margaret sell?
A)
500
B)
200
C)
300
D)
600
30.
(Ref 30-1 Table: Demand Schedule of Gadgets) Use Table 30-1: Demand Schedule of
Gadgets. The market for gadgets consists of two producers, Margaret and Ray. Each
firm can produce gadgets at a marginal cost of $2 and no fixed cost. Suppose that these
two producers have formed a cartel, agreed to split production of output evenly, and are
maximizing total industry profits. If Margaret decides to cheat on the agreement and sell
100 more gadgets, the market price of gadgets will be:
A)
$4.
B)
$5.
C)
$6.
D)
$7.
Page 9
31.
(Ref 30-1 Table: Demand Schedule of Gadgets) Use Table 30-1: Demand Schedule of
Gadgets. The market for gadgets consists of two producers, Margaret and Ray. Each
firm can produce gadgets at a marginal cost of $2 and no fixed cost. Suppose that these
two producers have formed a cartel, agreed to split production of output evenly, and are
maximizing total industry profits. If Margaret decides to cheat on the agreement and sell
100 more gadgets, Margaret’s profit will be _____, and Ray’s profit will be _____.
A)
$1500; $1,000
B)
$900; $600
C)
$1,400; $1,000
D)
$1,000; $1,400
32.
(Ref 30-1 Table: Demand Schedule of Gadgets) Use Table 30-1: Demand Schedule of
Gadgets. The market for gadgets consists of two producers, Margaret and Ray. Each
firm can produce gadgets at a marginal cost of $2 and no fixed cost. Suppose that these
two producers have formed a cartel, agreed to split production of output evenly, and are
maximizing total industry profits. If Margaret decides to cheat on the agreement and sell
100 more gadgets, Margaret’s quantity effect will be a(n) _____ in profit of _____.
A)
decrease; $100
B)
increase; $100
C)
increase; $300
D)
decrease; $300
33.
(Ref 30-1 Table: Demand Schedule of Gadgets) Use Table 30-1: Demand Schedule of
Gadgets. The market for gadgets consists of two producers, Margaret and Ray. Each
firm can produce gadgets at a marginal cost of $2 and no fixed cost. Suppose that these
two producers have formed a cartel, agreed to split production of output evenly, and are
maximizing total industry profits. If Margaret decides to cheat on the agreement and sell
100 more gadgets, Margaret’s price effect will be a(n) _____ in profit of _____.
A)
decrease; $400
B)
increase; $400
C)
increase; $200
D)
decrease; $200
Page 10
34.
(Ref 30-1 Table: Demand Schedule of Gadgets) Use Table 30-1: Demand Schedule of
Gadgets. The market for gadgets consists of two producers, Margaret and Ray. Each
firm can produce gadgets at a marginal cost of $2 and no fixed cost. Suppose that these
two producers have formed a cartel, agreed to split production of output evenly, and are
maximizing total industry profits. If Margaret decides to cheat on the agreement and sell
100 more gadgets but Ray continues to sell 200 gadgets, Ray’s profits will be:
A)
$1,400.
B)
$1,250.
C)
$600.
D)
$400.
35.
(Ref 30-1 Table: Demand Schedule of Gadgets) Use Table 30-1: Demand Schedule of
Gadgets. The market for gadgets consists of two producers, Margaret and Ray. Each
firm can produce gadgets at a marginal cost of $2 and no fixed cost. If industry output is
300 gadgets produced by Margaret and 200 gadgets produced by Ray and if Ray decides
to increase output by an additional 100 gadgets, industry output will be:
A)
700.
B)
600.
C)
500.
D)
400.
36.
(Ref 30-1 Table: Demand Schedule of Gadgets) Use Table 30-1: Demand Schedule of
Gadgets. The market for gadgets consists of two producers, Margaret and Ray. Each
firm can produce gadgets at a marginal cost of $2 and no fixed cost. If industry output is
300 gadgets produced by Margaret and 200 gadgets produced by Ray and if Ray decides
to increase output by an additional 100 gadgets, industry price will be:
A)
$4.
B)
$3.
C)
$2.
D)
$1.
37.
(Ref 30-1 Table: Demand Schedule of Gadgets) Use Table 30-1: Demand Schedule of
Gadgets. The market for gadgets consists of two producers, Margaret and Ray. Each
firm can produce gadgets at a marginal cost of $2 and no fixed cost. If industry output is
300 gadgets produced by Margaret and 200 gadgets produced by Ray and if Ray decides
to increase output by an additional 100 gadgets, Margaret’s profit will be _____, and
Ray’s profit will be _____.
A)
$1,750; $1,250
B)
$1,250; $1,250
C)
$1,400; $1,000
D)
$600; $600
Page 11
38.
(Ref 30-1 Table: Demand Schedule of Gadgets) Use Table 30-1: Demand Schedule of
Gadgets. The market for gadgets consists of two producers, Margaret and Ray. Each
firm can produce gadgets at a marginal cost of $2 and no fixed cost. If the industry were
actually perfectly competitive, the output would be _____ gadgets, and the price would
be _____.
A)
0; $10
B)
500; $5
C)
600; $4
D)
800; $2
Use the following to answer questions 39-49:
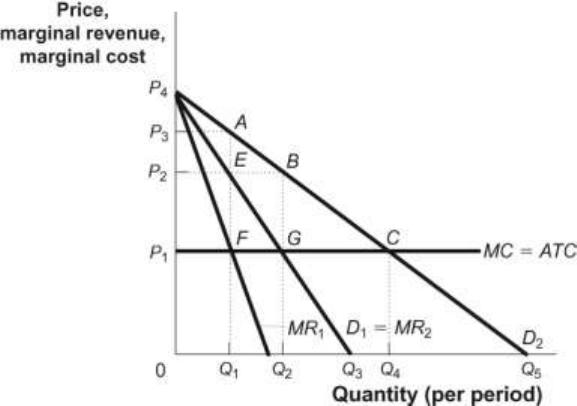
Figure: Monopoly Profits in Duopoly
39.
(Ref 30-2 Figure: Monopoly Profits in Duopoly) Use Figure 30-2: Monopoly Profits in
Duopoly. If there were two firms in this industry, they could engage in _____ and reap
monopoly profits.
A)
game theory
B)
the prisoners’ dilemma
C)
collusive behavior
D)
measuring the four-firm concentration ratio
Page 12
40.
(Ref 30-2 Figure: Monopoly Profits in Duopoly) Use Figure 30-2: Monopoly Profits in
Duopoly. Suppose there are two firms in this industry. Each firm faces an identical
demand curve, D1, and the market demand curve is D2. The figure illustrates how firms
can reap monopoly profits, even in an industry with:
A)
free entry and exit.
B)
two firms.
C)
monopolistic competition.
D)
a four-firm concentration ratio of 50.
41.
(Ref 30-2 Figure: Monopoly Profits in Duopoly) Use Figure 30-2: Monopoly Profits in
Duopoly. The figure shows how an industry consisting of two firms that face identical
demand curves (D1) can collude to increase profits. Which assumption is not a part of
the analysis illustrated by the model?
A)
The two firms are identical.
B)
The two firms sell identical products.
C)
While the firms face the same MC curves, their respective TC curves have unequal
slopes.
D)
Each firm has a horizontal marginal cost curve.
42.
(Ref 30-2 Figure: Monopoly Profits in Duopoly) Use Figure 30-2: Monopoly Profits in
Duopoly. The figure shows how an industry consisting of two firms that face identical
demand curves (D1) can collude to increase profits. The market demand curve is D2.
Which assumption is part of the analysis illustrated by the model?
A)
The two firms have identical marginal cost but different average total cost.
B)
The two firms sell differentiated products.
C)
The MR curve is not relevant to either firm’s choices.
D)
The firms can act as a cartel and maximize their combined economic profit.
43.
(Ref 30-2 Figure: Monopoly Profits in Duopoly) Use Figure 30-2: Monopoly Profits in
Duopoly. The figure shows how an industry consisting of two firms that face identical
demand curves (D1) can collude to increase profits. The market demand curve is D2. If
the firms collude to share the market demand equally, then each firm will act as if its
demand curve is given by:
A)
D1.
B)
D2.
C)
MR1.
D)
2 *D1.
Page 13
44.
(Ref 30-2 Figure: Monopoly Profits in Duopoly) Use Figure 30-2: Monopoly Profits in
Duopoly. The figure shows how an industry consisting of two firms that face identical
demand curves (D1) can collude to increase profits. If the firms collude to share the
market demand equally, then each firm will act as if its marginal revenue curve is given
by:
A)
MR1.
B)
2 * MR1.
C)
MR2.
D)
MC.
45.
(Ref 30-2 Figure: Monopoly Profits in Duopoly) Use Figure 30-2: Monopoly Profits in
Duopoly. The figure shows how an industry consisting of two firms that face identical
demand curves (D1) can collude to increase profits. If the firms collude to share the
market demand equally, then each firm will act as if its demand curve is given by
_____, while the market demand curve is given by _____.
A)
D1; MR2
B)
D2; D1
C)
D1; D2
D)
MR1; MR2
46.
(Ref 30-2 Figure: Monopoly Profits in Duopoly) Use Figure 30-2: Monopoly Profits in
Duopoly. Given the duopoly industry illustrated in the figure, if each firm acted on the
belief that it faced demand curve D2 and acted without consideration of the other, each
firm would attempt to maximize economic profits by producing quantity _____ and
setting price equal to _____.
A)
Q4; P1
B)
Q4; P2
C)
Q1; P4
D)
Q2; P2
47.
(Ref 30-2 Figure: Monopoly Profits in Duopoly) Use Figure 30-2: Monopoly Profits in
Duopoly. Firms in the duopoly industry illustrated in the figure have zero fixed costs.
The market demand curve is D2. If the two firms colluded to maximize their combined
economic profits, they would set the market price at _____, and combined economic
profits of the firms would be _____.
A)
P1; given by the area of the rectangle 0P1CQ4
B)
P1; zero
C)
P3; given by the area of the rectangle 0P3AQ1
D)
P2; given by the area of the rectangle P1P2BG
Page 14
48.
(Ref 30-2 Figure: Monopoly Profits in Duopoly) Use Figure 30-2: Monopoly Profits in
Duopoly. The efficient solution in the figure is found where price is _____ and quantity
is _____.
A)
P1; Q4
B)
P2; Q2
C)
P2; Q1
D)
P3; Q1
49.
(Ref 30-2 Figure: Monopoly Profits in Duopoly) Use Figure 30-2: Monopoly Profits in
Duopoly. If the two firms in the figure colluded to split production evenly and to
maximize their joint profits, the market price they set would be _____, and each firm’s
economic profit would be _____. (Assume that the market demand curve is D2.)
A)
P2; given by the area of the rectangle bounded by P1P2EF = FEBG
B)
P1; P1P3AF
C)
P3; given by the area of the rectangle bounded by 0P3AQ1
D)
P2; given by the area of the rectangle bounded by P1P2BG
Use the following to answer questions 50-51:
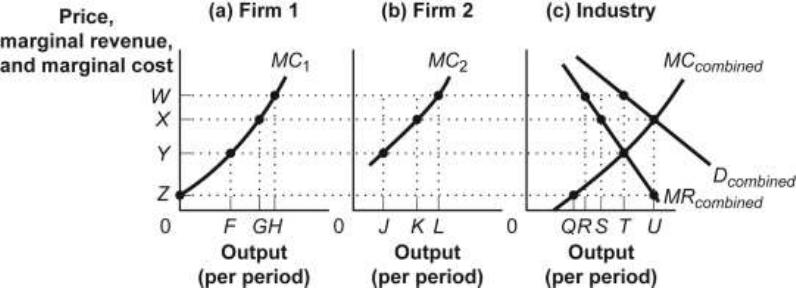
Figure: Collusion
50.
(Ref 30-3 Figure: Collusion) Use Figure 30-3: Collusion. The quantity of output
produced by the industry with collusion is shown by:
A)
Q.
B)
R.
C)
S.
D)
T.
Page 15
51.
(Ref 30-3 Figure: Collusion) Use Figure 30-3: Collusion. The price charged by the
industry with collusion is shown by:
A)
W.
B)
X.
C)
Y.
D)
Z.
Use the following to answer questions 52-61:
52.
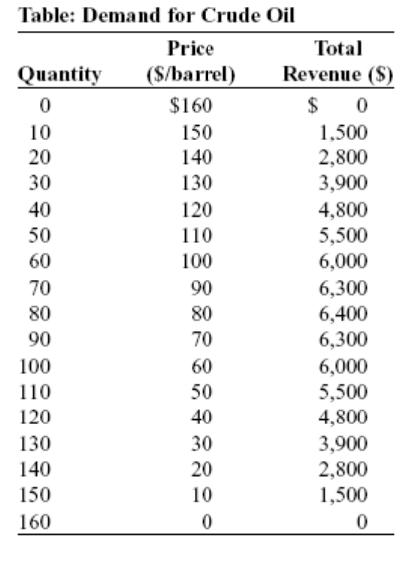
(Ref 30-4 Table: Demand for Crude Oil) Use Table 30-4: Demand for Crude Oil.
Assume that the crude oil industry is a duopoly and the marginal cost of producing
crude oil is zero. If the two firms collude to share the market equally, the price of crude
oil will be _____, firm 1 will produce _____ barrels, firm 2 will produce _____ barrels,
and each firm will earn revenue equal to _____.
A)
$80; 80; 80; $6,400
B)
$80; 40; 40; $3,200
C)
$60; 50; 50; $3,000
D)
$40; 60; 60; $2,400
Page 16
53.
(Ref 30-4 Table: Demand for Crude Oil) Use Table 30-4: Demand for Crude Oil. The
marginal cost of producing crude oil is zero. If the crude oil industry is a monopoly, the
price of crude oil will be _____, the total quantity of crude oil produced by the
monopoly will be _____ barrels, and the monopoly will earn revenue equal to _____.
A)
$80; 80; $6,400
B)
$80; 80; $0
C)
$160; 0; $0
D)
$60; 100; $6,000
54.
(Ref 30-4 Table: Demand for Crude Oil) Use Table 30-4: Demand for Crude Oil.
Assume that the crude oil industry is a duopoly and the marginal cost of producing
crude oil is zero. Suppose that the two firms are maximizing industry profit and splitting
the profit evenly. If firm 1 decides to cheat and increase production by 10 more barrels,
total industry output will be _____ barrels.
A)
160
B)
100
C)
90
D)
80
55.
(Ref 30-4 Table: Demand for Crude Oil) Use Table 30-4: Demand for Crude Oil.
Assume that the crude oil industry is a duopoly and the marginal cost of producing
crude oil is zero. Suppose that the two firms are maximizing industry profit and splitting
the profit evenly. If firm 1 decides to cheat and increase production by 10 more barrels,
the price of crude oil will be:
A)
$0.
B)
$70.
C)
$80.
D)
$160.
56.
(Ref 30-4 Table: Demand for Crude Oil) Use Table 30-4: Demand for Crude Oil.
Assume that the crude oil industry is a duopoly and the marginal and fixed cost of
producing crude oil equals zero. Suppose that the two firms are maximizing industry
profit and splitting the profit evenly. If firm 1 decides to cheat and increase production
by 10 more barrels, it will earn profits of:
A)
$6,400.
B)
$6,300.
C)
$3,500.
D)
$2,800.
Page 17
57.
(Ref 30-4 Table: Demand for Crude Oil) Use Table 30-4: Demand for Crude Oil.
Assume that the crude oil industry is a duopoly and the marginal cost and fixed cost of
producing crude oil equals zero. Suppose that the two firms are maximizing industry
profit and splitting the profit evenly. If firm 1 decides to cheat and increase production
by 10 more barrels and firm 2 continues to produce 40 barrels, firm 2 will earn profits
of:
A)
$6,400.
B)
$6,300.
C)
$3,500.
D)
$2,800.
58.
(Ref 30-4 Table: Demand for Crude Oil) Use Table 30-4: Demand for Crude Oil.
Assume that the crude oil industry is a duopoly and the marginal cost and fixed cost of
producing crude oil equal zero. Suppose that the two firms are maximizing industry
profit and splitting the profit evenly. If both firms decide to cheat and produce 10 more
barrels each, industry output will be _____ barrels.
A)
100
B)
120
C)
110
D)
160
59.
(Ref 30-4 Table: Demand for Crude Oil) Use Table 30-4: Demand for Crude Oil.
Assume that the crude oil industry is a duopoly and the marginal cost and fixed cost of
producing crude oil equal zero. Suppose that the two firms are maximizing industry
profit and splitting the profit evenly. If both firms decide to cheat and produce 10 more
barrels each, the price of crude oil will be:
A)
$160.
B)
$80.
C)
$70.
D)
$60.
60.
(Ref 30-4 Table: Demand for Crude Oil) Use Table 30-4: Demand for Crude Oil.
Assume that the crude oil industry is a duopoly and the marginal and fixed cost of
producing crude oil equals zero. Suppose that the two firms are maximizing industry
profit and splitting the profit evenly. If both firms decide to cheat and produce 10 more
barrels each, firm 1’s profit will be _____, and firm 2’s profit will be _____.
A)
$3,200; $3,200
B)
$3,200; $3,000
C)
$3,000; $3,200
D)
$3,000; $3,000
Page 18
61.
(Ref 30-4 Table: Demand for Crude Oil) Use Table 30-4: Demand for Crude Oil.
Assume that the crude oil industry is a duopoly and the marginal and fixed costs of
producing crude oil equal zero. Suppose that the two firms are maximizing industry
profit and splitting the profit evenly. If both firms engage in noncooperative behavior,
the industry output will be _____ barrels, and the price of crude oil will be _____.
A)
0; $160
B)
80; $80
C)
100; $60
D)
160; $0
62.
Market power in the United States was often gained in the latter part of the nineteenth
century by:
A)
forming trusts.
B)
the growth of competition.
C)
international arrangements with Russian and Japanese firms.
D)
opening up more industries to international trade.
63.
Attempts by the federal government to prevent the exercise of monopoly power in the
United States are known as _____ policy.
A)
stabilization
B)
antitrust
C)
fiscal
D)
government
64.
Antitrust policy refers to government:
A)
attempts to prevent the acquisition of monopoly power.
B)
attempts to encourage the exercise of monopoly power.
C)
encouragement of collusion in the marketplace.
D)
attempts to limit private enterprise.
65.
The FIRST law designed to curb monopoly power in the United States was the _____
Act.
A)
Sherman Antitrust
B)
Clayton
C)
Federal Trade Commission
D)
Robinson-Patman
Page 19
66.
A major application of the Sherman Antitrust Act was in _____ against _____.
A)
1880; the Ford Motor Company
B)
1889; Bell
C)
1911; Standard Oil
D)
1889; Bell and Standard Oil
67.
The field of law that attempts to limit the ability of oligopolists to collude and restrict
competition is called:
A)
antitrust policy.
B)
product safety policy.
C)
fuel-efficiency standards.
D)
excise tax policy.
68.
One of the earliest actions of antitrust policy was the breakup of:
A)
the Standard Oil Company.
B)
Bell Telephone.
C)
Microsoft.
D)
IBM.
69.
Oligopoly first became an issue in the United States when:
A)
the Sons of Liberty dumped the East India Company’s tea into Boston Harbor in
1773.
B)
the Emancipation Proclamation was issued in 1863.
C)
the growth of railroads made possible a national market for goods in the second
half of the nineteenth century.
D)
Google purchased Motorola Mobility in 2011.
70.
A formal agreement to limit production and raise prices leads to:
A)
a cartel.
B)
perfect competition.
C)
monopolistic competition.
D)
oligopoly.
71.
Cartels became illegal in the United States in:
A)
1776.
B)
1890.
C)
1929.
D)
1982.
Page 20
72.
A trust:
A)
is a government agency that regulates natural monopolies.
B)
is the new organization that is formed when two firms merge.
C)
occurs when shareholders of the major companies in an industry turn over their
shares to a board of trustees who then control all of the companies.
D)
is another name for a large insurance company.
73.
The FIRST trust in the United States was established by _____ in the _____ industry.
A)
AT&T; communications
B)
Walt Disney; entertainment
C)
Amtrak; transportation
D)
Standard Oil; petroleum
74.
The purpose of the trusts established in the United States in the late 1800s was to:
A)
engage in monopoly pricing.
B)
promote international trade.
C)
promote competition in the transportation industry.
D)
limit the involvement of government in providing health care.
75.
The purpose of antitrust policy is to:
A)
limit pollution.
B)
provide access to affordable health care for uninsured Americans.
C)
prevent the exercise of monopoly power.
D)
control inflation and interest rates.
76.
The 1890 law intended to prevent the establishment of more monopolies and to break up
existing ones in the United States was the _____ Act.
A)
Taft-Hartley
B)
Sherman Antitrust
C)
Affordable Care
D)
Federal Trade Commission
77.
The government agency in the United States that reviews proposed mergers of firms in
the same industry and prohibits mergers that it believes will reduce competition is the:
A)
Commerce Department.
B)
Federal Reserve.
C)
Labor Department
D)
Department of Justice.
Page 21
78.
Which factor would make it difficult for oligopolists to collude?
A)
few firms
B)
few buyers
C)
similar costs of production
D)
a homogeneous product
79.
Which factor would make it difficult for Georgia peach suppliers to collude?
A)
only a few suppliers
B)
each supplier having the same costs
C)
buyers of peaches having very little bargaining power since peaches are
homogeneous
D)
only a few buyers of peaches
80.
The airline industry often engages in price wars. This means that firms often _____
prices until profits _____.
A)
raise; are maximized
B)
lower; are maximized
C)
lower; approach zero
D)
raise; approach zero
81.
Airlines are prone to price wars because:
A)
most fliers choose airlines on the basis of schedule and price.
B)
airline pricing is easy to understand.
C)
airlines have the same costs.
D)
airlines operate close to capacity.
82.
Tacit collusion is difficult if:
A)
there are many firms in the industry.
B)
the firms in the industry are producing differentiated products.
C)
firms have common interests.
D)
the oligopolists are selling to many small firms.
83.
Tacit collusion is relatively easy for oligopolists if:
A)
they are producing many different products.
B)
there are only a few firms in the industry.
C)
they are selling their product to only a few large buyers.
D)
barriers to entry into the industry are low.
Page 22
84.
As the number of firms in an oligopoly decreases:
A)
barriers to entry are likely to shrink.
B)
firms are less likely to engage in tacit collusion.
C)
firms are more likely to engage in tacit collusion.
D)
it becomes more difficult for the oligopoly to restrict output.
85.
If the several companies in the tobacco industry produce similar products but have very
different marginal costs:
A)
they are less likely to engage in tacit collusion than firms with similar costs.
B)
they are more likely to engage in tacit collusion than firms with similar costs.
C)
prices for tobacco products are more likely to be near the monopoly level than in
an industry whose firms have similar costs.
D)
output of tobacco products is more likely to be near the monopoly level than in an
industry whose firms have similar costs.
Use the following to answer questions 86-90:
86.
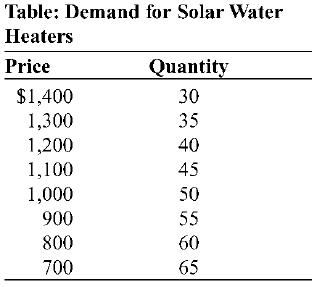
(Ref 30-5 Table: Demand for Solar Water Heaters) Use Table 30-5: Demand for Solar
Water Heaters. The marginal cost of producing solar water heaters is zero, and only two
firms, Rheem and Calefi, produce them. Suppose they agree to produce only 25 water
heaters each. By how much does Rheem’s profit rise if it cheats on the agreement and
produces 30 water heaters?
A)
$3,000
B)
$2,700
C)
$2,000
D)
$5,000
Page 23
87.
(Ref 30-5 Table: Demand for Solar Water Heaters) Use Table 30-5: Demand for Solar
Water Heaters. The marginal cost of producing solar water heaters is zero, and only two
firms, Rheem and Calefi, produce them. Suppose they agree to produce only 25 water
heaters each. If Rheem cheats on the agreement and produces 30 water heaters, what is
the price effect for Rheem?
A)
-$1,000
B)
-$2,500
C)
$2,000
D)
$1,000
88.
(Ref 30-5 Table: Demand for Solar Water Heaters) Use Table 30-5: Demand for Solar
Water Heaters. The marginal cost of producing solar water heaters is zero, and only two
firms, Rheem and Calefi, produce them. Suppose they agree to produce only 25 water
heaters each. If Rheem cheats on the agreement and produces 30 water heaters, what is
the quantity effect for Rheem?
A)
$1,000
B)
$4,500
C)
$2,000
D)
$9,000
89.
(Ref 30-5 Table: Demand for Solar Water Heaters) Use Table 30-5: Demand for Solar
Water Heaters. The marginal cost of producing solar water heaters is zero, and only two
firms, Rheem and Calefi, produce them. If Rheem and Calefi get into a price war, the
equilibrium price in the market will be:
A)
$0.
B)
$700.
C)
$800.
D)
$1,000.
90.
(Ref 30-5 Table: Demand for Solar Water Heaters) Use Table 30-5: Demand for Solar
Water Heaters. The marginal cost of producing solar water heaters is zero, and only two
firms, Rheem and Calefi, produce them. If they agree to collude, what price will the
cartel charge and how many water heaters will the cartel sell?
A)
$1,000; 50
B)
$1,100; 45
C)
$900; 55
D)
$800; 60
91.
Cartels are illegal in the United States.
A)
True
B)
False
Page 24
92.
One of the most inefficient ways for duopolists to earn a profit is to engage in collusion
or form a cartel.
A)
True
B)
False
93.
The fact that the price effect for an oligopolist is less than the price effect for a
monopolist helps explain why firms are likely to cheat on a cartel agreement.
A)
True
B)
False
94.
Suppose all of the firms in an industry form a cartel and succeed in raising the price to
the monopoly level by reducing output. Any single firm will find that it can increase its
profits by cheating on the cartel agreement.
A)
True
B)
False
95.
Oligopolists will earn zero profits unless they can collude.
A)
True
B)
False
96.
Each firm in a cartel has an incentive to break its word and produce more than the
agreed quantity.
A)
True
B)
False
97.
Until 1890, trusts in which firms in an industry agreed to limit production and raise
prices were legal in the United States.
A)
True
B)
False
98.
Antitrust legislation was first passed in the United States in 1776.
A)
True
B)
False
Page 25
99.
Oligopoly first became an issue in the United States in the second half of the nineteenth
century, when the growth of railroads allowed for a national market for goods.
A)
True
B)
False
100.
Cartels were legal in the United States until 1890.
A)
True
B)
False
101.
The purpose of the nineteenth-century cartels was to increase production and encourage
price competition.
A)
True
B)
False
102.
A trust is a government agency that enforces laws limiting the power of oligopolies.
A)
True
B)
False
103.
A trust is the organization that is formed when two large companies merge.
A)
True
B)
False
104.
A trust is formed when shareholders of the major companies in an industry place their
shares in the hands of a board of trustees who control the companies and act as a single
firm that can engage in monopoly pricing.
A)
True
B)
False
105.
The first trust in the United States was established in 1881 by lawyers at John D.
Rockefeller’s Standard Oil Company.
A)
True
B)
False
106.
The purpose of the trusts established in the United States in the late 1800s was to
decrease government spending and the size of the federal budget deficit.
A)
True
B)
False
Page 26
107.
The purpose of antitrust policy is to prevent the exercise of monopoly power.
A)
True
B)
False
108.
The law enacted in 1890 to break up existing monopolies and prevent the formation of
new ones was the Glass-Steagall Act.
A)
True
B)
False
109.
The law enacted in 1890 to break up existing monopolies and prevent the formation of
new ones was the Sherman Antitrust Act.
A)
True
B)
False
110.
The government agency in the United States that reviews proposed mergers of firms in
the same industry and prohibits mergers that it believes will reduce competition is the
Office of Management and Budget.
A)
True
B)
False
111.
The government agency in the United States that reviews proposed mergers of firms in
the same industry and prohibits mergers that it believes will reduce competition is the
Department of Justice.
A)
True
B)
False
112.
Until recently, most advanced countries except the United States did not have policies
against price fixing.
A)
True
B)
False
113.
The breakup of Microsoft in 2005 was one of the first applications of antitrust policy in
the United States.
A)
True
B)
False
Page 27
114.
The breakup of Standard Oil in 1911 was one of the first applications of antitrust policy
in the United States.
A)
True
B)
False
115.
For approximately the past 20 years, the European Union has enforced antitrust policies
for its member countries.
A)
True
B)
False
116.
The purpose of the Sherman Antitrust Act was to encourage the establishment of
monopolies to replace trusts.
A)
True
B)
False
117.
Suppose that Walmart buys fresh roses from several hundred small backyard gardeners
in California. These gardeners are very likely to be able to engage successfully in tacit
collusion.
A)
True
B)
False
118.
Tacit collusion is most likely to occur if there are only a few firms in the industry.
A)
True
B)
False
119.
Tacit collusion is relatively less likely to occur in an industry with 3 firms than it is in an
industry with 10 firms.
A)
True
B)
False
120.
If there are many firms in an industry, there is little incentive for firms to engage in tacit
collusion because a smaller proportion of the units of the product sold are affected by
the price effect if a firm increases output.
A)
True
B)
False
Page 28
121.
Oligopoly firms that produce only cement are less likely to collude than firms in a cell
phone oligopoly.
A)
True
B)
False
122.
Tacit collusion is likely to occur when firms have different market shares.
A)
True
B)
False
123.
Suppose an oligopoly is composed of four firms. One firm has a 50% market share;
another firm, 35%; another, 10%; and the fourth, 5%. It will be easier for this industry to
engage in tacit collusion than it would for an oligopoly each of whose four firms has
25% of the market.
A)
True
B)
False
124.
Until recently, most other advanced countries did not have policies that prohibited price
fixing.
A)
True
B)
False
125.
A price war occurs when tacit collusion breaks down and aggressive price competition
causes prices to collapse.
A)
True
B)
False
126.
In a price war, firms in an oligopoly often push prices up to the monopoly level.
A)
True
B)
False
Page 29
Use the following to answer question 127:
127.
(Ref 30-6 Table: Demand Schedule of Gadgets) Use Table 30-1: The Market for
Gadgets. Two producers, Margaret and Ray, dominate the market. Each firm can
produce gadgets at marginal costs of zero and without fixed costs.
A) If these firms form a cartel to maximize joint profits, what output level will be
produced and at what price? If the output is shared evenly, how much profit will each
firm earn?
B) Suppose that Margaret decides to increase production by 100 gadgets and Ray
leaves output constant. What will be the new market price and output? How much profit
will each firm earn?
128.
Why do the United States and many other countries have antitrust laws? What’s so
harmful about oligopoly that it warrants an entire body of law?
129.
Maximization of joint profits is MOST likely when firms are:
A)
perfect competitors.
B)
monopolistic competitors.
C)
duopolists who collude.
D)
natural monopolists.
130.
Cartels made up of a large number of firms are unstable because each firm in the cartel:
A)
has an incentive to cheat.
B)
is producing a relatively homogeneous product in which entry barriers are low.
C)
does not have to worry about losses.
D)
recognizes that the market size is relatively stable.
Page 30
131.
Both monopolists and cartel members will find that a drop-in price leads to:
A)
a quantity effect that reduces total revenue.
B)
a price effect that reduces total revenue.
C)
a quantity effect that has no effect on total revenue.
D)
neither a price nor a quantity effect.
132.
Given the large amount of interdependence among them, cooperation with one’s
competitors is the most profitable strategy for:
A)
perfect competitors.
B)
monopolistic competitors.
C)
oligopolists.
D)
monopolists.
133.
(Scenario: Two Identical Firms) Use Scenario: Two Identical Firms. Suppose the two
firms decide to cooperate and collude, resulting in the same amount of production for
each firm. What is the profit-maximizing price and output for the industry?
Scenario: Two Identical Firms
Two identical firms make up an industry in which the market demand curve is
represented by Q = 5,000 – 4P, where Q is the quantity demanded and P is price per
unit. The marginal cost of producing the good in this industry is constant and equal to
$650. Fixed cost is zero.
A)
P = $400, Q = 5,000
B)
P = $950, Q = 1,200
C)
P = $600, Q = 1,500
D)
P = $300, Q = 2,000
134.
The Sherman Antitrust Act:
A)
was aimed at preventing the establishment of more monopolies and was the
beginning of antitrust policy.
B)
introduced the HHI measure to industries.
C)
initially allowed firms to collude legally.
D)
allowed the establishment of trusts.
135.
A customer with significant buying power in an industry would:
A)
make a tacit price agreement more difficult to achieve.
B)
make a tacit price agreement easier to achieve.
C)
have no effect on tacit pricing agreement negotiations.
D)
result in a kinked demand curve.
Page 31
Page 33
Page 34