Chapter 3: MARGINAL ANALYSIS FOR OPTIMAL DECISION MAKING
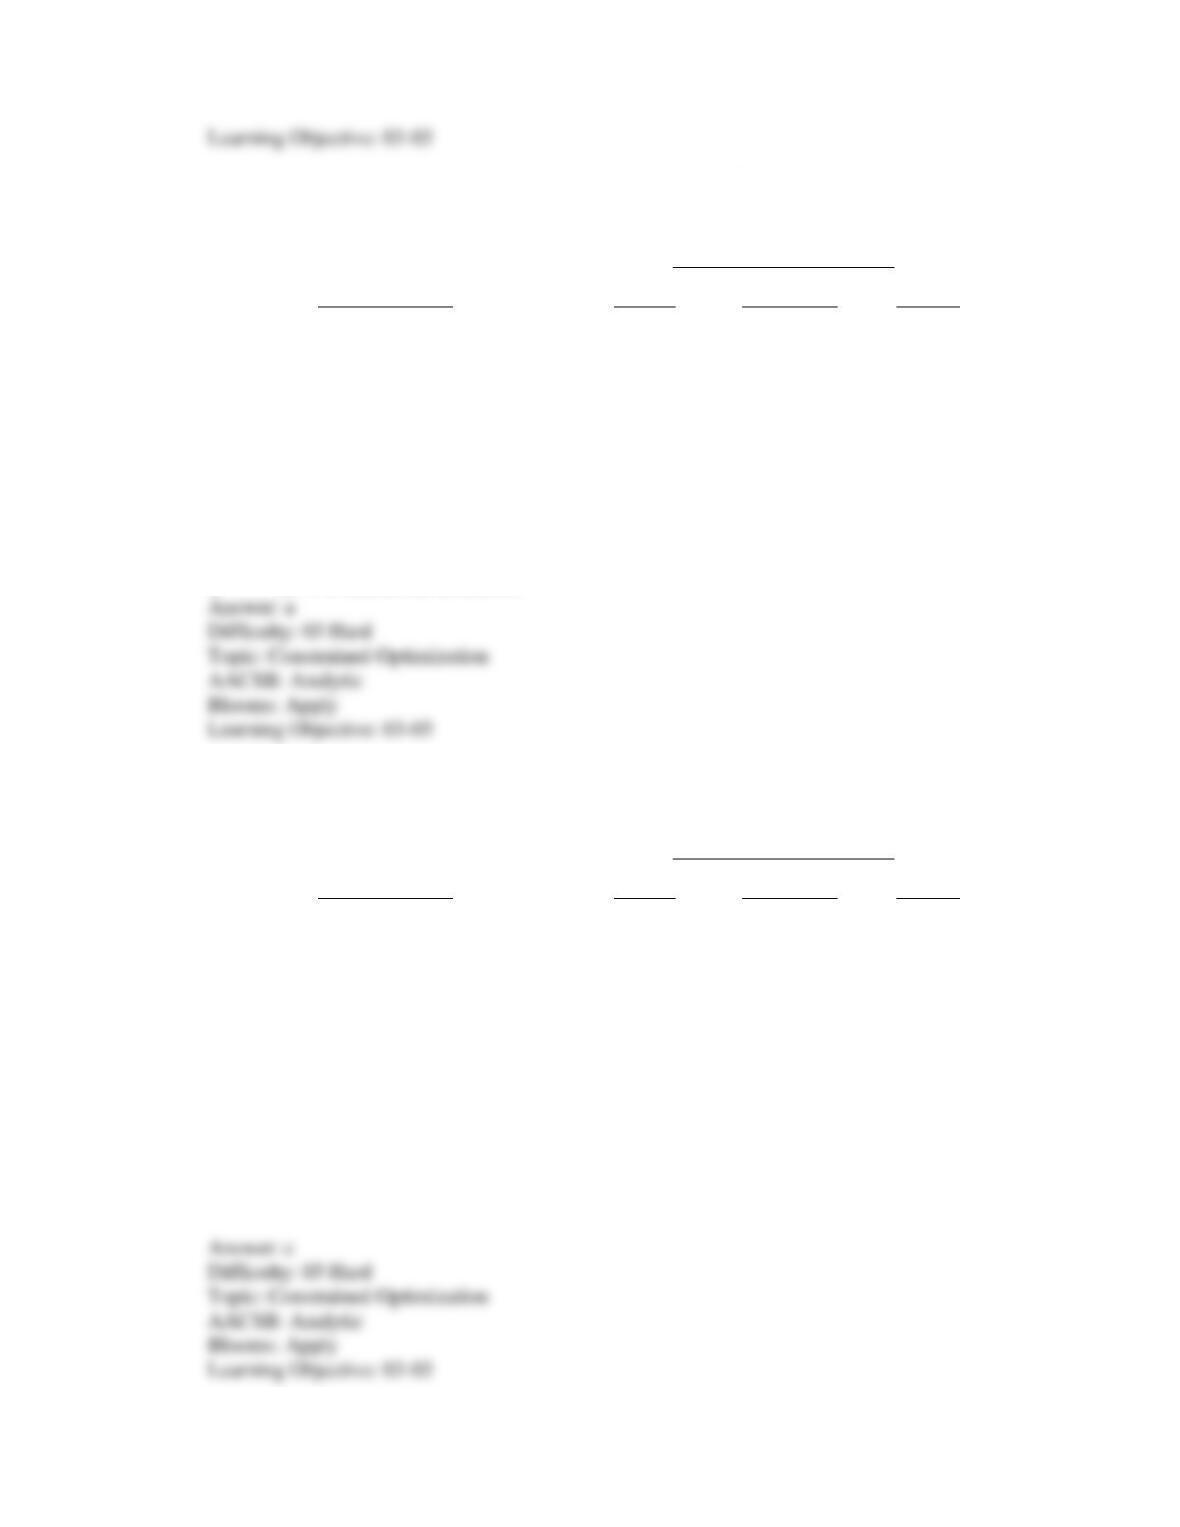
3-73 A grocery store hires cashiers and baggers. Cashiers earn $8 an hour; baggers earn $4 an hour.
The manager, who wants to maximize the number of customers served given a fixed payroll,
expects the following productivity from cashiers and baggers:
Total number of customers served
Number of employees
Cashiers
Baggers
1
2
3
4
5
240
440
600
712
776
136
264
384
496
560
Given the above information, what is the maximum possible number of customers that can be
served with a payroll of $32?
a. 1208
b. 936
c. 864
d. 312
e. none of the above
3-74 If the marginal benefits of increasing study time are less than the marginal costs, then
a. study time should be decreased to zero.
b. study time should be decreased.
c. no conclusion about the relative merits of more or less study time is possible.
d. there is too little study time.
e. study time should be increased.
3-75 A restaurant hires cooks and waiters. Cooks earn $10 an hour; waiters earn $5 an hour. The
manager, who wants to maximize the number of meals served given a fixed payroll of $45 per
hour, expects the following from cooks and waiters:
Total number of meals served
Number of employees
Cooks
Waiters
1
2
200
380
120
230
Chapter 3: MARGINAL ANALYSIS FOR OPTIMAL DECISION MAKING
3
4
5
540
660
740
310
360
390
Given the above information, the manager should hire
a. 2 cooks and 4 waiters.
b. 2 cooks and 5 waiters.
c. 3 cooks and 2 waiters.
d. 3 cooks and 4 waiters.
e. none of the above
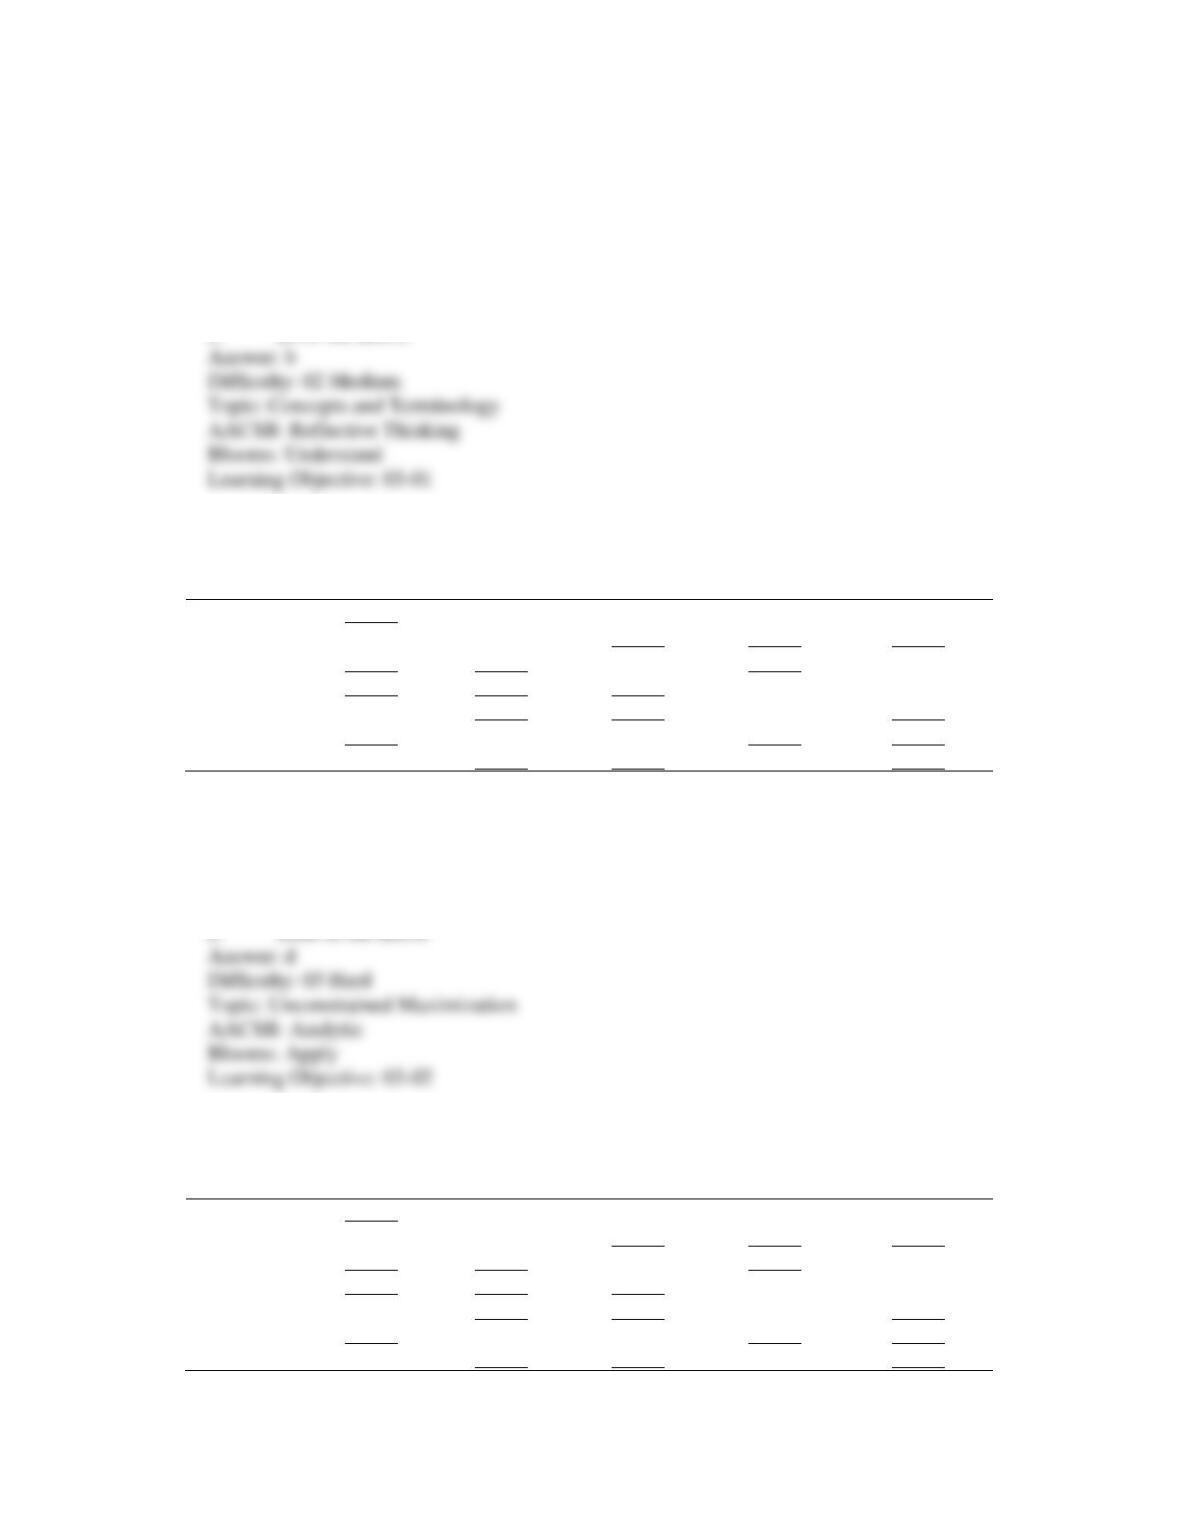
3-76 A restaurant hires cooks and waiters. Cooks earn $10 an hour; waiters earn $5 an hour. The
manager, who wants to maximize the number of meals served given a fixed payroll of $45 per
hour, expects the following from cooks and waiters:
Total number of meals served
Number of employees
Cooks
Waiters
1
2
3
4
5
200
380
540
660
740
120
230
310
360
390
Given the above information, and given the fixed payroll, the maximum number of meals that can
be served is
a. 240.
b. 670.
c. 850.
d. 1,130.
e. none of the above
Chapter 3: MARGINAL ANALYSIS FOR OPTIMAL DECISION MAKING
3-77 A restaurant hires cooks and waiters. Cooks earn $10 an hour; waiters earn $5 an hour. The
manager, who wants to maximize the number of meals served given a fixed payroll of $45 per
hour, expects the following from cooks and waiters:
Total number of meals served
Number of employees
Cooks
Waiters
1
2
3
4
5
200
380
540
660
740
120
230
310
360
390
Given the above information, at the optimal choice, the last dollar spent on hiring waiters yielded
a. 6 additional meals.
b. 16 additional meals.
c. 80 additional meals.
d. 60 additional meals.
e. none of the above
Chapter 3: MARGINAL ANALYSIS FOR OPTIMAL DECISION MAKING
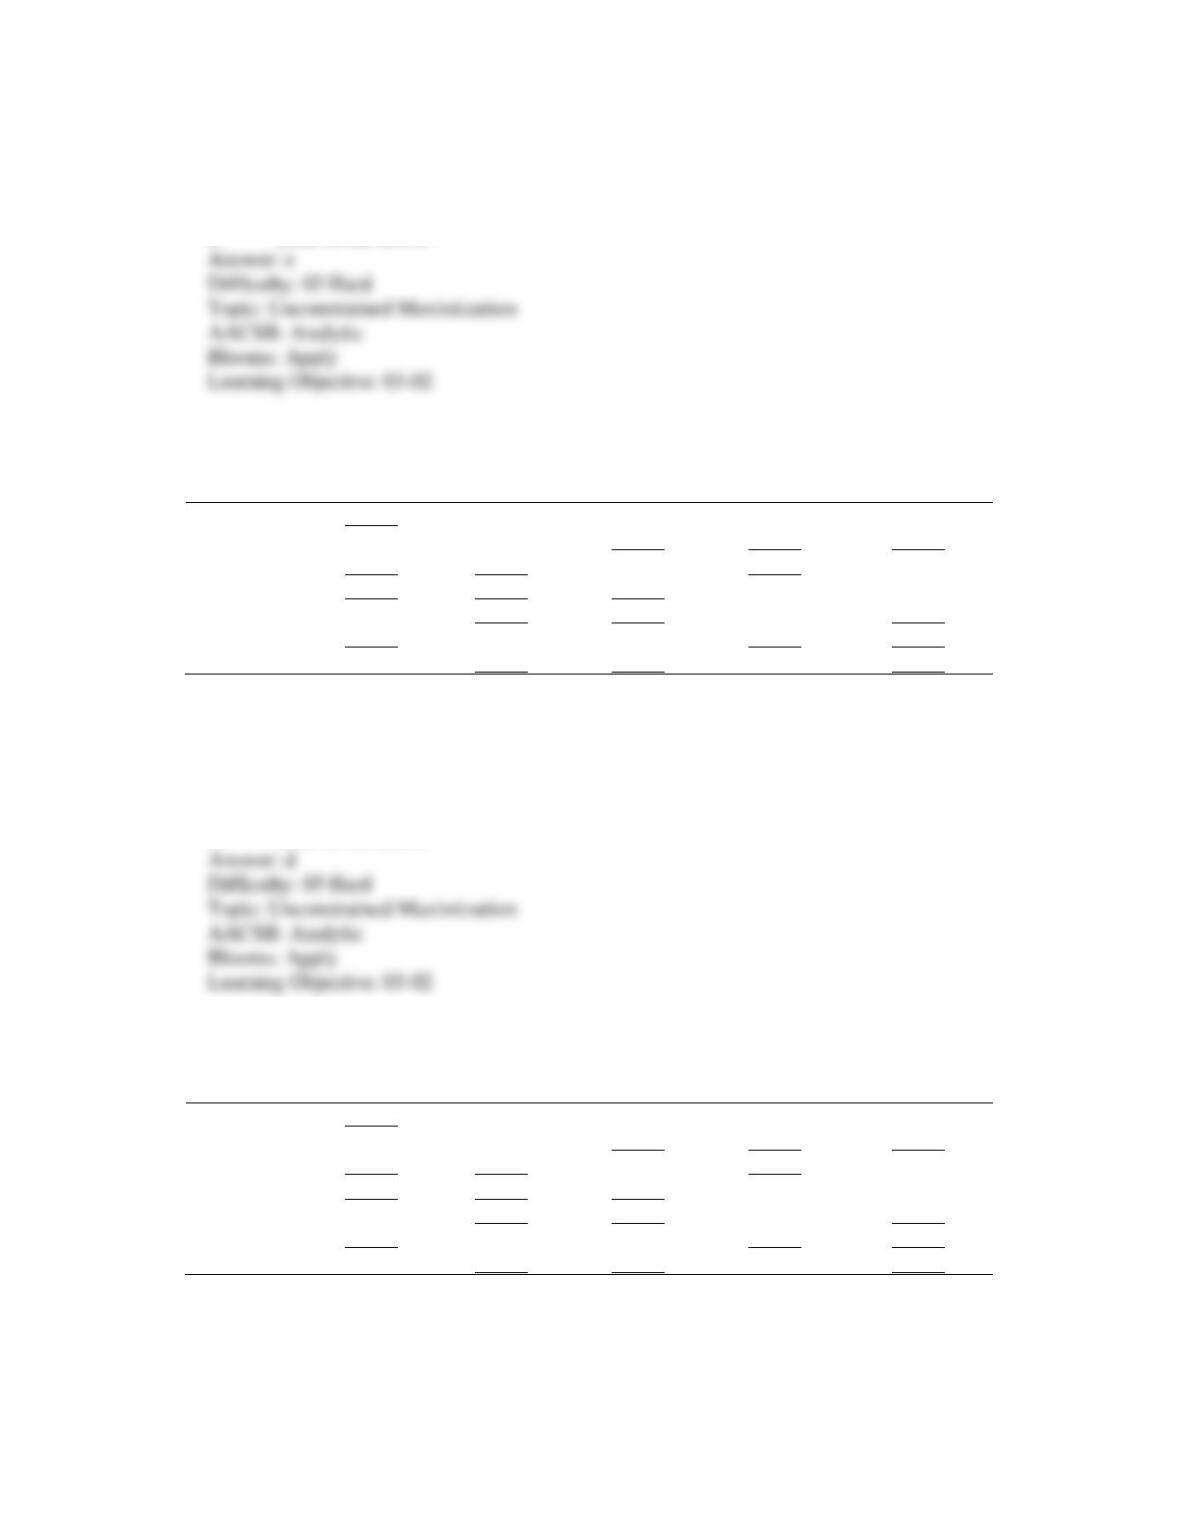
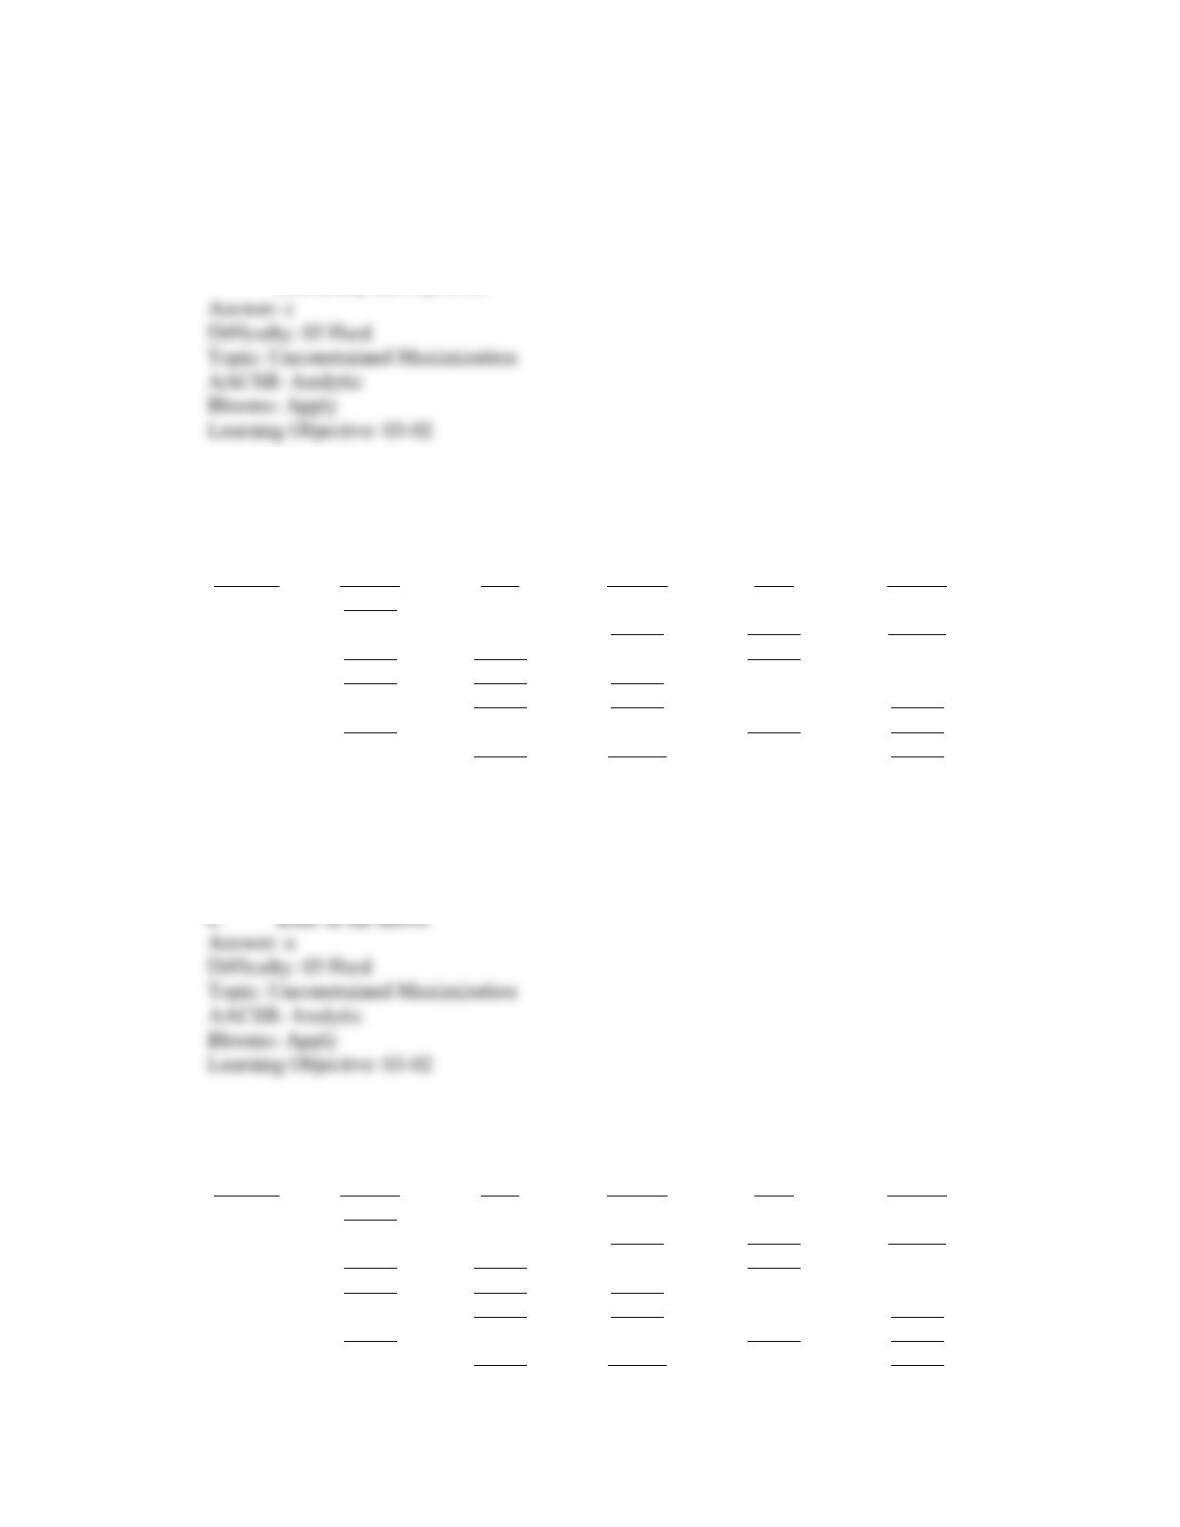
3-78 A metal refining plant emits sulfur dioxide into the air and has decided to install air scrubbers to
reduce the amount of pollution. Each scrubber costs $180,000 and the Environmental Protection
Agency (EPA) fines the plant $5,000 for every part of pollution emitted per million.
Number of air
scrubbers
Amount of pollution
(parts per million)
0
1
2
3
4
5
150
100
60
30
10
0
Based on the information above, the first air scrubber __________ (increases/decreases) the total
cost of pollution by $______.
a. increases, $180,000
b. increases, $530,000
c. decreases, $ 70,000
d. decreases, $250,000
e. none of the above
3-79 A metal refining plant emits sulfur dioxide into the air and has decided to install air scrubbers to
reduce the amount of pollution. Each scrubber costs $180,000 and the Environmental Protection
Agency (EPA) fines the plant $5,000 for every part of pollution emitted per million.
Number of air
scrubbers
Amount of pollution
(parts per million)
0
1
2
3
4
5
150
100
60
30
10
0
Chapter 3: MARGINAL ANALYSIS FOR OPTIMAL DECISION MAKING
Based on the information above, how many air scrubbers should the plant install in order to
minimize the total cost of pollution?
a. 1
b. 2
c. 3
d. 4
e. 5
3-80 A politician, who wants to receive the maximum number of votes, spends 9 hours a week
speaking to various groups. The table below shows his estimates of how time spent with each
group will affect the number of votes he receives:
Total Number of Votes from Speaking to:
Hours Per
Week
Loyal Party
Members (LMP)
Town
Meetings (TM)
Local Civic
Leaders (LCL)
1
2
3
4
5
6
400
750
1050
1300
1500
1600
200
380
530
640
700
740
300
560
760
920
1000
1060
Based on the information above, how should the politician allocate his speaking time?
a. 3 hours to LPM, 3 hours to TM, 3 hours to LCL
b. 4 hours to LPM, 2 hours to TM, 3 hours to LCL
c. 5 hours to LPM, 1 hours to TM, 3 hours to LCL
d. 5 hours to LPM, 2 hours to TM, 2 hours to LCL
3-81 A politician, who wants to receive the maximum number of votes, spends 9 hours a week
speaking to various groups. The table below shows his estimates of how time spent with each
group will affect the number of votes he receives:
Total Number of Votes from Speaking to:
Hours Per
Week
Loyal Party
Members (LMP)
Town
Meetings (TM)
Local Civic
Leaders (LCL)
1
2
3
4
5
6
400
750
1050
1300
1500
1600
200
380
530
640
700
740
300
560
760
920
1000
1060
Chapter 3: MARGINAL ANALYSIS FOR OPTIMAL DECISION MAKING
Based on the information above, how many EXTRA votes will the politician receive if he devotes
one more hour to speaking engagements (i.e., speaks 10 instead of 9 hours per week)?
a. 150
b. 180
c. 200
d. 380
e. none of the above
3-82 A package delivery service currently has 12 vans and 16 employees. Vans cost $400 per week
and employees earn $300 per week. The last van added 480 packages delivered to total output,
while the last employee added 450 packages. The firm
a. is making the correct decision because the dollar expenditure ($4800) is equal for vans
and employees.
b. should use more vans and fewer employees because the last van added 480 packages
while the last employee only added 450 packages.
c. should use fewer vans and more employees because the last dollar spent on vans yielded
1.2 additional packages delivered, while the last dollar spent on employees yielded 1.5
packages delivered.
d. could deliver more packages for the same budget by using fewer vans and more
employees.
e. both c and d
3-83 Your firm sells club soda in both grocery stores and convenience stores. You have a budget of
$550 for store displays, and must decide how to allocate this budget between grocery stores and
convenience stores to maximize the total number of sales. The following table shows the total
number of units that can be sold in grocery stores and convenience stores, according to the
number of displays in each type of store. Displays in grocery stores cost $150 each and displays
in convenience stores cost $100 each.
Number of
displays in
grocery stores
Total number of
units sold in
grocery stores
Number of
displays in
convenience
stores
Total number of
units sold in
convenience stores
1
2
3
4
5
6
500
900
1,250
1,550
1,750
1,850
1
2
3
4
5
6
400
780
1,130
1,460
1,760
1,960
Chapter 3: MARGINAL ANALYSIS FOR OPTIMAL DECISION MAKING
Given the above information, to maximize the total number of sales, you should choose
a. 3 grocery store displays and 2 convenience store displays.
b. 3 grocery store displays and 3 convenience store displays.
c. 3 grocery store displays and 4 convenience store displays.
d. 1 grocery store display and 4 convenience store displays.
3-84 Your firm sells club soda in both grocery stores and convenience stores. You have a budget of
$550 for store displays, and must decide how to allocate this budget between grocery stores and
convenience stores to maximize the total number of sales. The following table shows the total
number of units that can be sold in grocery stores and convenience stores, according to the
number of displays in each type of store. Displays in grocery stores cost $150 each and displays
in convenience stores cost $100 each.
Number of
displays in
grocery stores
Total number of
units sold in
grocery stores
Number of
displays in
convenience
stores
Total number of
units sold in
convenience stores
1
2
3
4
5
6
500
900
1,250
1,550
1,750
1,850
1
2
3
4
5
6
400
780
1,130
1,460
1,760
1,960
Given the above information, and given a budget of $550, the maximum possible number of sales
is
a. 730.
b. 1,960.
c. 2,030.
d. 2,500.
Chapter 3: MARGINAL ANALYSIS FOR OPTIMAL DECISION MAKING
3-85 Your firm sells club soda in both grocery stores and convenience stores. You have a budget of
$550 for store displays, and must decide how to allocate this budget between grocery stores and
convenience stores to maximize the total number of sales. The following table shows the total
number of units that can be sold in grocery stores and convenience stores, according to the
number of displays in each type of store. Displays in grocery stores cost $150 each and displays
in convenience stores cost $100 each.
Number of
displays in
grocery stores
Total number of
units sold in
grocery stores
Number of
displays in
convenience
stores
Total number of
units sold in
convenience stores
1
2
3
4
5
6
500
900
1,250
1,550
1,750
1,850
1
2
3
4
5
6
400
780
1,130
1,460
1,760
1,960
Given the above information, at the optimal choice with a budget of $550, the last dollar spent on
grocery store displays yields
a. 3.0 additional sales.
b. 3.3 additional sales.
c. 300 additional sales.
d. 500 additional sales.
3-86 A local charity has decided to solicit donations door-to-door. The table below shows estimated
donations for each hour a volunteer spends in the city, in the suburbs, and on campus.
Total Donations from:
Number of Hours
The city
The suburbs
Campus
1
2
3
4
5
6
$ 75
147
215
279
337
389
$ 65
127
185
239
289
333
$ 45
87
125
159
189
209
Given the above information, how should a volunteer allocate 10 hours in order to maximize the
amount of total donations?
a. 3 hours in the city, 4 hours in the suburbs, 3 hours on campus
b. 4 hours in the city, 3 hours in the suburbs, 3 hours on campus
c. 5 hours in the city, 4 hours in the suburbs, 1 hours on campus
d. 6 hours in the city, 4 hours in the suburbs, 0 hours on campus
Chapter 3: MARGINAL ANALYSIS FOR OPTIMAL DECISION MAKING
3-87 A local charity has decided to solicit donations door-to–door. The table below shows estimated
donations for each hour a volunteer spends in the city, in the suburbs, and on campus.
Total Donations from:
Number of Hours
The city
The suburbs
Campus
1
2
3
4
5
6
$ 75
147
215
279
337
389
$ 65
127
185
239
289
333
$ 45
87
125
159
189
209
Given the above information, and given an optimizing solution, the fourth hour solicited yielded
a. $ 64 in additional donations.
b. $ 68 in additional donations.
c. $239 in additional donations.
d. $279 in additional donations.
3-88 A local charity has decided to solicit donations door-to–door. The table below shows estimated
donations for each hour a volunteer spends in the city, in the suburbs, and on campus.
Total Donations from:
Number of Hours
The city
The suburbs
Campus
1
2
3
4
5
6
$ 75
147
215
279
337
389
$ 65
127
185
239
289
333
$ 45
87
125
159
189
209
Given the above information, with 10 hours of soliciting, the maximum possible amount of
donations is
a. $ 106.
b. $ 157.
c. $ 628.
d. $3,290.
Chapter 3: MARGINAL ANALYSIS FOR OPTIMAL DECISION MAKING
3-89 A computer services center has a problem with “malicious” computer usage. The center’s director
has decided to hire additional personnel to monitor computer usage. In order to minimize the total
cost of the malicious usage, the director should hire the number of monitors at which
a. the marginal revenue from the last monitor equals the marginal cost of the last monitor.
b. the decrease in the cost of malicious usage from the last monitor hired equals the cost of
hiring the last monitor.
c. the marginal benefit per dollar is equal across monitors.
d. both b and c
e. all of the above
3-90 Refer to the following table:
Level of
Activity
Total
Benefit
Total
Cost
Marginal
Benefit
Marginal
Cost
Net
Benefit
0
1
2
3
4
5
6
_____
100
_____
_____
605
_____
825
0
50
_____
_____
_____
674
_____
xx
_____
150
_____
_____
120
_____
xx
_____
_____
160
179
_____
190
0
_____
100
115
_____
_____
_____
What is marginal benefit for the 3rd unit of the activity?
a. 160
b. 180
c. 115
d. 175
e. none of the above
3-91 Refer to the following table:
Level of
Activity
Total
Benefit
Total
Cost
Marginal
Benefit
Marginal
Cost
Net
Benefit
0
1
2
3
4
5
6
_____
100
_____
_____
605
_____
825
0
50
_____
_____
_____
674
_____
xx
_____
150
_____
_____
120
_____
xx
_____
_____
160
179
_____
190
0
_____
100
115
_____
_____
_____
What is the marginal cost for the 5th unit of the activity?
Chapter 3: MARGINAL ANALYSIS FOR OPTIMAL DECISION MAKING
a. 180
b. 175
c. 189
d. 186
e. none of the above
3-92 Refer to the following table:
Level of
Activity
Total
Benefit
Total
Cost
Marginal
Benefit
Marginal
Cost
Net
Benefit
0
1
2
3
4
5
6
_____
100
_____
_____
605
_____
825
0
50
_____
_____
_____
674
_____
xx
_____
150
_____
_____
120
_____
xx
_____
_____
160
179
_____
190
0
_____
100
115
_____
_____
_____
What is the net benefit of the 6th unit of the activity?
a. −39
b. 0
c. 45
d. 50
e. none of the above
3-93 Refer to the following table:
Level of
Activity
Total
Benefit
Total
Cost
Marginal
Benefit
Marginal
Cost
Net
Benefit
0
1
2
3
4
5
6
_____
100
_____
_____
605
_____
825
0
50
_____
_____
_____
674
_____
xx
_____
150
_____
_____
120
_____
xx
_____
_____
160
179
_____
190
0
_____
100
115
_____
_____
_____
Chapter 3: MARGINAL ANALYSIS FOR OPTIMAL DECISION MAKING
The optimal level of activity is:
a. 2
b. 3
c. 4
d. 5
e. There is no optimal level in this case because marginal benefit does not equal marginal
cost at any activity level.
3-94 Refer to the following table:
Level of
Activity
Total
Benefit
Total
Cost
Marginal
Benefit
Marginal
Cost
Net
Benefit
0
1
2
3
4
5
6
_____
200
_____
_____
450
_____
500
0
30
_____
_____
_____
255
_____
xx
_____
100
_____
_____
30
_____
xx
_____
_____
50
65
_____
75
0
_____
230
270
_____
_____
_____
What is marginal benefit for the 4th unit of the activity?
a. 65
b. 60
c. 55
d. 50
3-95 Refer to the following table:
Level of
Activity
Total
Benefit
Total
Cost
Marginal
Benefit
Marginal
Cost
Net
Benefit
0
1
2
3
4
5
6
_____
200
_____
_____
450
_____
500
0
30
_____
_____
_____
255
_____
xx
_____
100
_____
_____
30
_____
xx
_____
_____
50
65
_____
75
0
_____
230
270
_____
_____
_____
What is the marginal cost of the 1st unit of the activity?
Chapter 3: MARGINAL ANALYSIS FOR OPTIMAL DECISION MAKING
a. 0
b. 5
c. 10
d. 15
e. none of the above
3-96 Refer to the following table:
Level of
Activity
Total
Benefit
Total
Cost
Marginal
Benefit
Marginal
Cost
Net
Benefit
0
1
2
3
4
5
6
_____
200
_____
_____
450
_____
500
0
30
_____
_____
_____
255
_____
xx
_____
100
_____
_____
30
_____
xx
_____
_____
50
65
_____
75
0
_____
230
270
_____
_____
_____
What is the net benefit of the 5th unit of the activity?
a. 50
b. 60
c. 70
d. 80
e. none of the above
3-97 Refer to the following table:
Level of
Activity
Total
Benefit
Total
Cost
Marginal
Benefit
Marginal
Cost
Net
Benefit
0
1
2
3
4
5
6
_____
200
_____
_____
450
_____
500
0
30
_____
_____
_____
255
_____
xx
_____
100
_____
_____
30
_____
xx
_____
_____
50
65
_____
75
0
_____
230
270
_____
_____
_____
The optimal level of activity is:
a. 2
b. 3
Chapter 3: MARGINAL ANALYSIS FOR OPTIMAL DECISION MAKING
c. 4
d. 5
e. There is no optimal level in this case because marginal benefit does not equal marginal