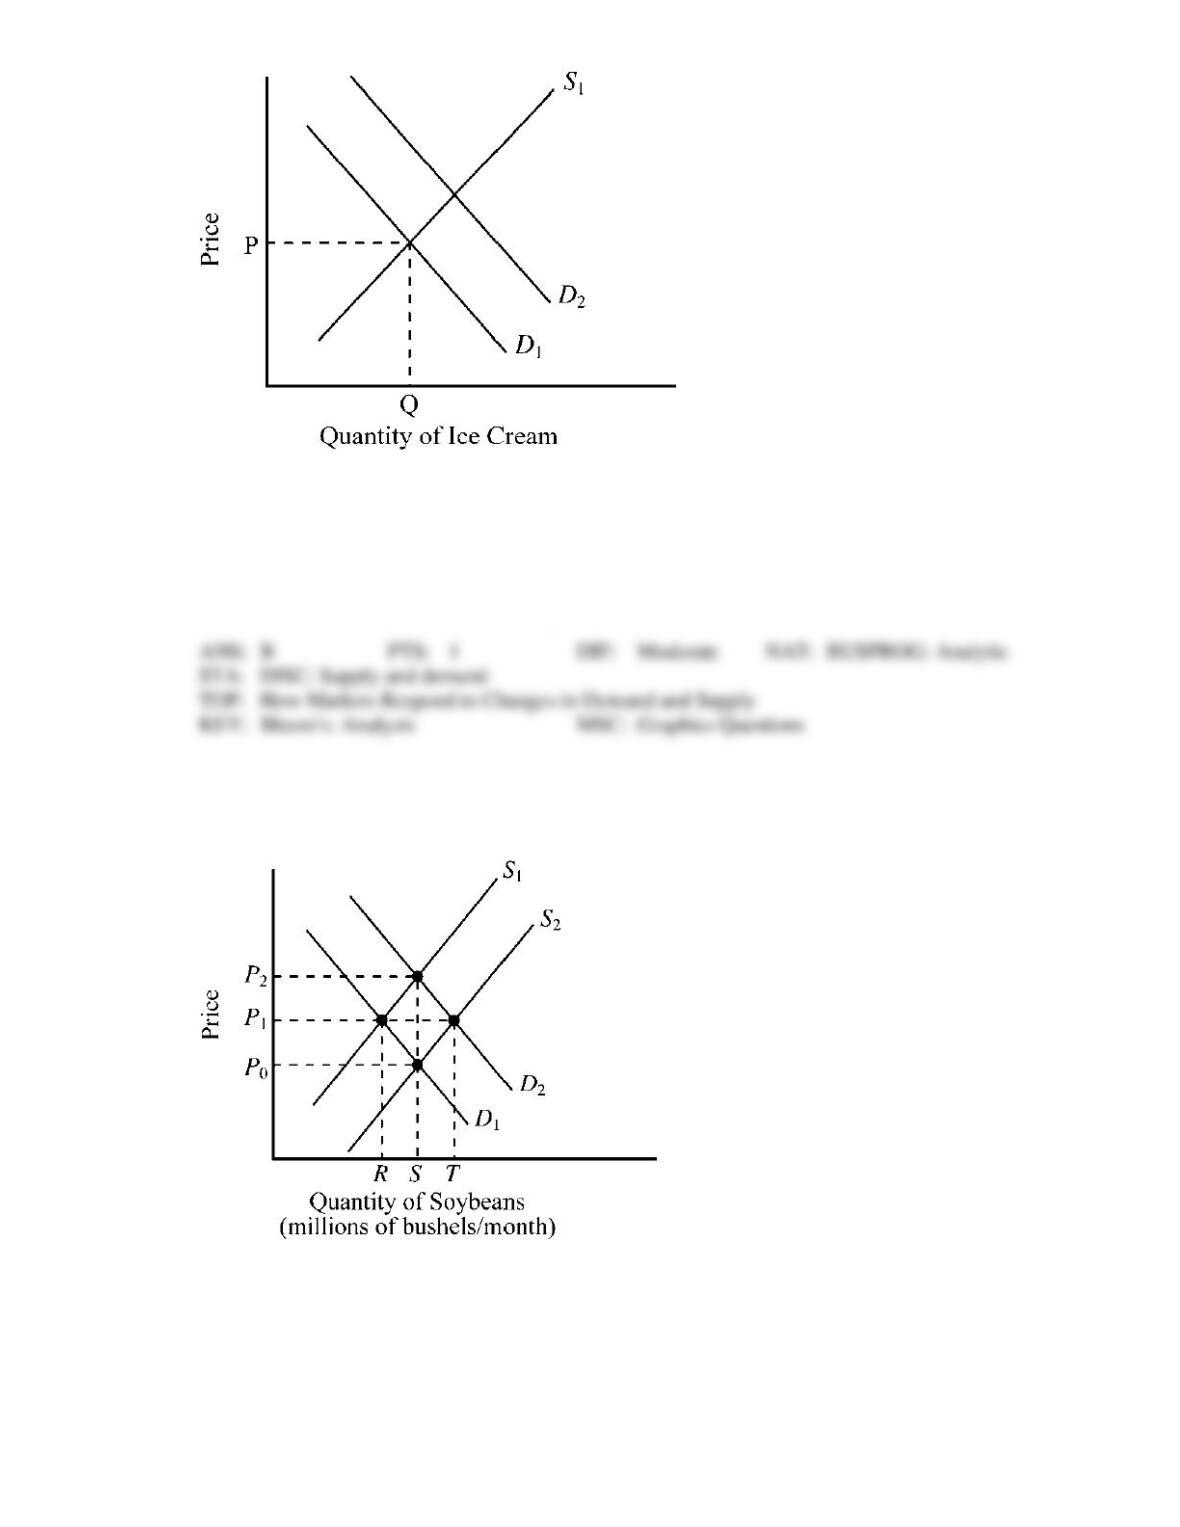
302. In Figure 3-7, suppose D1 and S1 indicate the initial conditions in the market for ice cream. Which of
the following changes would tend to cause the shift from D1 to D2 in the market for ice cream?
a.
a decrease in the price of sugar, an ingredient used to produce ice cream
b.
an increase in the price of frozen yogurt, a substitute for ice cream
c.
abnormally cold weather that decreased consumer desire for ice cream
d.
an increase in the price of milk, an ingredient used to produce ice cream
Use the figure below to answer the following question(s).
Figure 3-8
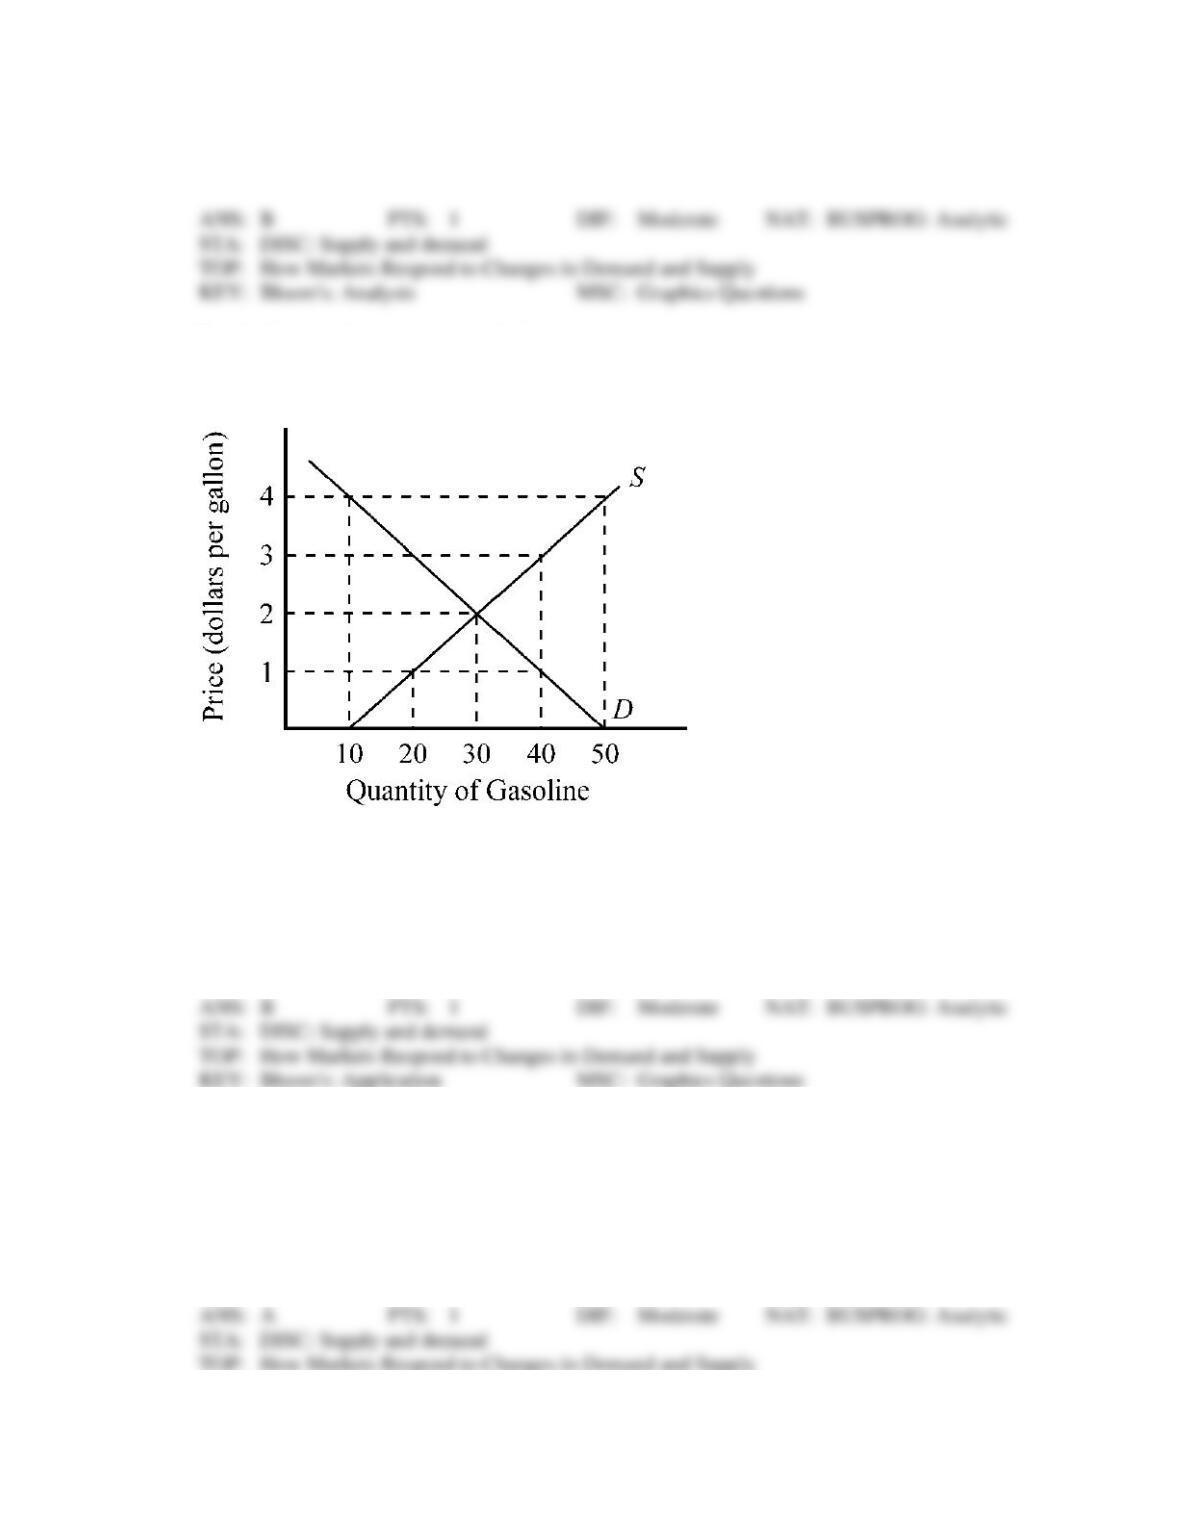
303. In Figure 3-8, if the initial demand and supply for soybeans were D1 and S1, how would a decrease in
the cost of producing soybeans affect the market for soybeans?
a.
Demand would increase to D2, price would increase to P2, and the quantity would increase
to S.
b.
Supply would increase to S2, price would decrease to P0, and the quantity would increase
to S.
c.
Both demand and supply would increase so the price would remain at P1, but the quantity
would increase to T.
d.
None of the above would occur.
Use the figure below to answer the following question(s).
Figure 3-9
304. In Figure 3-9, if D and S represent the demand and supply for gasoline, what is the equilibrium price
and quantity?
a.
price, $1; quantity, 20
b.
price, $2; quantity, 30
c.
price, $3; quantity, 40
d.
price, $4; quantity, 50
305. Given the demand (D) and supply (S) for gasoline in Figure 3-9, if the price of gasoline were $1 per
gallon,
a.
consumers would wish to purchase more than was being supplied.
b.
producers would be supplying more than consumers wished to purchase.
c.
the quantity consumers wished to purchase would equal the quantity that producers wished
to supply.
d.
there would be a tendency for the price of gasoline to fall.
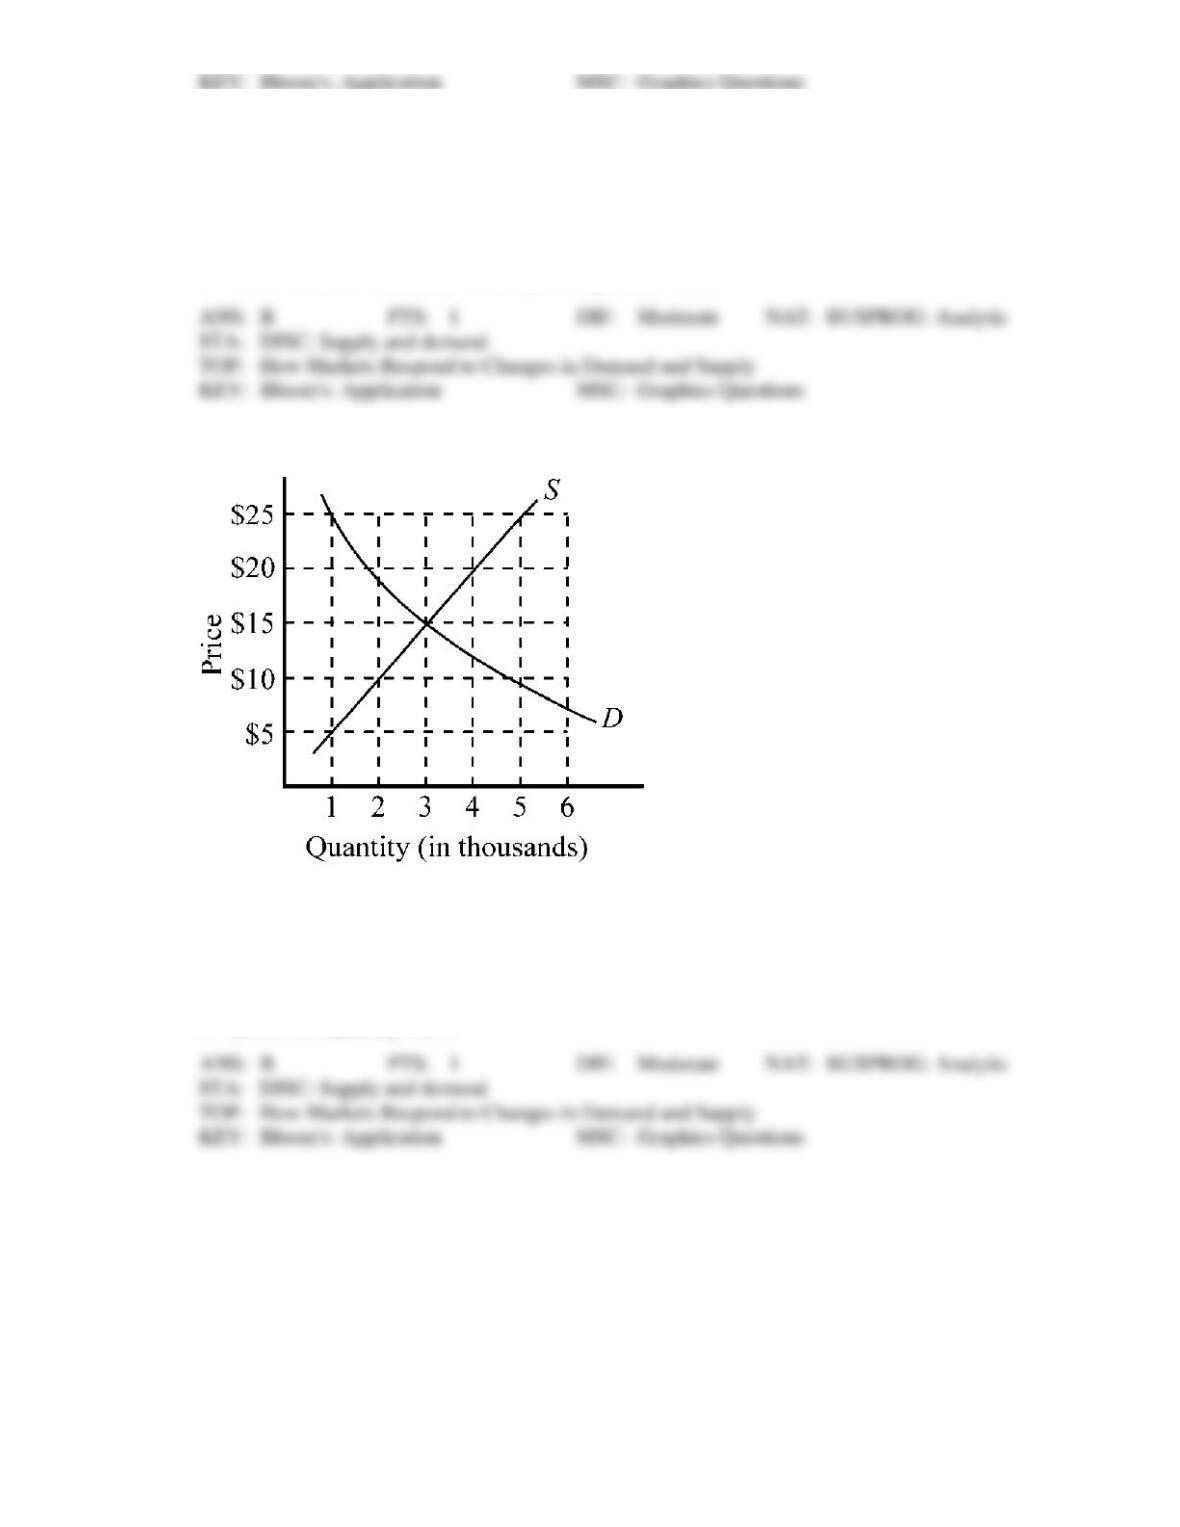
306. Given the demand (D) and supply (S) for gasoline in Figure 3-9, if the price of gasoline were $3 per
gallon,
a.
consumers would wish to purchase more than was being supplied.
b.
producers would be supplying more than consumers wished to purchase.
c.
the quantity consumers wished to purchase would equal the quantity that producers wished
to supply.
d.
there would be a tendency for the price of gasoline to rise.
Figure 3-10
307. Figure 3-10 illustrates the conditions of demand and supply in the market for compact discs. Indicate
the equilibrium price and quantity.
a.
price, $20; quantity, 2,000
b.
price, $15; quantity, 3,000
c.
price, $10; quantity, 2,000
d.
price, $10; quantity, 4,000
Figure 3-11
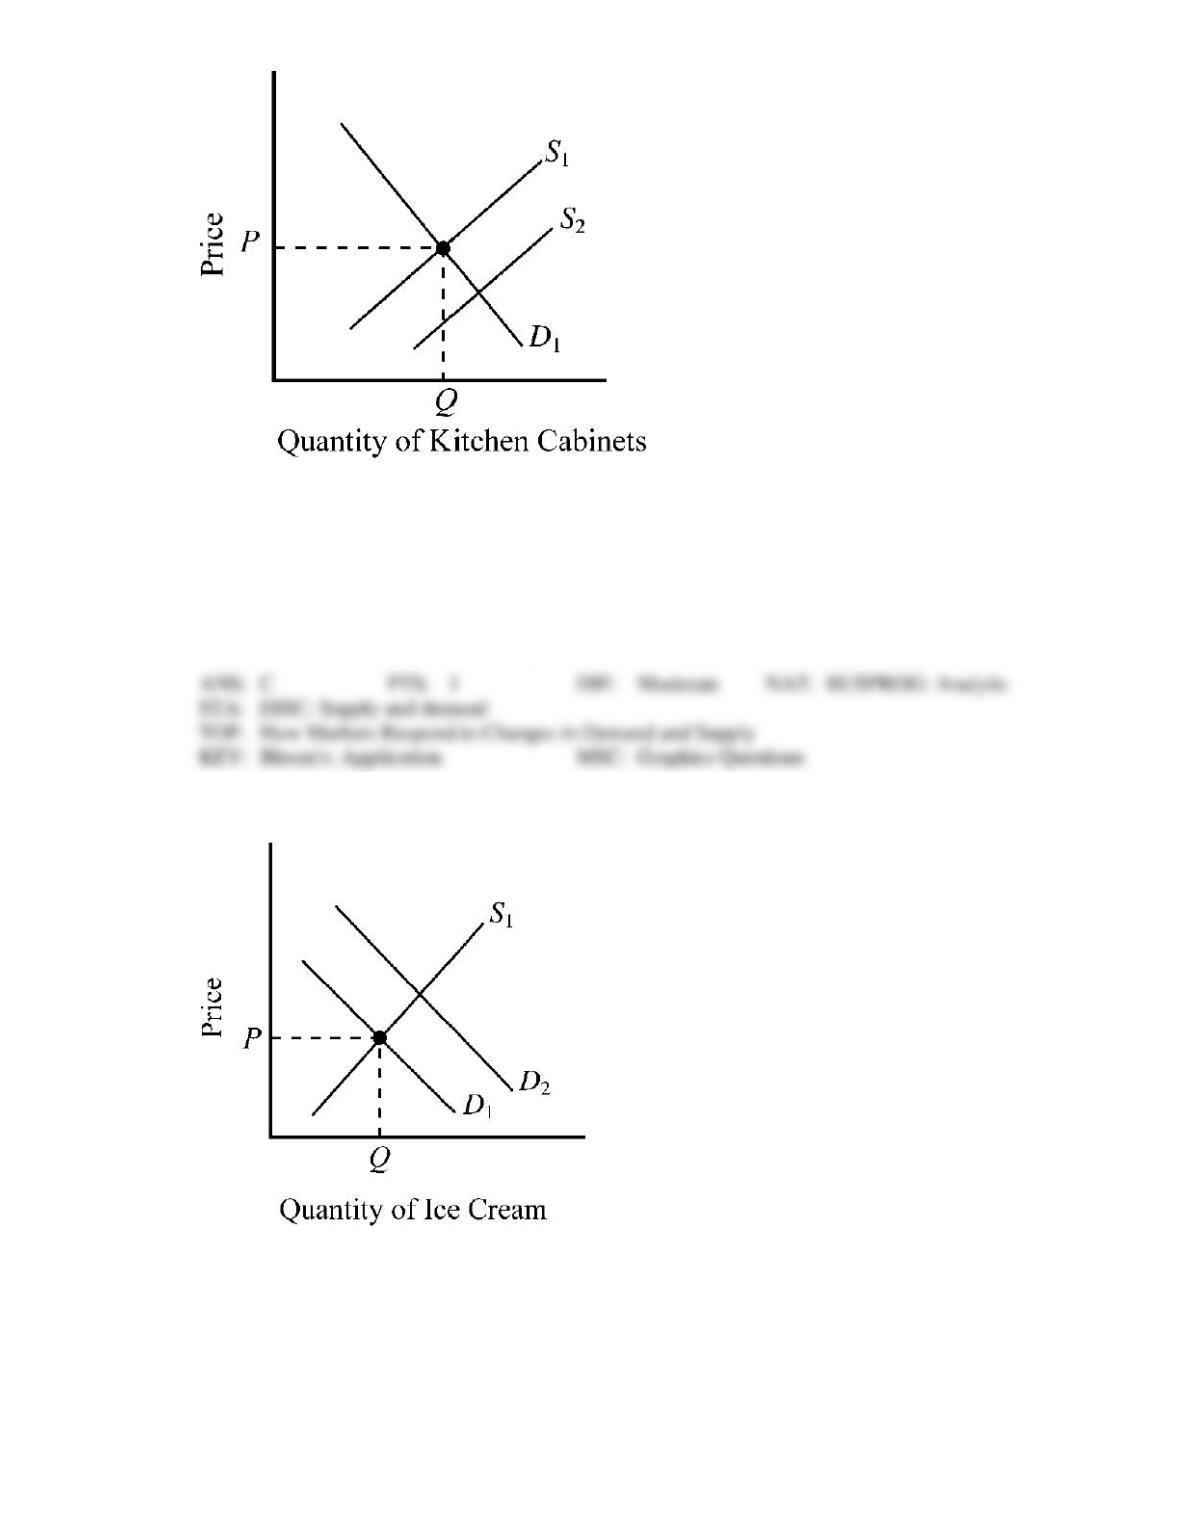
308. In Figure 3-11, suppose D1 and S1 indicate initial conditions in the market for kitchen cabinets. Which
of the following would tend to cause the supply curve to shift from S1 to S2?
a.
the invention of “folding” plates and cups that take up substantially less storage space in
the kitchen
b.
a decrease in consumer income
c.
a decrease in the price of wood, a resource used to produce kitchen cabinets
d.
an increase in the price of steel hinges, a resource used to produce kitchen cabinets
Figure 3-12
309. In Figure 3-12, suppose D1 and S1 indicate initial conditions in the market for ice cream. Which of the
following changes would tend to shift this market from D1 to D2?
a.
an increase in the price of milk, an ingredient used to produce ice cream
b.
an increase in the price of frozen yogurt, a substitute for ice cream
c.
a decrease in the price of sugar, an ingredient used to produce ice cream
d.
a decrease in consumer income
Use the figure below to answer the following question(s).
Figure 3-13
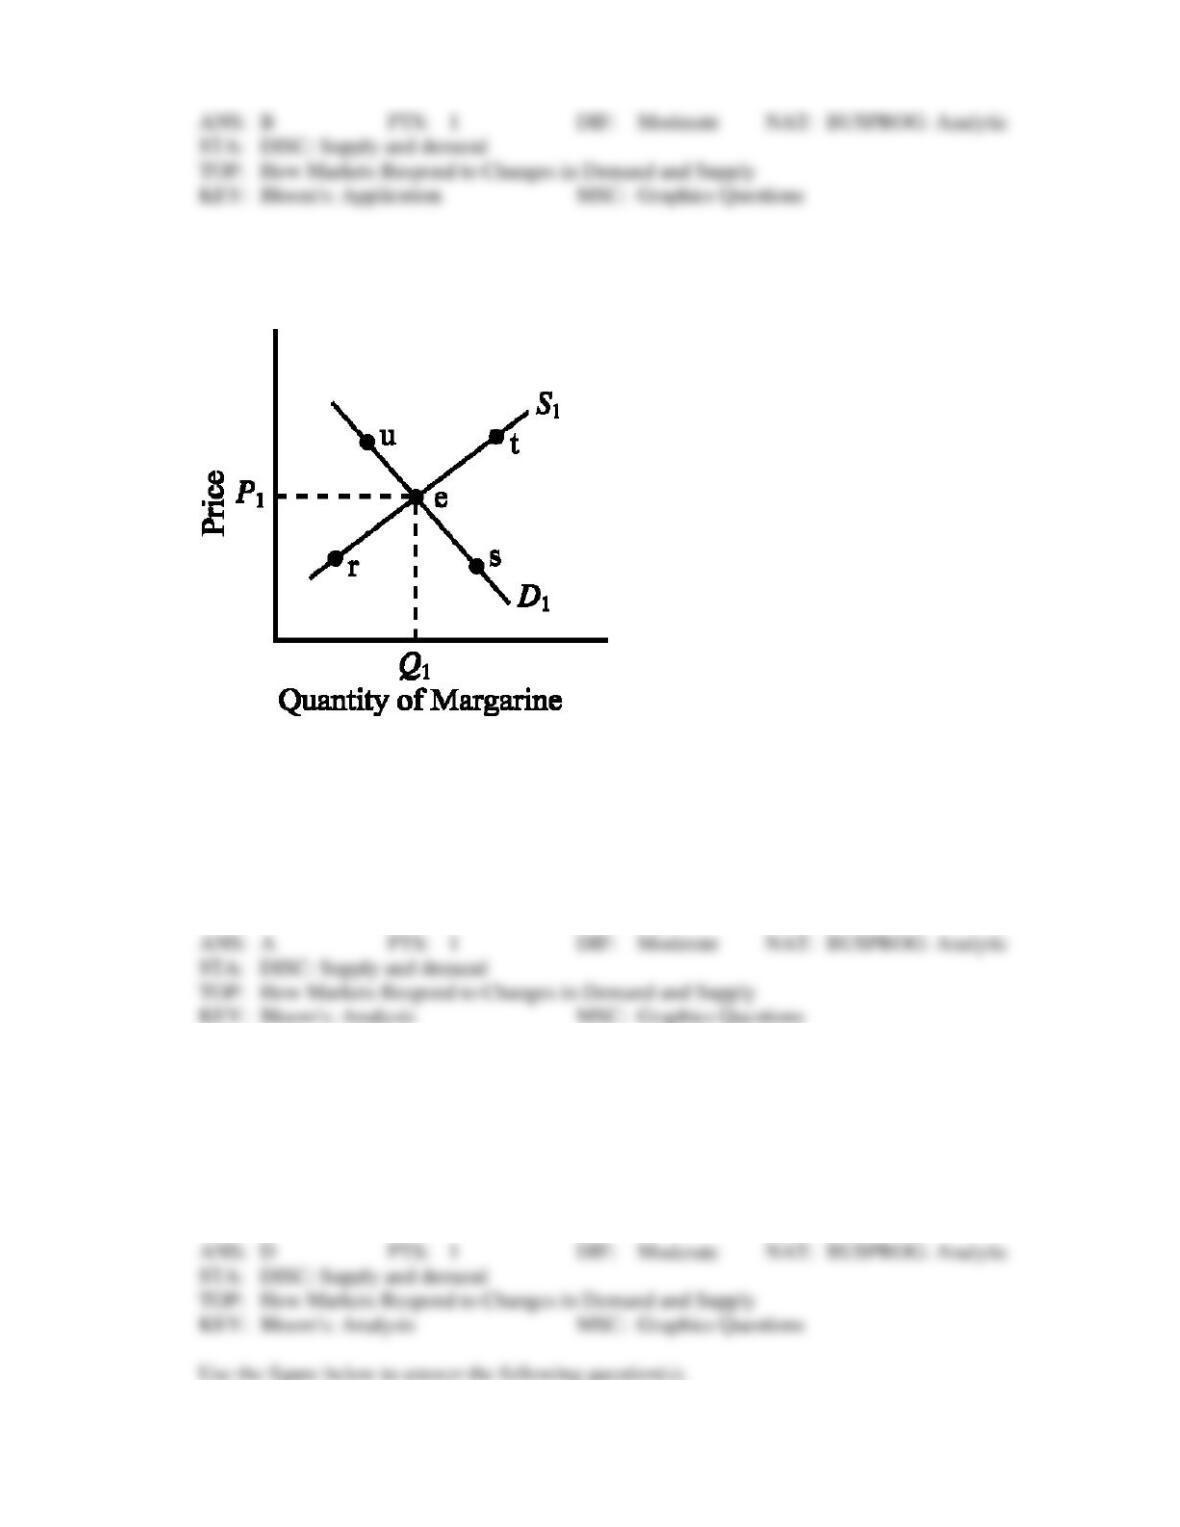
310. Refer to Figure 3-13. The market for margarine was initially in equilibrium at point e. Other things
constant, a decrease in the price of butter, a close substitute for margarine, would likely move the
equilibrium in this market toward point
a.
r.
b.
s.
c.
t.
d.
u.
311. Refer to Figure 3-13. The market for margarine was initially in equilibrium at point e. Other things
constant, an increase in the price of soybean oil, an important ingredient used to produce margarine,
would likely move the equilibrium in this market toward point
a.
r.
b.
s.
c.
t.
d.
u.
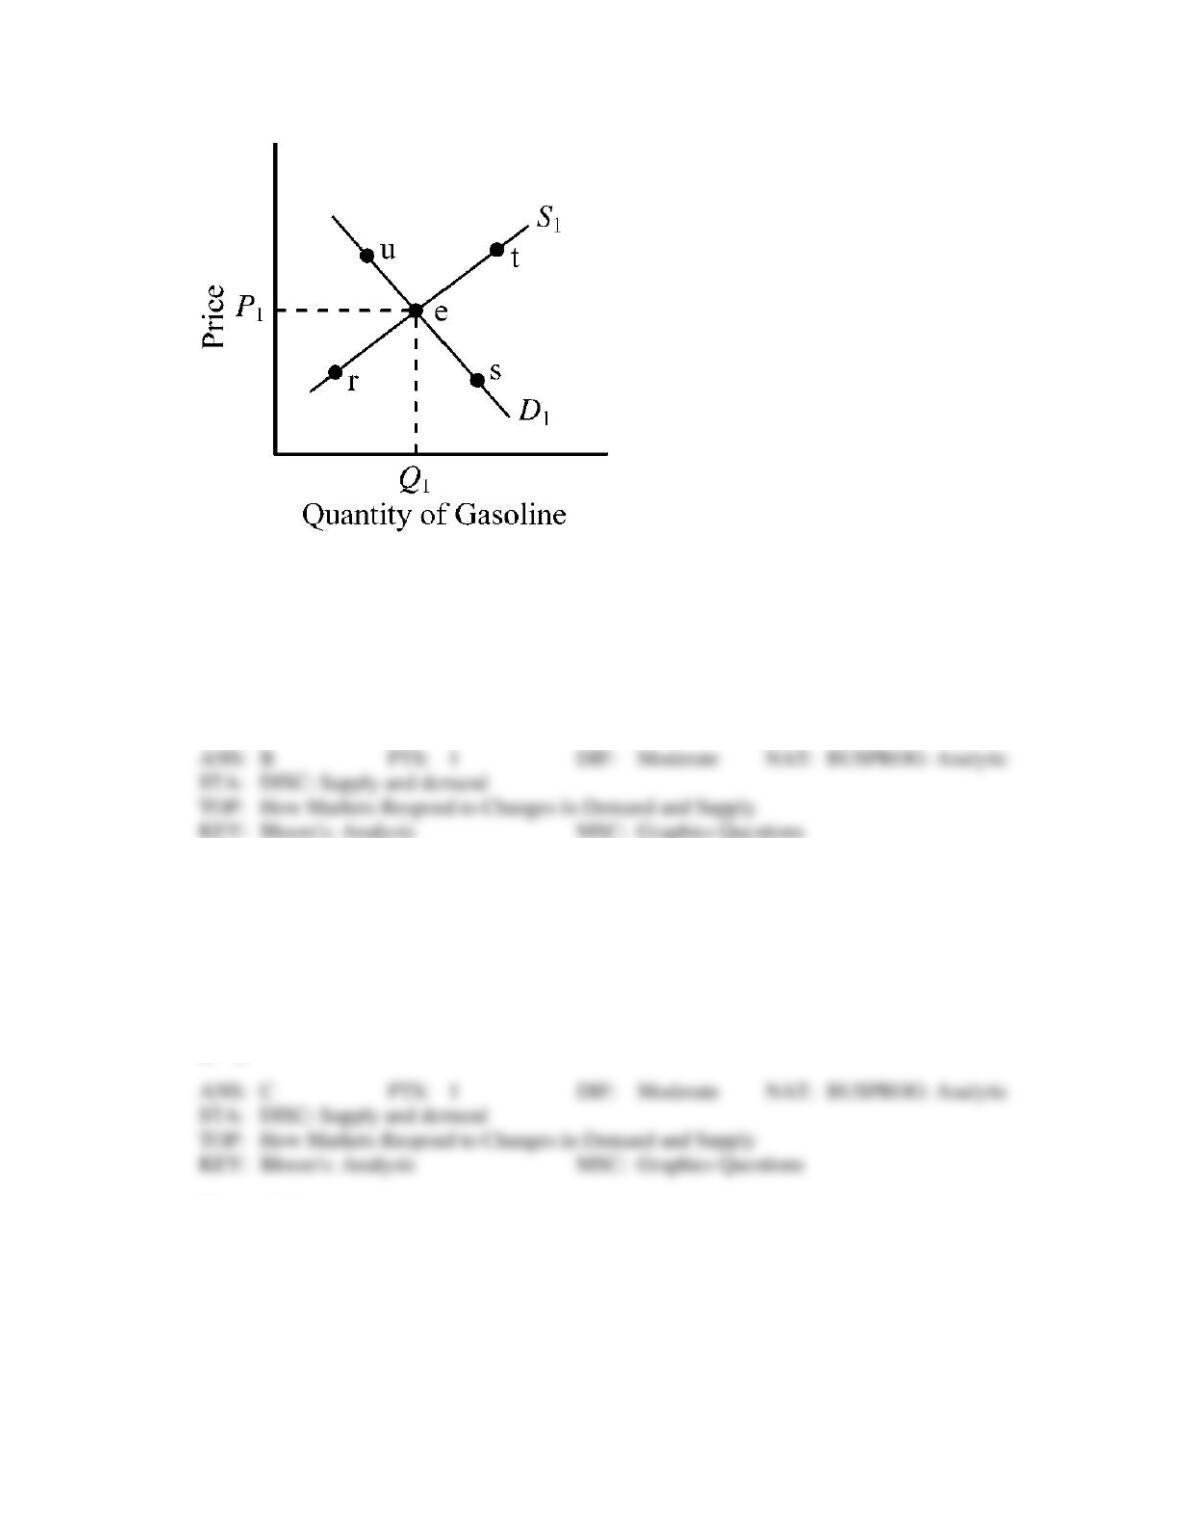
Figure 3-14
312. Refer to Figure 3-14. The gasoline market was initially in equilibrium at point e. Other things constant,
a decrease in the price of crude oil, an important ingredient used to produce gasoline, would likely
move the equilibrium in this market toward point
a.
r.
b.
s.
c.
t.
d.
u.
313. Refer to Figure 3-14. The gasoline market was initially in equilibrium at point e. Other things constant,
an increase in the popularity and use of Sport Utility Vehicles (SUVs) that consume more gasoline per
mile driven than most other types of cars would likely move the equilibrium in this market toward
point
a.
r.
b.
s.
c.
t.
d.
u.
Figure 3-15
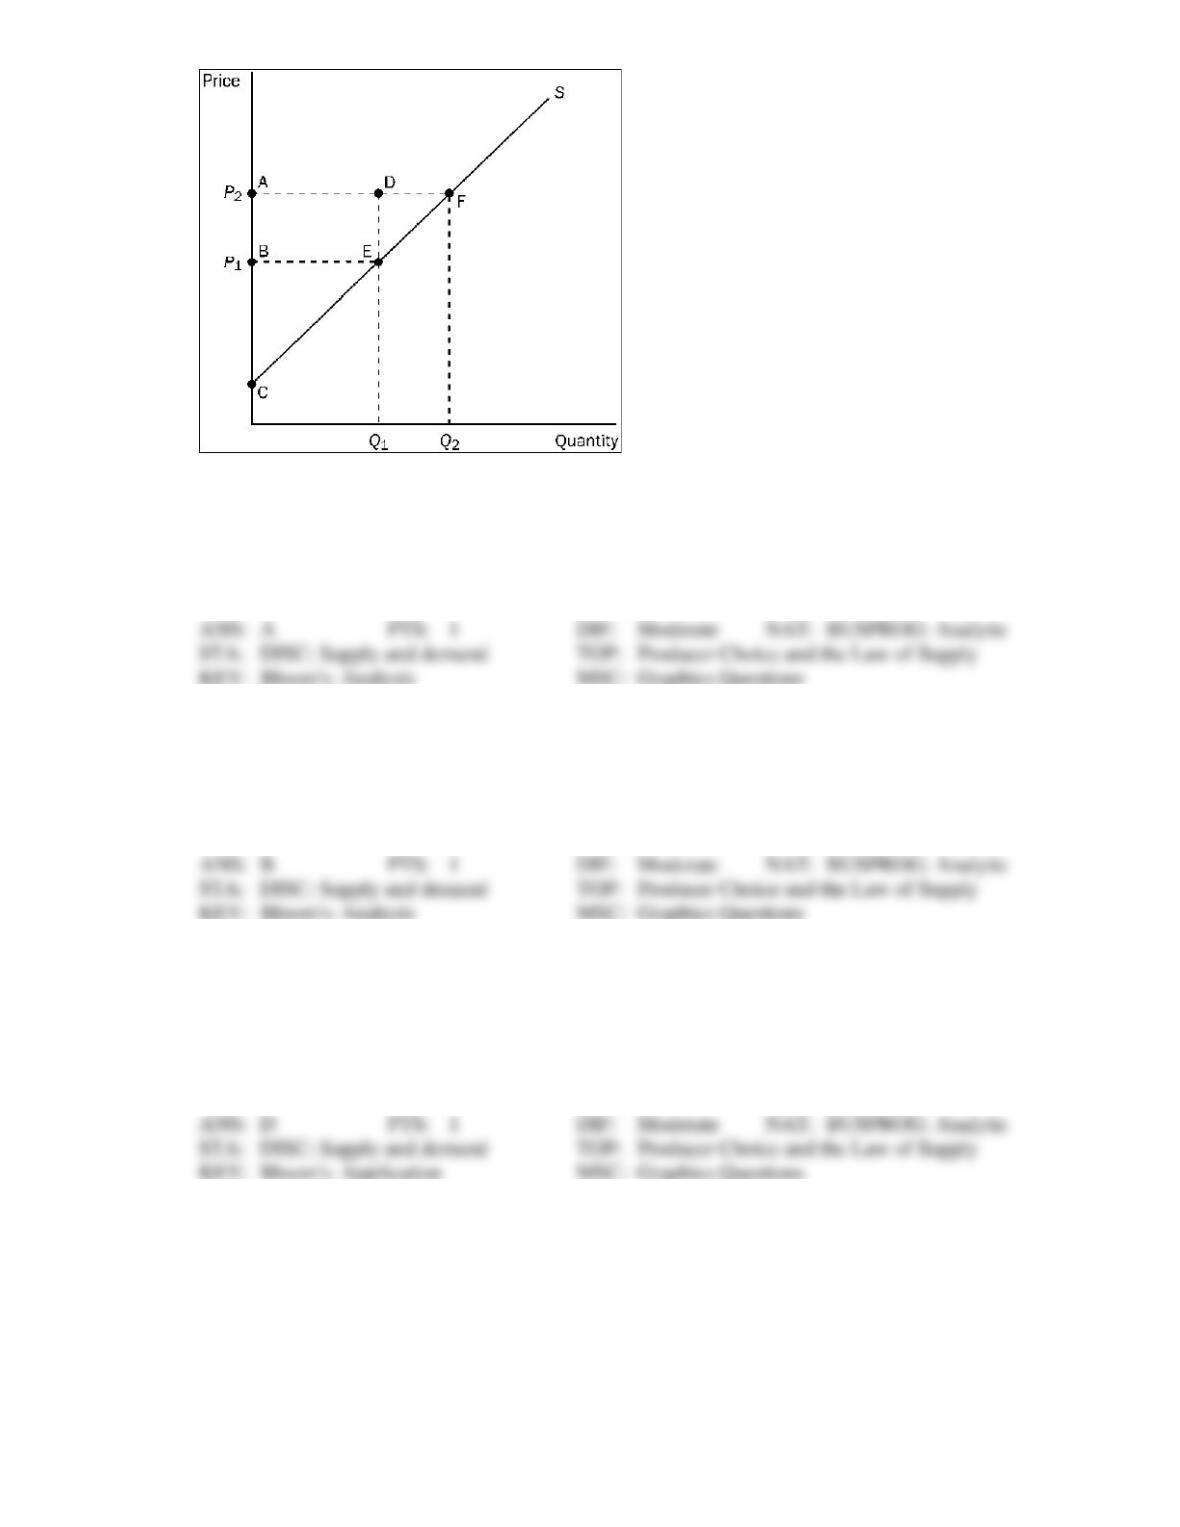
314. Refer to Figure 3-15. Which area represents producer surplus when the price is P1?
a.
BCE
b.
ACF
c.
ABED
d.
DEF
315. Refer to Figure 3-15. Which area represents producer surplus when the price is P2?
a.
BCE
b.
ACF
c.
ABED
d.
AFEB
316. Refer to Figure 3-15. Which area represents the increase in producer surplus when the price rises from
P1 to P2?
a.
BCE
b.
ACF
c.
ABED
d.
AFEB
317. Refer to Figure 3-15. When the price rises from P1 to P2, which area represents the increase in
producer surplus to existing producers?
a.
BCE
b.
ACF
c.
DEF
d.
ABED
318. Refer to Figure 3-15. Which area represents the increase in producer surplus when the price rises from
P1 to P2 due to new producers entering the market?
a.
BCE
b.
ACF
c.
DEF
d.
AFEB
Figure 3-16
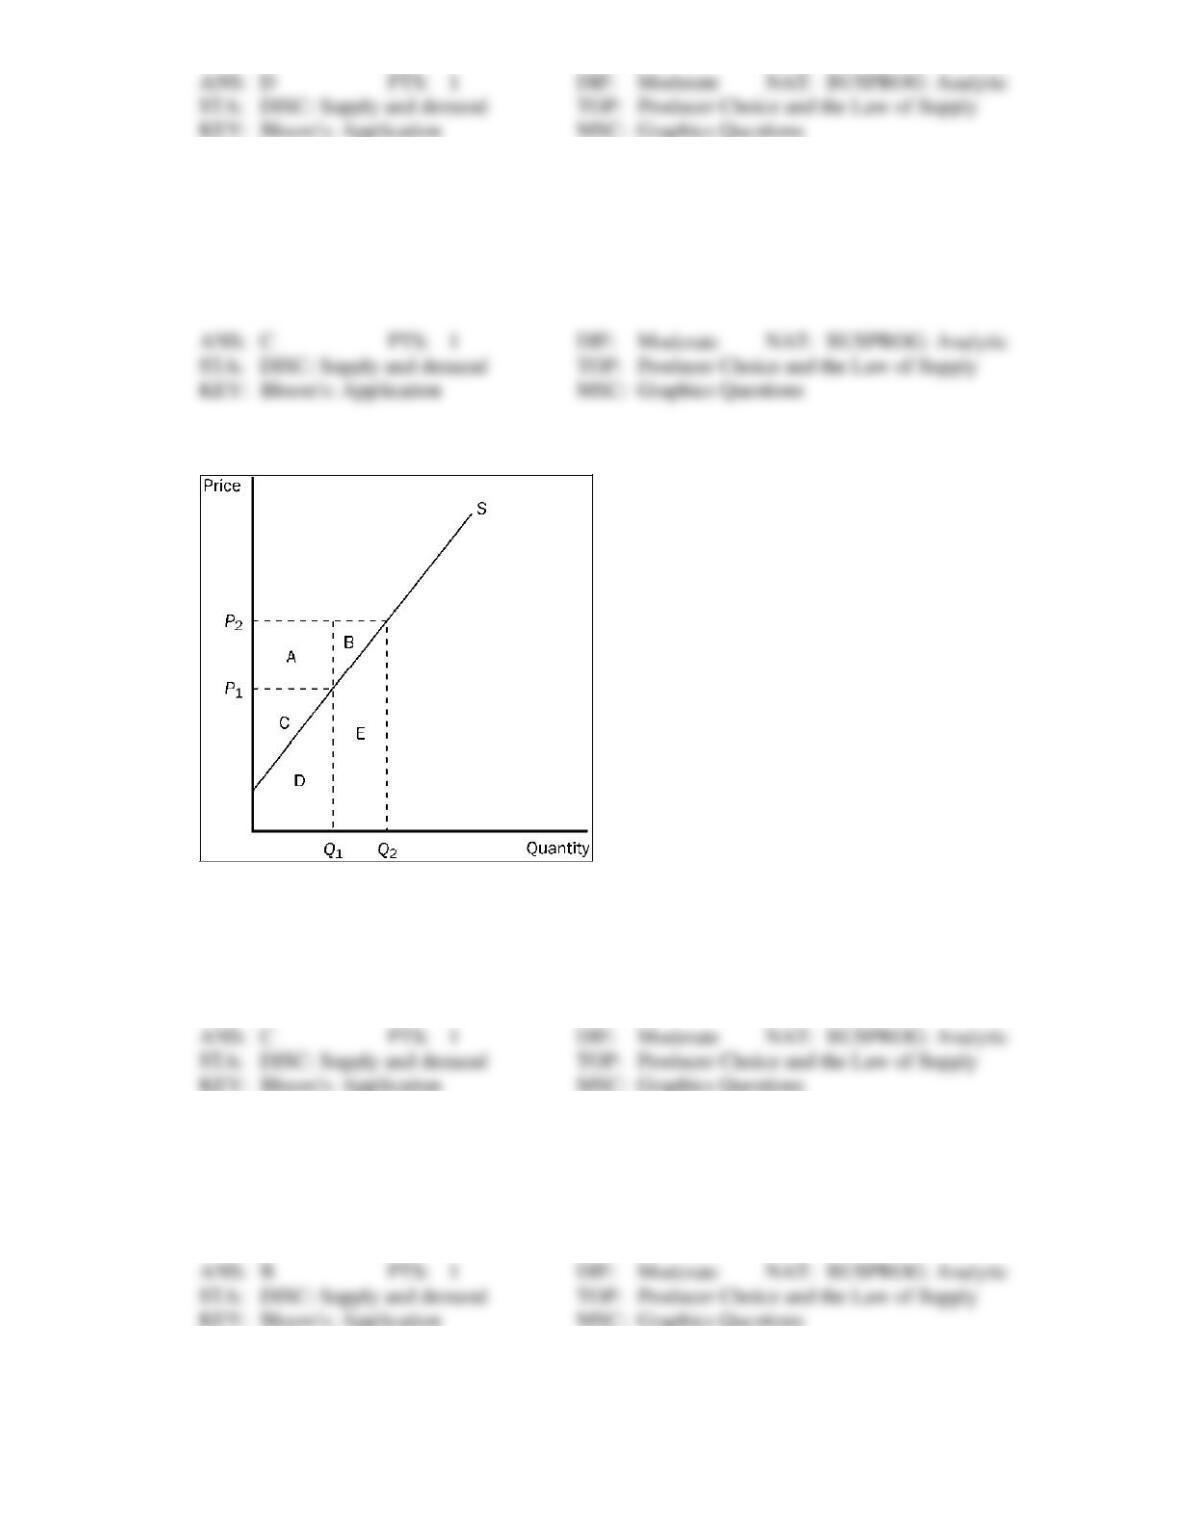
319. Refer to Figure 3-16. When the price is P2, producer surplus is
a.
A.
b.
A + C.
c.
A + B + C.
d.
D + E.
320. Refer to Figure 3-16. When the price is P1, producer surplus is
a.
A.
b.
C.
c.
A + B.
d.
C + D.
321. Refer to Figure 3-16. When the price falls from P2 to P1, producer surplus
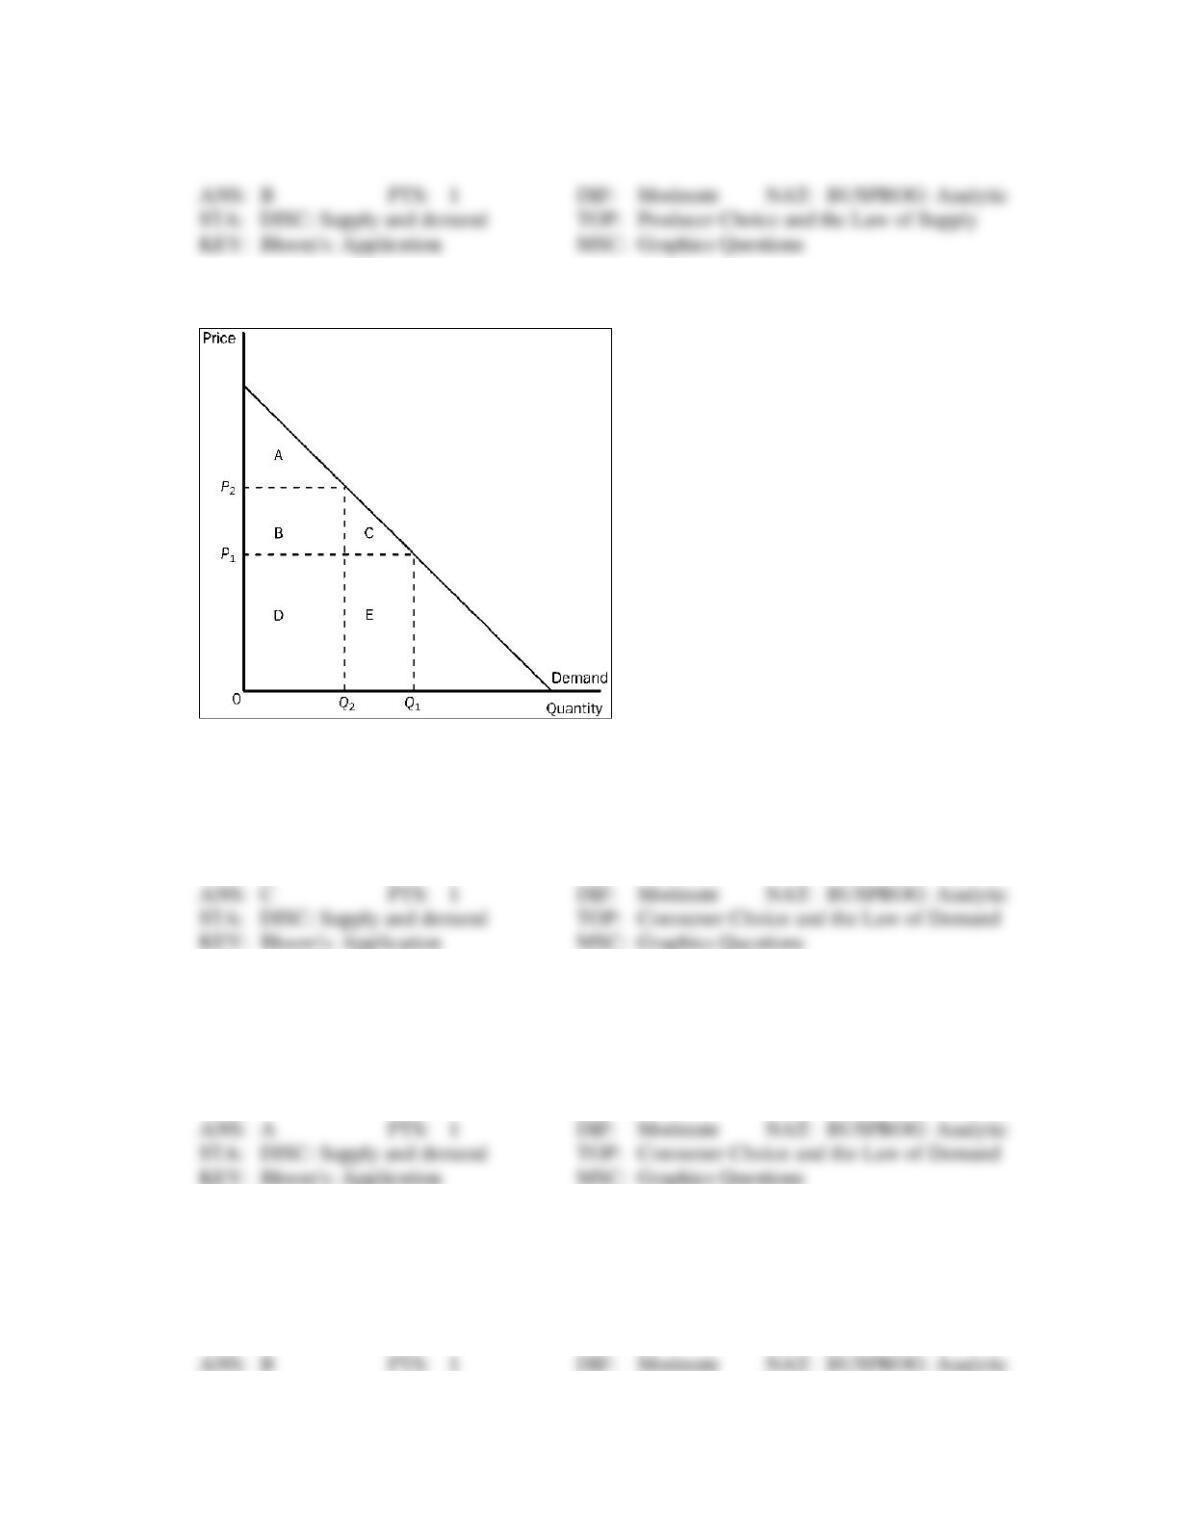
a.
decreases by an amount equal to C.
b.
decreases by an amount equal to A + B.
c.
decreases by an amount equal to A + C.
d.
increases by an amount equal to A + B.
Figure 3-17
322. Refer to Figure 3-17. When the price is P1, consumer surplus is
a.
A.
b.
A + B.
c.
A + B + C.
d.
A + B + D.
323. Refer to Figure 3-17. When the price is P2, consumer surplus is
a.
A.
b.
B.
c.
A + B.
d.
A + B + C.
324. Refer to Figure 3-17. When the price rises from P1 to P2, consumer surplus
a.
increases by an amount equal to A.
b.
decreases by an amount equal to B + C.
c.
increases by an amount equal to B + C.
d.
decreases by an amount equal to C.
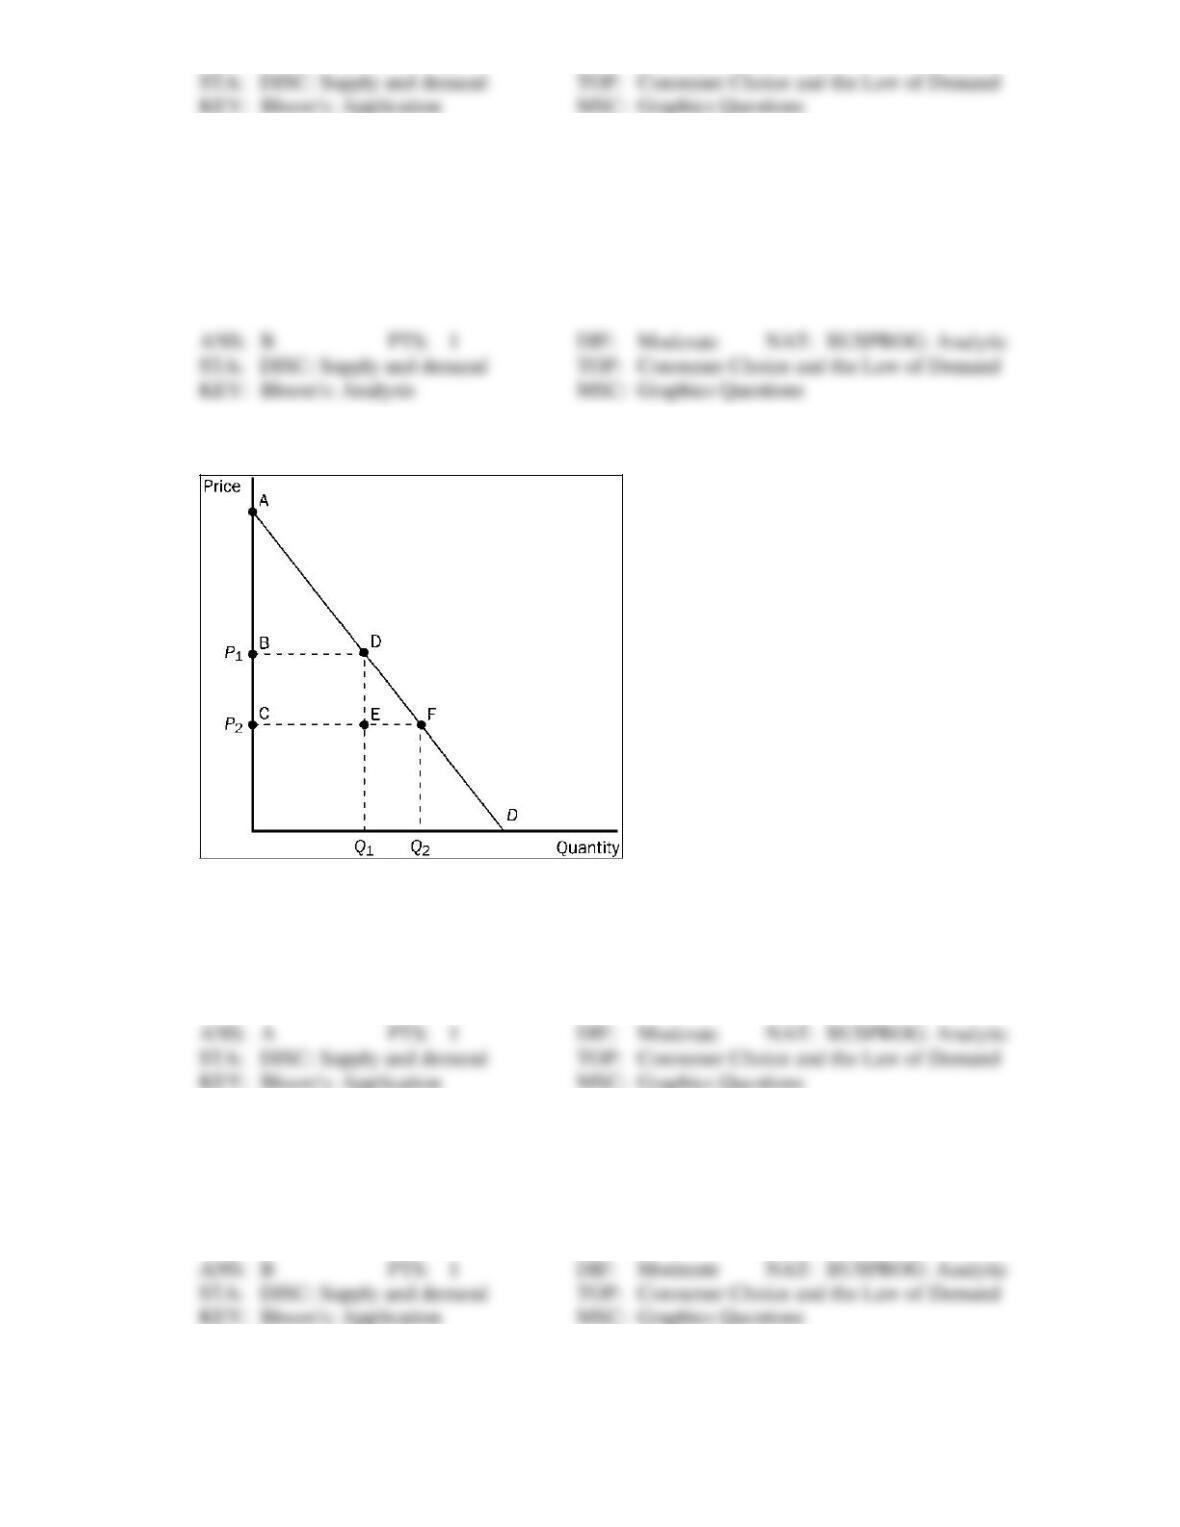
325. Refer to Figure 3-17. Area C represents
a.
the decrease in consumer surplus that results from a downward-sloping demand curve.
b.
consumer surplus to new consumers who enter the market when the price falls from P2 to
P1.
c.
the increase in producer surplus when quantity sold increases from Q2 to Q1.
d.
the decrease in consumer surplus to each consumer in the market when the price increases
from P1 to P2.
Figure 3-18
326. Refer to Figure 3-18. Which area represents consumer surplus at a price of P1?
a.
ABD
b.
ACF
c.
BCDE
d.
DEF
327. Refer to Figure 3-18. Which area represents consumer surplus at a price of P2?
a.
ABD
b.
ACF
c.
BCDE
d.
DEF
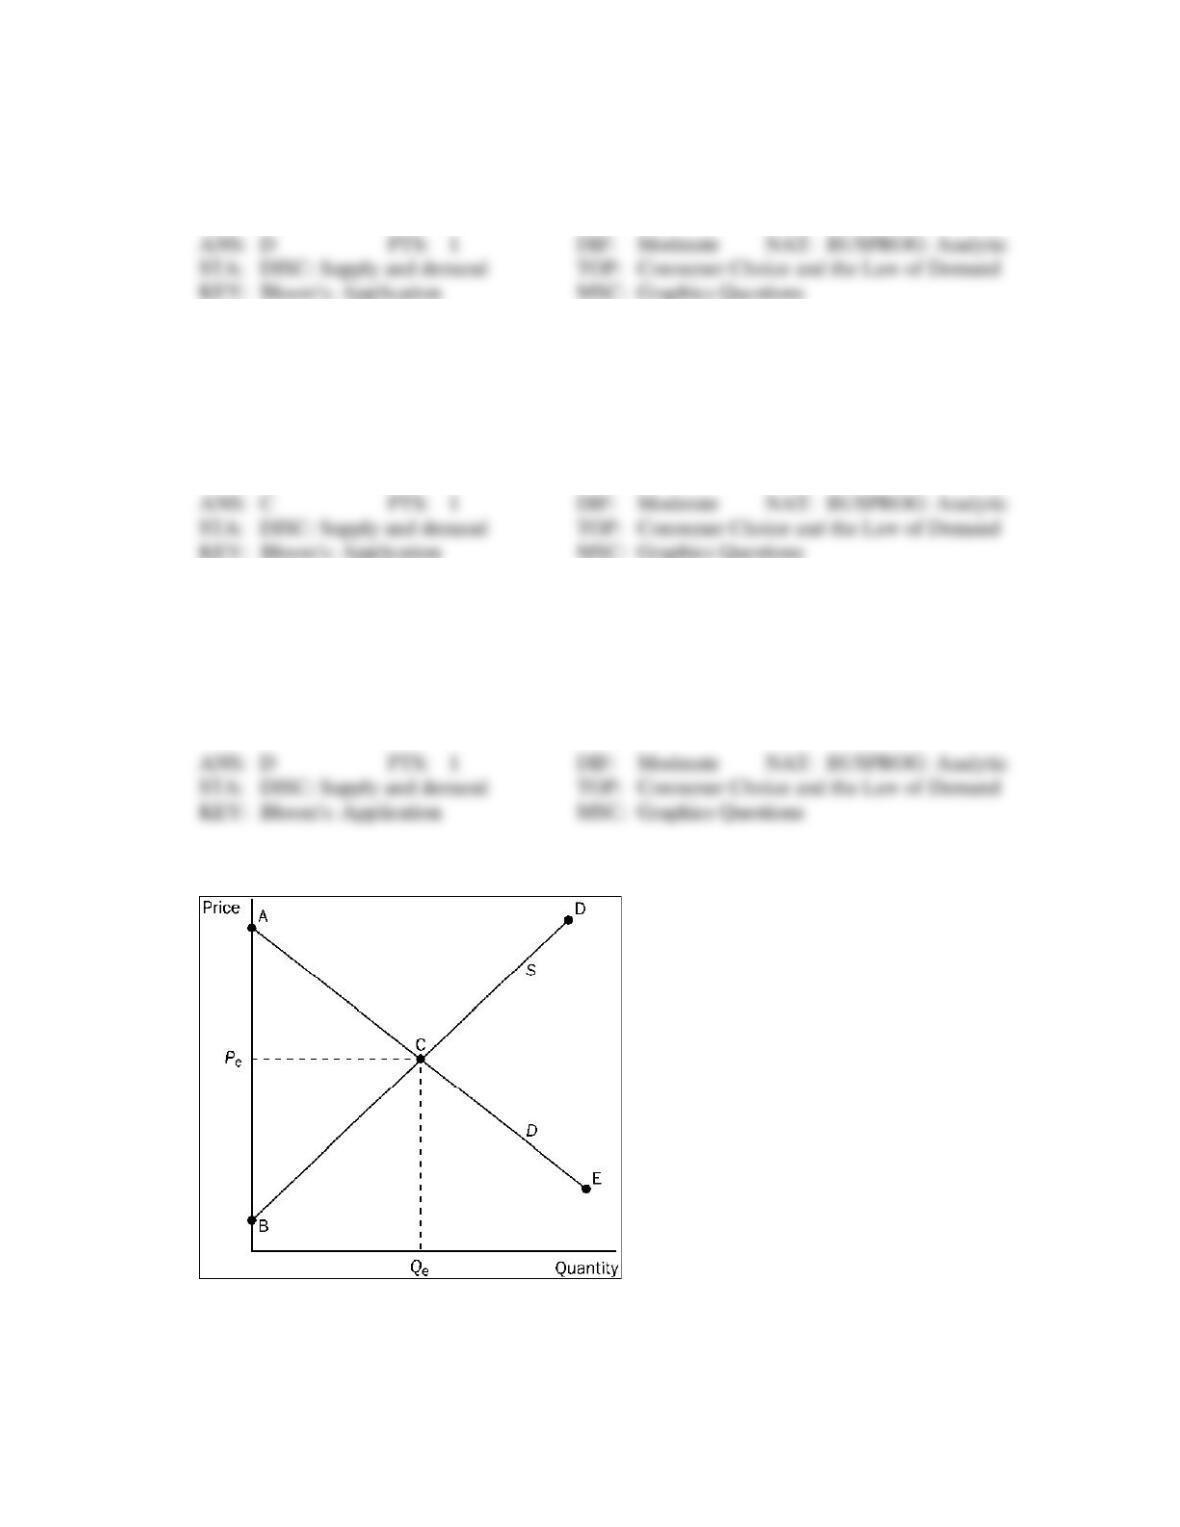
328. Refer to Figure 3-18. Which area represents the increase in consumer surplus when the price falls from
P1 to P2?
a.
ABD
b.
ACF
c.
DEF
d.
BCFD
329. Refer to Figure 3-18. When the price falls from P1 to P2, which area represents the increase in
consumer surplus to existing buyers?
a.
ABD
b.
ACF
c.
BCED
d.
DEF
330. Refer to Figure 3-18. When the price falls from P1 to P2, which area represents the increase in
consumer surplus to new buyers entering the market?
a.
ABD
b.
ACF
c.
BCDE
d.
DEF
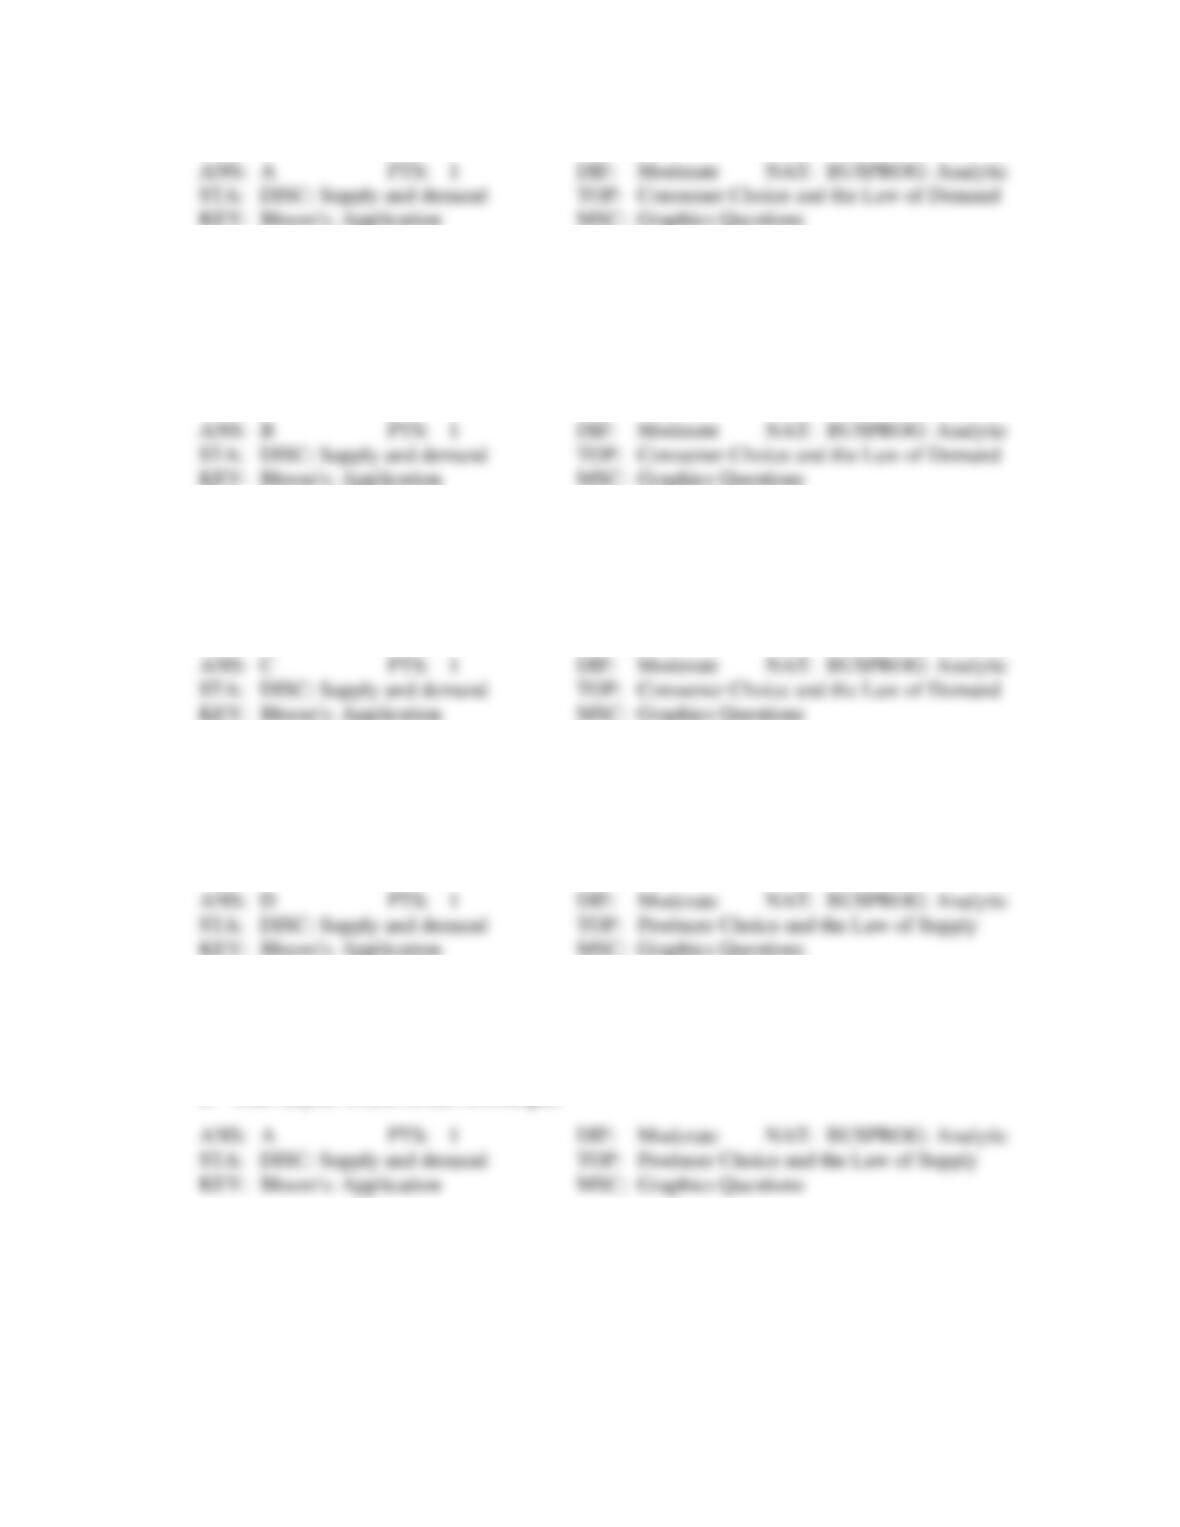
Figure 3-19
331. Refer to Figure 3-19. Buyers who value this good more than price are represented by which line
segment?
a.
AC
b.
CE
c.
BC
d.
CD
332. Refer to Figure 3-19. Buyers who value this good less than price are represented by which line
segment?
a.
AC.
b.
CE.
c.
BC.
d.
CD.
333. Refer to Figure 3-19. Sellers whose costs are less than price are represented by which line segment?
a.
AC
b.
CE
c.
BC
d.
CD
334. Refer to Figure 3-19. Sellers whose costs are greater than price are represented by segment
a.
AC
b.
CE
c.
BC
d.
CD
335. Refer to Figure 3-19. If the government mandated a price increase from Pe to a higher price, then
a.
total surplus would decrease.
b.
consumer surplus would increase.
c.
total surplus would increase, since producer surplus would increase.
d.
total surplus would remain unchanged.
Figure 3-20
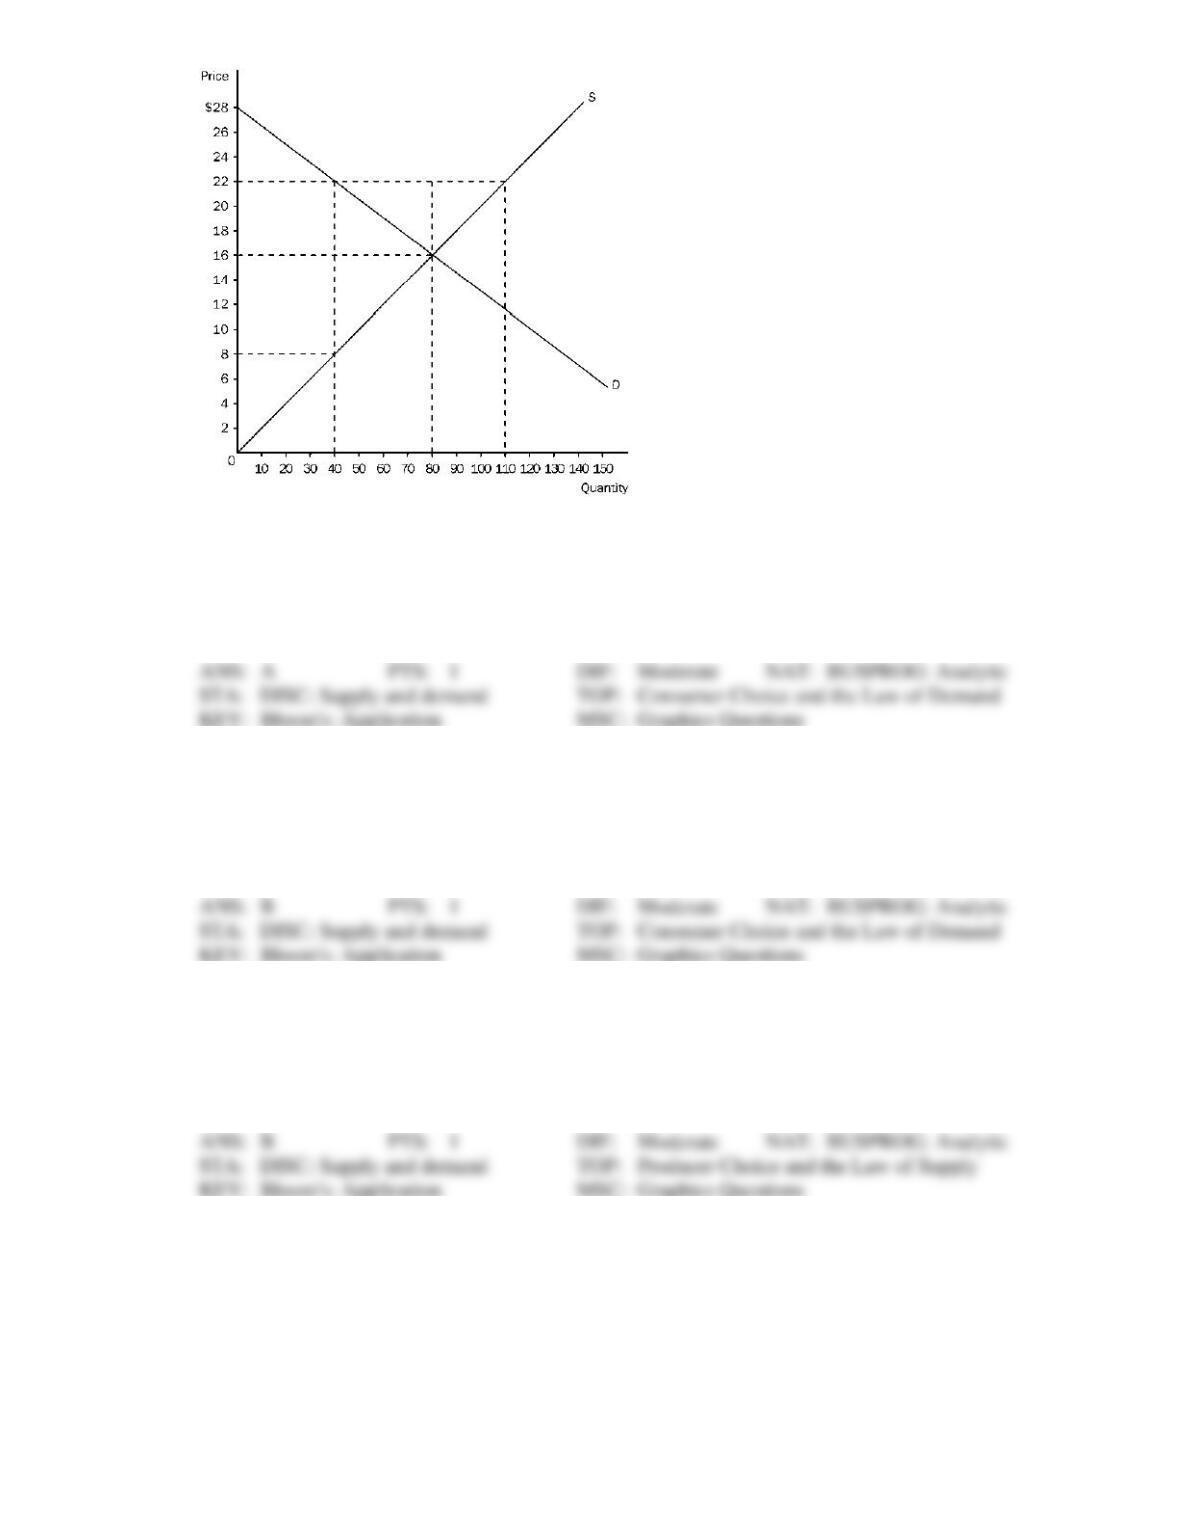
336. Refer to Figure 3-20. At the equilibrium price, consumer surplus is
a.
$480.
b.
$640.
c.
$1,120.
d.
$1,280.
337. Refer to Figure 3-20. If the price decreases from $22 to $16, consumer surplus increases by
a.
$120.
b.
$360.
c.
$480.
d.
$600.
338. Refer to Figure 3-20. At the equilibrium price, producer surplus is
a.
$480.
b.
$640.
c.
$1,120.
d.
$1,280.
339. Refer to Figure 3-20. If 110 units of the good are being bought and sold, then
a.
the cost to sellers is equal to the value to buyers.
b.
the value to buyers is greater than the cost to sellers.
c.
the cost to sellers is greater than the value to buyers.
d.
producer surplus is greater than consumer surplus.
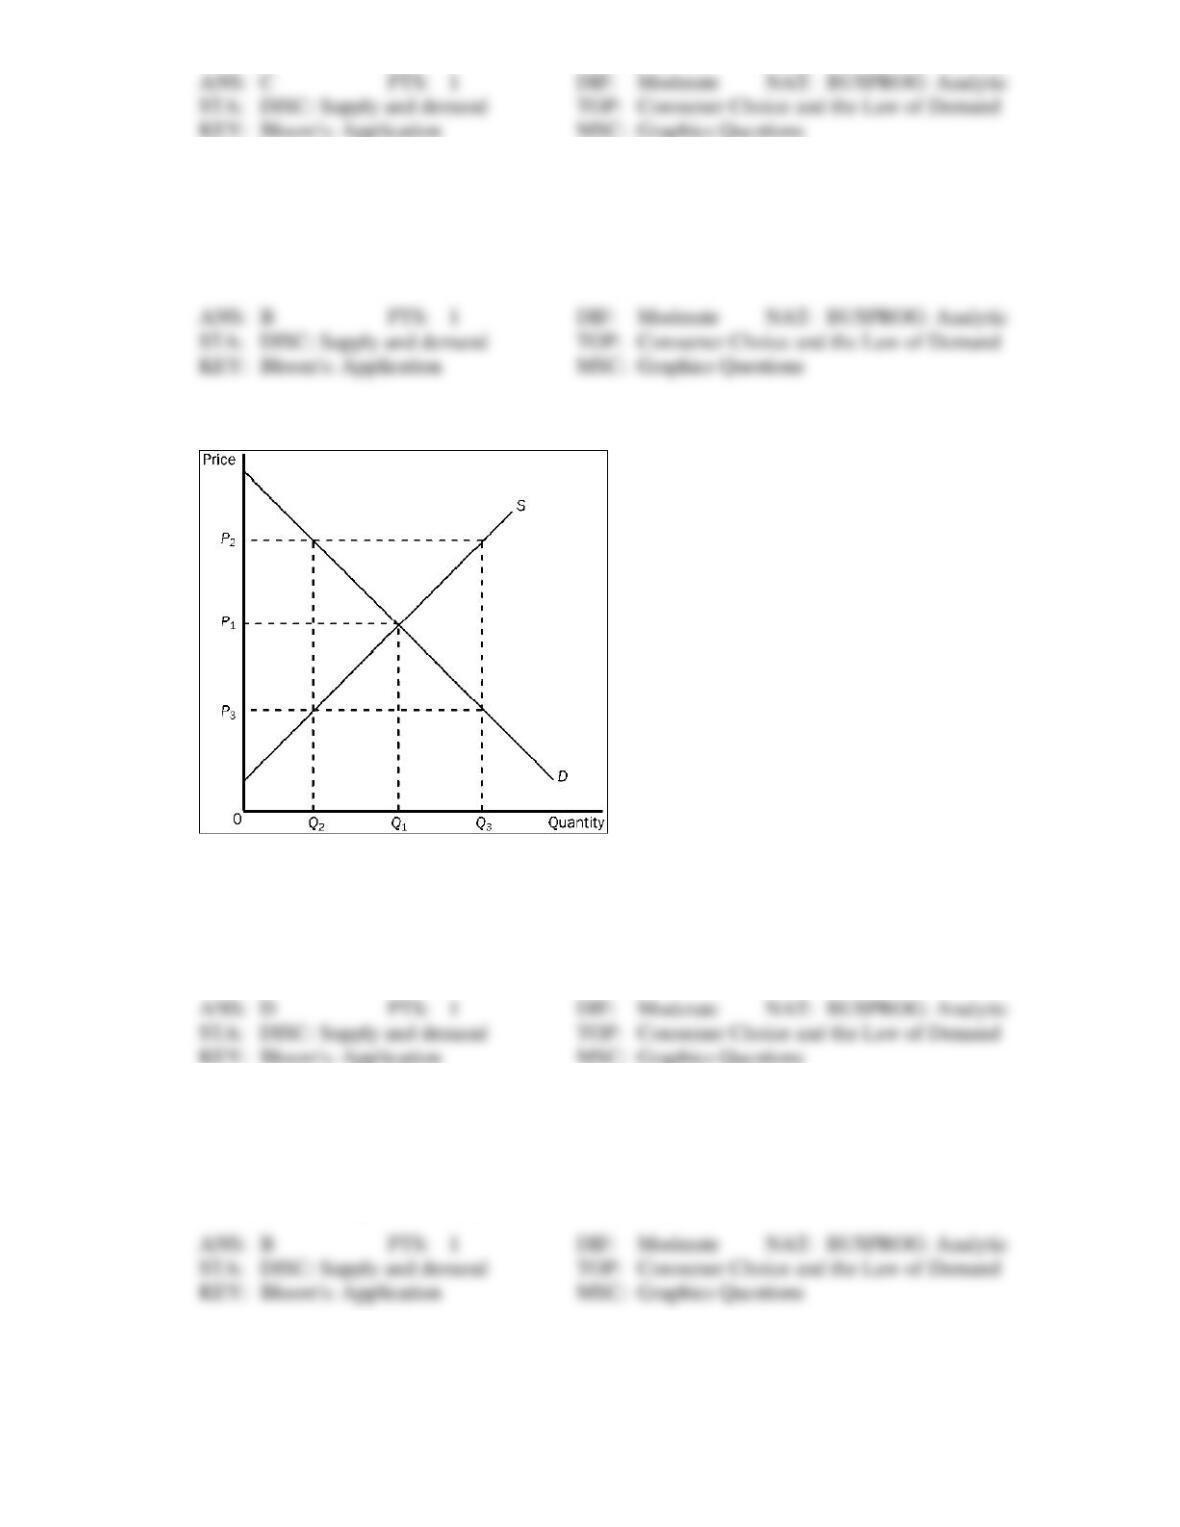
340. Refer to Figure 3-20. If 40 units of the good are being bought and sold, then
a.
cost to sellers is equal to the value to buyers.
b.
the value to buyers is greater than the cost to sellers.
c.
the cost to sellers is greater than the value to buyers.
d.
producer surplus would be greater than consumer surplus.
Figure 3-21
341. Refer to Figure 3-21. At the quantity Q3,
a.
the market is in equilibrium.
b.
consumer surplus is maximized.
c.
the sum of consumer surplus and producer surplus is maximized.
d.
the value to buyers is less than the cost to sellers.
342. Refer to Figure 3-21. At the quantity Q2,
a.
the value to buyers and the cost to sellers are both P2.
b.
the value to buyers is P2 and the cost to sellers is P3.
c.
the value to buyers and the cost to sellers are both P3.
d.
the value to buyers is P3 and the cost to sellers is P2.
Figure 3-22
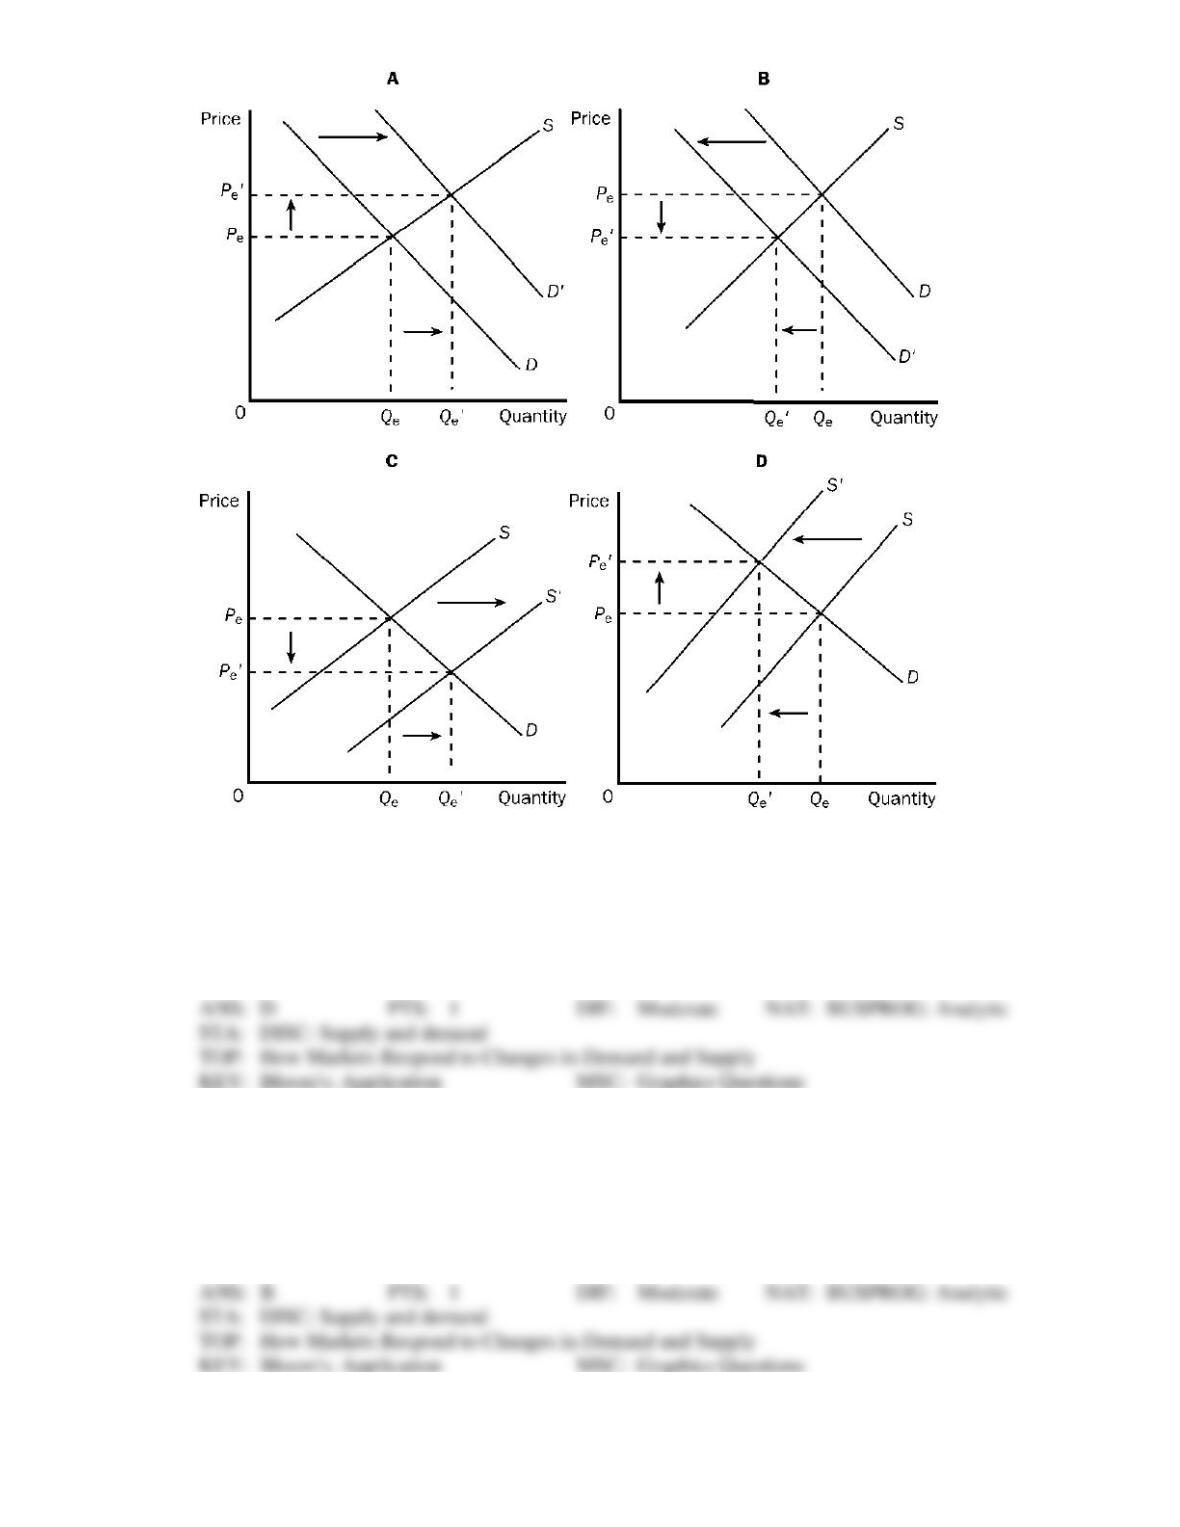
343. Refer to Figure 3-22. Which of the four graphs represents the market for peanut butter after a major
hurricane hits the peanut-growing south?
a.
A
b.
B
c.
C
d.
D
344. Refer to Figure 3-22. Which of the four graphs represents the market for winter coats as we progress
from winter to spring?
a.
A
b.
B
c.
C
d.
D