69) The income effect explains why there is a direct relationship between the price of a product and the
quantity of the product demanded.
70) If consumers believe the price of tablet computers will increase in the future, this will cause the
demand for tablet computers to decrease now.
71) The income effect of a price change refers to the change in the quantity demanded of a good that
results from a change in the price of a substitute product.
72) If the price of peaches, a substitute for plums, increases the demand for plums will decrease.
73) An inferior good is a good for which the quantity demanded increases as the price decreases,
holding everything else constant.
74) The substitution effect explains why there is an inverse relationship between the price of a product
and the quantity of the product demanded.
75) If consumers believe the price of hybrid vehicles will decrease in the future, this will cause the
demand for hybrid vehicles to decrease now.
76) What is the difference between a “change in demand” and a “change in quantity demanded”?
77) Explain the Law of Demand.
78) What is the difference between a demand schedule and a demand curve?
79) Explain the difference between substitutes and complements.
80) Cole was discussing the market for cocoa beans with his friend John Schmidt. Cole said, “Ever since
Venezuela announced that its cocoa harvest was its lowest ever in fifteen years, the price of cocoa beans
has been rising and rising and people are buying more and more. I think the demand for cocoa beans
must be upward sloping.” Is Cole right? Briefly explain why or why not.
81) For each of the following pairs of products, state which are complements, which are substitutes, and
which are unrelated.
a. Swim fins and scuba tanks
b. Coca Cola and Volkswagens
c. Printers and ink cartridges
d. Ice and ice chests
e. Heineken and Corona
82) For each of the following pairs of products, state which are complements, which are substitutes, and
which are unrelated.
a. House plants and potato chips
b. Eyeglasses and contact lenses
c. Motorcycles and gasoline
d. Smartphone and smartphone apps
e. Red wine and white wine
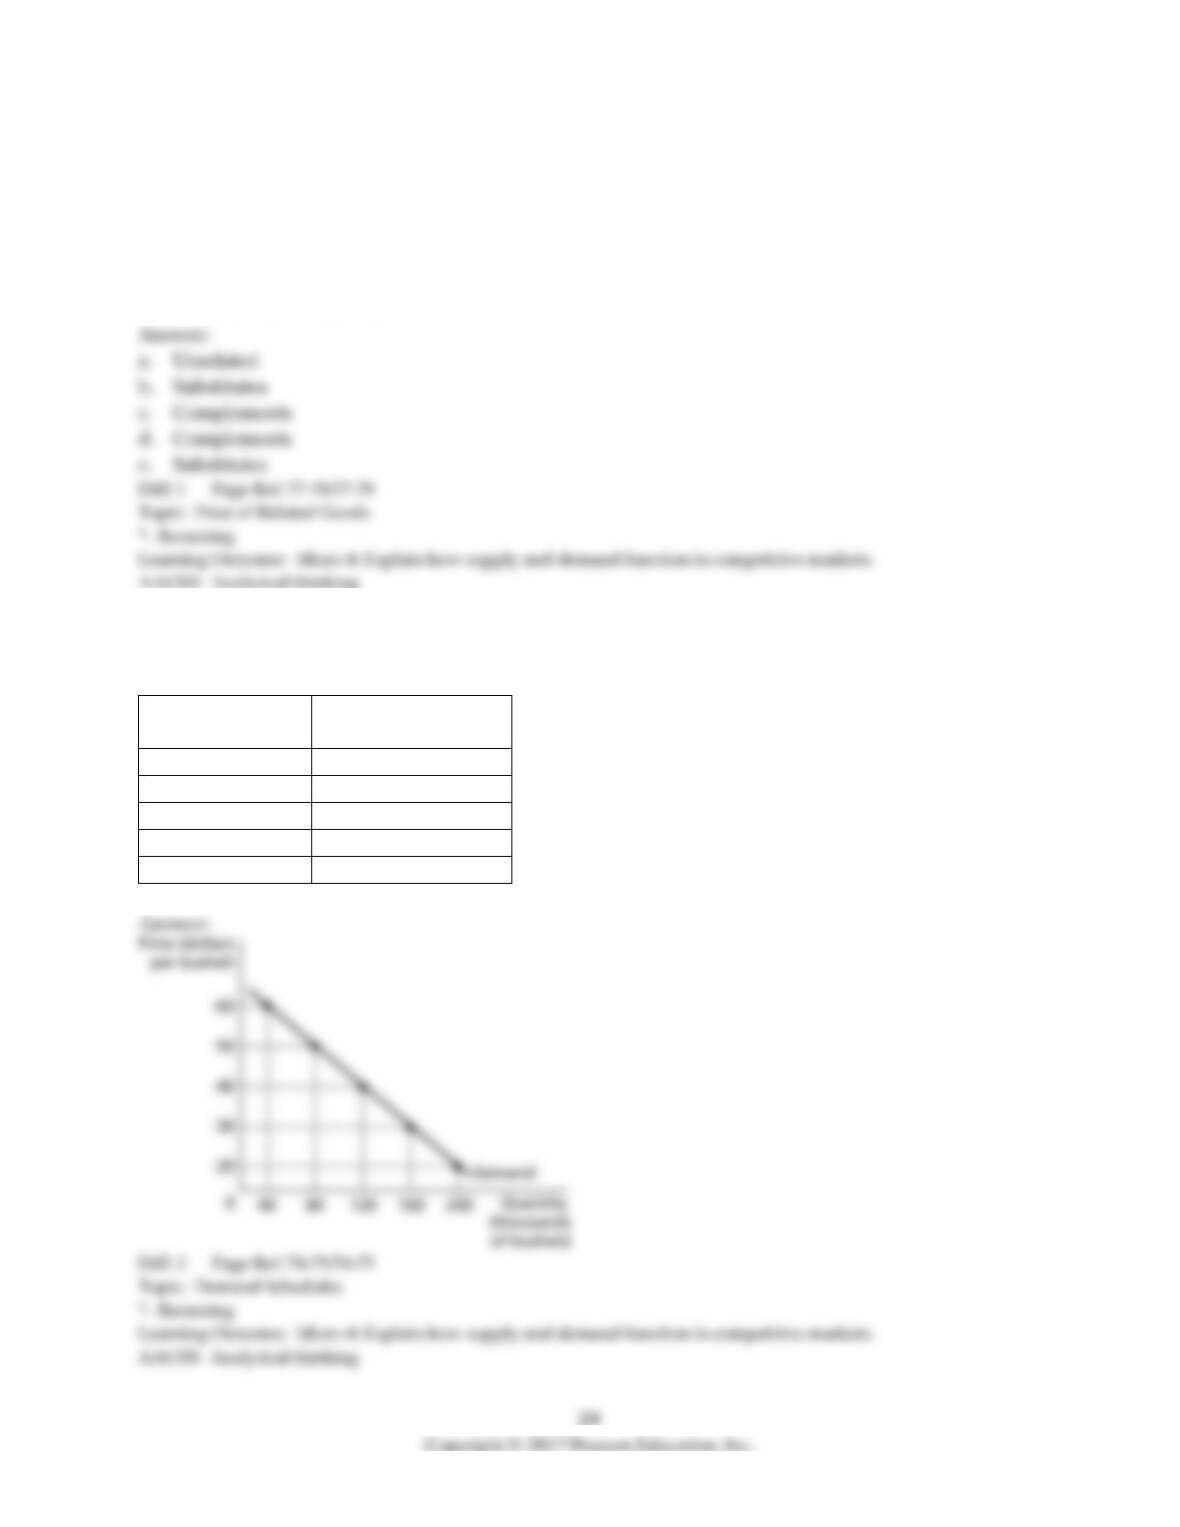
83) Use the following demand schedule for cherries to draw a graph of the demand curve. Be sure to
label the demand curve and each axis, and show each point on the demand curve.
Price (dollars per
bushel)
Quantity (thousands
of bushels)
60
40
50
80
40
120
30
160
20
200
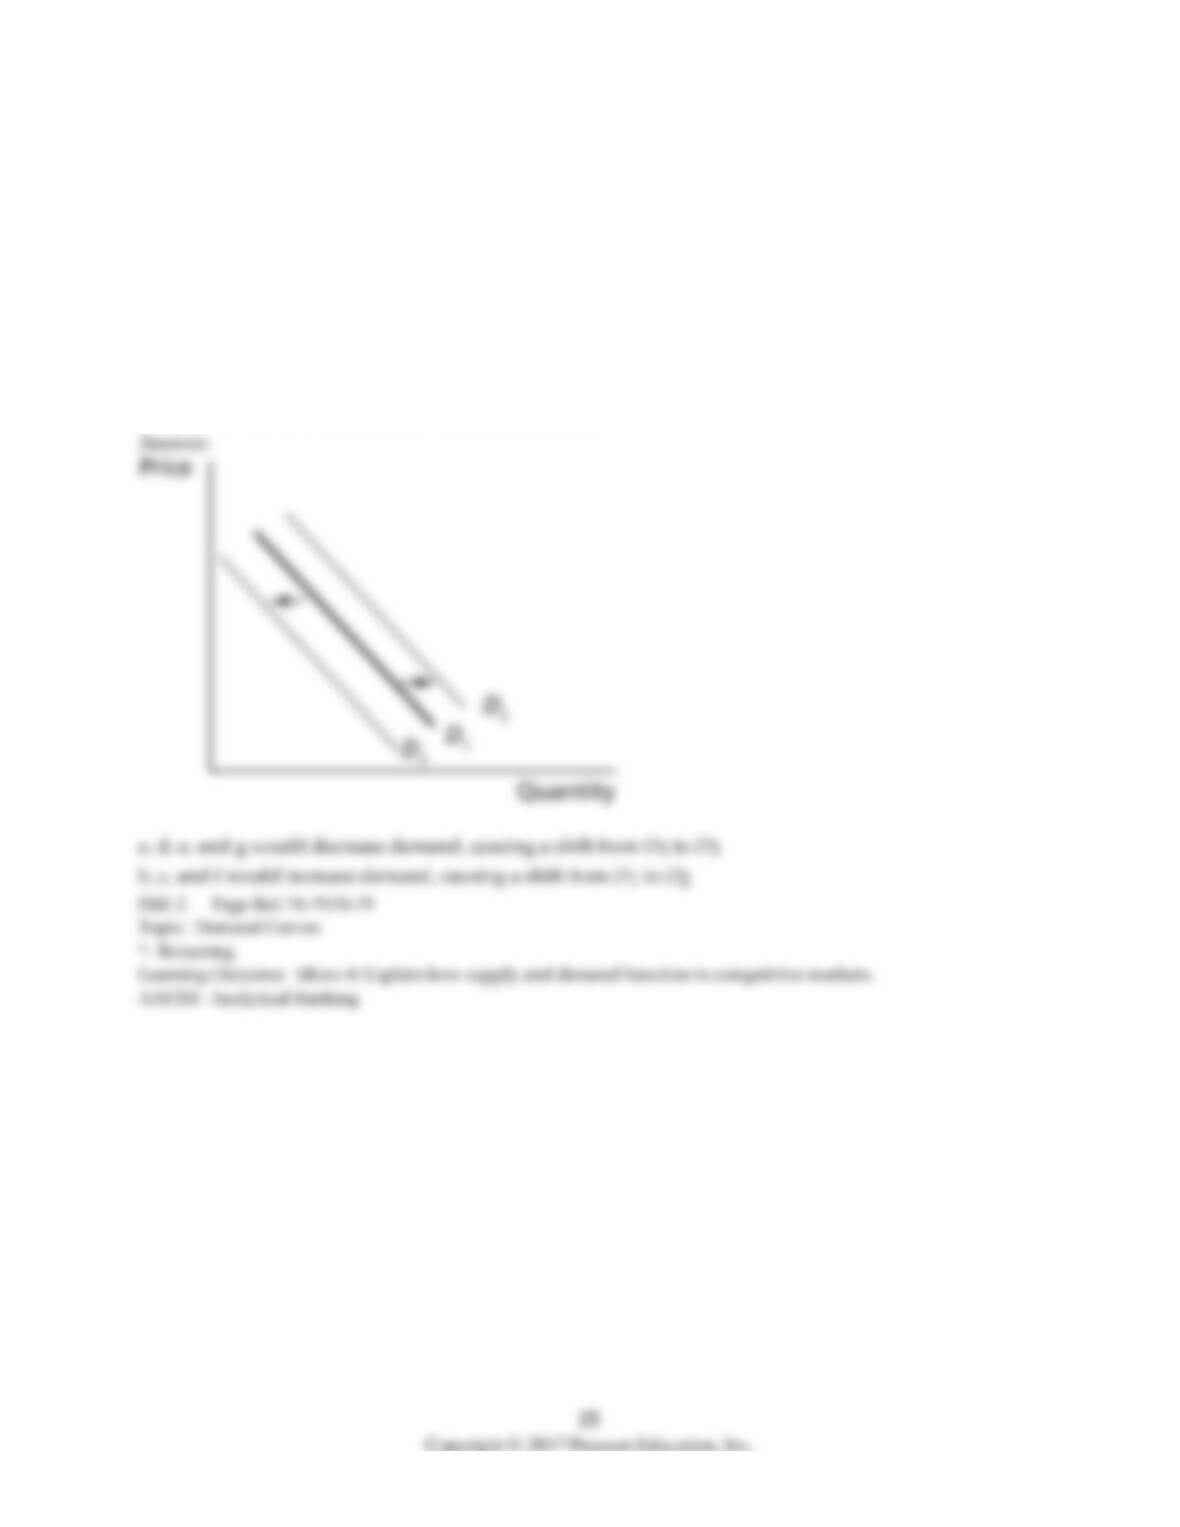
84) Draw a demand curve and label it D1. On the graph, illustrate an increase in demand and a
decrease in demand, and label the curves D2 and D3, respectively. Starting on demand curve D1,
explain the shift that would result from each of the following events:
a. a decrease in income and the good is a normal good
b. a decrease in income and the good is an inferior good
c. an increase in the price of a substitute good
d. an increase in the price of a complementary good
e. a decrease in the taste for the good
f. an increase in population
g. a decrease in the expected future price of the good
3.2 The Supply Side of the Market
1) A supply curve
A) is a table that shows the relationship between the price of a product and the quantity of the product
supplied.
B) is a curve that shows the relationship between the price of a product and the quantity of the product
supplied.
C) is the relationship between the supply of a good and the cost of producing the good.
D) is a curve that shows the relationship between the price of a product and the quantity of the product
that producers and consumers are willing to exchange.
2) If in the market for apples the supply has decreased, then
A) the supply curve for apples has shifted to the right.
B) there has been a movement upwards along the supply curve for apples.
C) the supply curve for apples has shifted to the left.
D) there has been a movement downwards along the supply curve for apples.
3) If in the market for bananas the supply curve has shifted to the right, then
A) the supply of bananas increased.
B) the quantity of bananas supplied has increased.
C) the supply of bananas has decreases.
D) the quantity of bananas supplied has decreased.

4) Last month, the Tecumseh Corporation supplied 400 units of three-ring binders at $6 per unit. This
month, the company supplied the same quantity of binders at $4 per unit. Based on this evidence,
Tecumseh has experienced
A) a decrease in supply.
B) an increase in supply.
C) an increase in the quantity supplied.
D) a decrease in the quantity supplied.
5) ________ means the supply curve has shifted to the right, while ________ refers to a movement along
a given supply curve in response to an increase in price.
A) An increase in supply; a decrease in supply
B) A decrease in supply; an increase in supply
C) An increase in supply; an increase in quantity supplied
D) A decrease in supply; a decrease in quantity supplied
6) One would speak of a movement along a supply curve for a good, rather than a change in supply, if
A) the cost of producing the good changes.
B) supplier expectations about future prices change.
C) the price of the good changes.
D) prices of substitutes in production change.
7) Which of the following would cause an increase in the supply of cheese?
A) a decrease in the price of wine (assuming that cheese and wine are complements)
B) an increase in the price of cheese
C) an increase the price of a product that producers sell instead of cheese
D) an increase in the number of firms that produce cheese
8) In July, market analysts predict that the price of gold will rise in August. What happens in the gold
market in July, holding everything else constant?
A) The supply curve shifts to the right.
B) The supply curve shifts to the left.
C) The quantity demanded and the quantity supplied increase.
D) The demand curve shifts to the left.
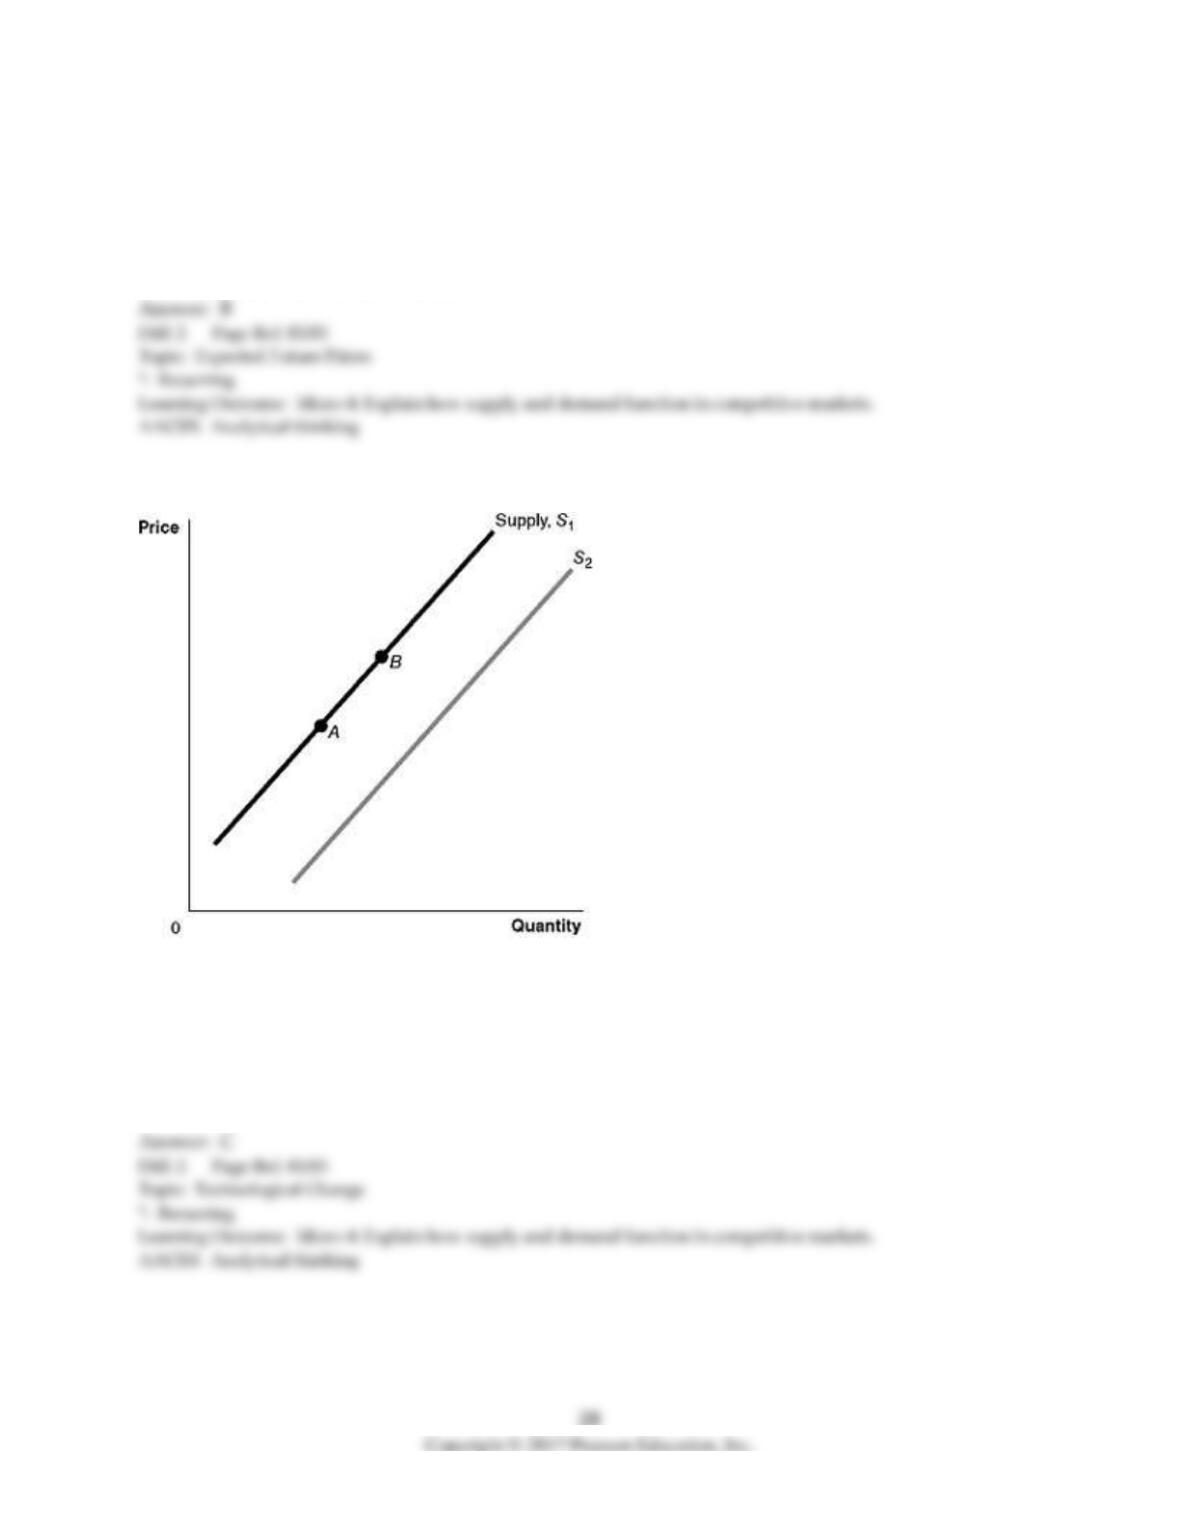
Figure 3-2
9) Refer to Figure 3-2. A technological advancement would be represented by a movement from
A) A to B.
B) B to A.
C) S1 to S2.
D) S2 to S1.
10) Refer to Figure 3-2. An increase in the expected future price of the product would be represented by
a movement from
A) A to B.
B) B to A.
C) S1 to S2.
D) S2 to S1.
11) Refer to Figure 3-2. A decrease in the price of inputs would be represented by a movement from
A) A to B.
B) B to A.
C) S1 to S2.
D) S2 to S1.
12) Refer to Figure 3-2. A decrease in the number of firms in the market would be represented by a
movement from
A) A to B.
B) B to A.
C) S1 to S2.
D) S2 to S1.
13) Refer to Figure 3-2. A decrease in the price of substitutes in production would be represented by a
movement from
A) A to B.
B) B to A.
C) S1 to S2.
D) S2 to S1.
14) Refer to Figure 3-2. An increase in the price of the product would be represented by a movement
from
A) A to B.
B) B to A.
C) S1 to S2.
D) S2 to S1.
15) If the United States lifts the embargo on Cuban products, what will happen in the U.S. market for
Cuban cigars?
A) The supply curve will shift to the left.
B) The supply curve will shift to the right.
C) The demand curve will shift to the right.
D) The demand curve will shift to the left.
16) George Gnat subscribes to a monthly pest control service for his home. Last week the owner of the
service informed George that he will have to raise his monthly service fee because of increases in the
price of gasoline used by his workers on their service trips. How is the market for pest control services
affected by this?
A) There is an increase in the supply of pest control services.
B) There is a decrease in the demand for pest control services.
C) There is a decrease in the quantity of pest control services supplied.
D) There is a decrease in the supply of pest control services.
17) The growing popularity of energy conservation has enticed large home improvement stores like
Home Depot and Lowes to offer tankless water heaters. How does the fact that home improvement
stores now offer these products affect the tankless water heater market?
A) The demand curve for tankless water heaters shifts to the right.
B) The demand curve for tankless water heaters shifts to the left.
C) The supply curve for tankless water heaters shifts to the right.
D) The supply curve for tankless water heaters shifts to the left.
18) Farmers can plant either corn or soybeans in their fields. Which of the following would cause the
supply of soybeans to increase?
A) an increase in the price of soybeans
B) a decrease in the price of corn
C) an increase in the demand for corn
D) an increase in the price of soybean seeds

19) Which of the following would shift the supply curve for energy drinks to the left?
A) a decrease in the expected future price of energy drinks
B) an increase in consumer income (assuming that energy drinks are normal goods)
C) a decrease in the number of firms that produce energy drinks
D) a decrease in the price of an input used to produce energy drinks
20) If a firm expects that the price of its product will be lower in the future than it is today
A) the firm has an incentive to increase supply now and decrease supply in the future.
B) the firm has an incentive to decrease supply now and increase supply in the future.
C) the firm has an incentive to increase quantity supplied now and decrease quantity supplied in the
future.
D) the firm will not change supply until it knows for certain what will happen to its price.
21) A firm has an incentive to decrease supply now and increase supply in the future if it expects that
A) more firms will enter the market in the future.
B) the prices of inputs used to produce the product will rise in the future.
C) the price of its product will be lower in the future than it is today.
D) the price of its product will be higher in the future than it is today.
22) The supply curve for umbrellas
A) shows the supply of umbrellas consumers are willing and able to buy at any given price.
B) is downward sloping.
C) shows the relationship between the quantity of umbrellas firms are willing and able to supply and
the quantity of umbrellas consumers are willing and able to purchase.
D) shows the relationship between the price of umbrellas and the quantity of umbrellas supplied.
23) An increase in the price of MP3 players will result in
A) a smaller quantity of MP3 players supplied.
B) a larger quantity of MP3 players supplied.
C) a decrease in the demand for MP3 players.
D) an increase in the supply of MP3 players.
24) Which of the following would cause a decrease in the supply of peanut butter?
A) a decrease in the price of jelly (assuming that peanut butter and jelly are complements)
B) a decrease in the price of peanut butter
C) an increase the price of peanuts
D) an increase in the technology used to produce peanut butter
25) In April, market analysts predict that the price of titanium will fall in May. What happens in the
titanium market in April, holding everything else constant?
A) The supply curve shifts to the right.
B) The supply curve shifts to the left.
C) The quantity demanded and the quantity supplied increase.
D) The demand curve shifts to the right.
26) The popularity of digital cameras has enticed large discount stores like Wal-Mart and Costco to offer
digital photo printing services. How does this affect the digital photo printing market?
A) The demand curve for digital photo printing services shifts to the right.
B) The demand curve for digital photo printing services shifts to the left.
C) The supply curve for digital photo printing services shifts to the right.
D) The supply curve for digital photo printing services shifts to the left.
27) Farmers can raise either goats or ostriches on their land. Which of the following would cause the
supply of goats to decrease?
A) an increase in the price of ostriches
B) a decrease in the price of goats
C) an increase in the demand for goats
D) an increase in the price of ostrich feed
28) Which of the following would shift the supply curve for smartphones to the right?
A) an increase in the price of a substitute in production
B) an increase in consumer income (assuming that all smartphones are normal goods)
C) a decrease in the number of firms that produce smartphones
D) a decrease in the price of an input used to produce smartphones
29) A decrease in the price of pork will result in
A) a smaller quantity of pork supplied.
B) a larger quantity of pork supplied.
C) a decrease in the demand for pork.
D) an increase in the supply of pork.
30) A decrease in the number of firms in a market will cause supply to increase.
31) A change in quantity supplied is represented by a movement along the supply curve.
32) An decrease in supply is caused by a decrease in the price of the product.
33) If the price of a product is expected to increase in the future, the supply today will increase.
34) A positive technological change will cause the quantity of a good supplied to increase.
35) An increase in quantity supplied is represented by a rightward shift of the supply curve.
36) A decrease in the price of inputs will cause the supply curve for a product to shift to the right.
37) All else equal, as the price of a product falls, the quantity supplied decreases.
38) What are the five most important variables that shift the market supply curve?
39) Would a change in the price of in-line skates cause a change in the supply of in-line skates? Why or
why not?
40) Indicate whether each of the following situations would shift the supply curve to the left, to the
right, or not at all.
a. An increase in the price of an input
b. An increase in productivity
c. An increase in the price of a substitute in production
d. A decrease in the expected future price of a product
e. A decrease in the current price of the product
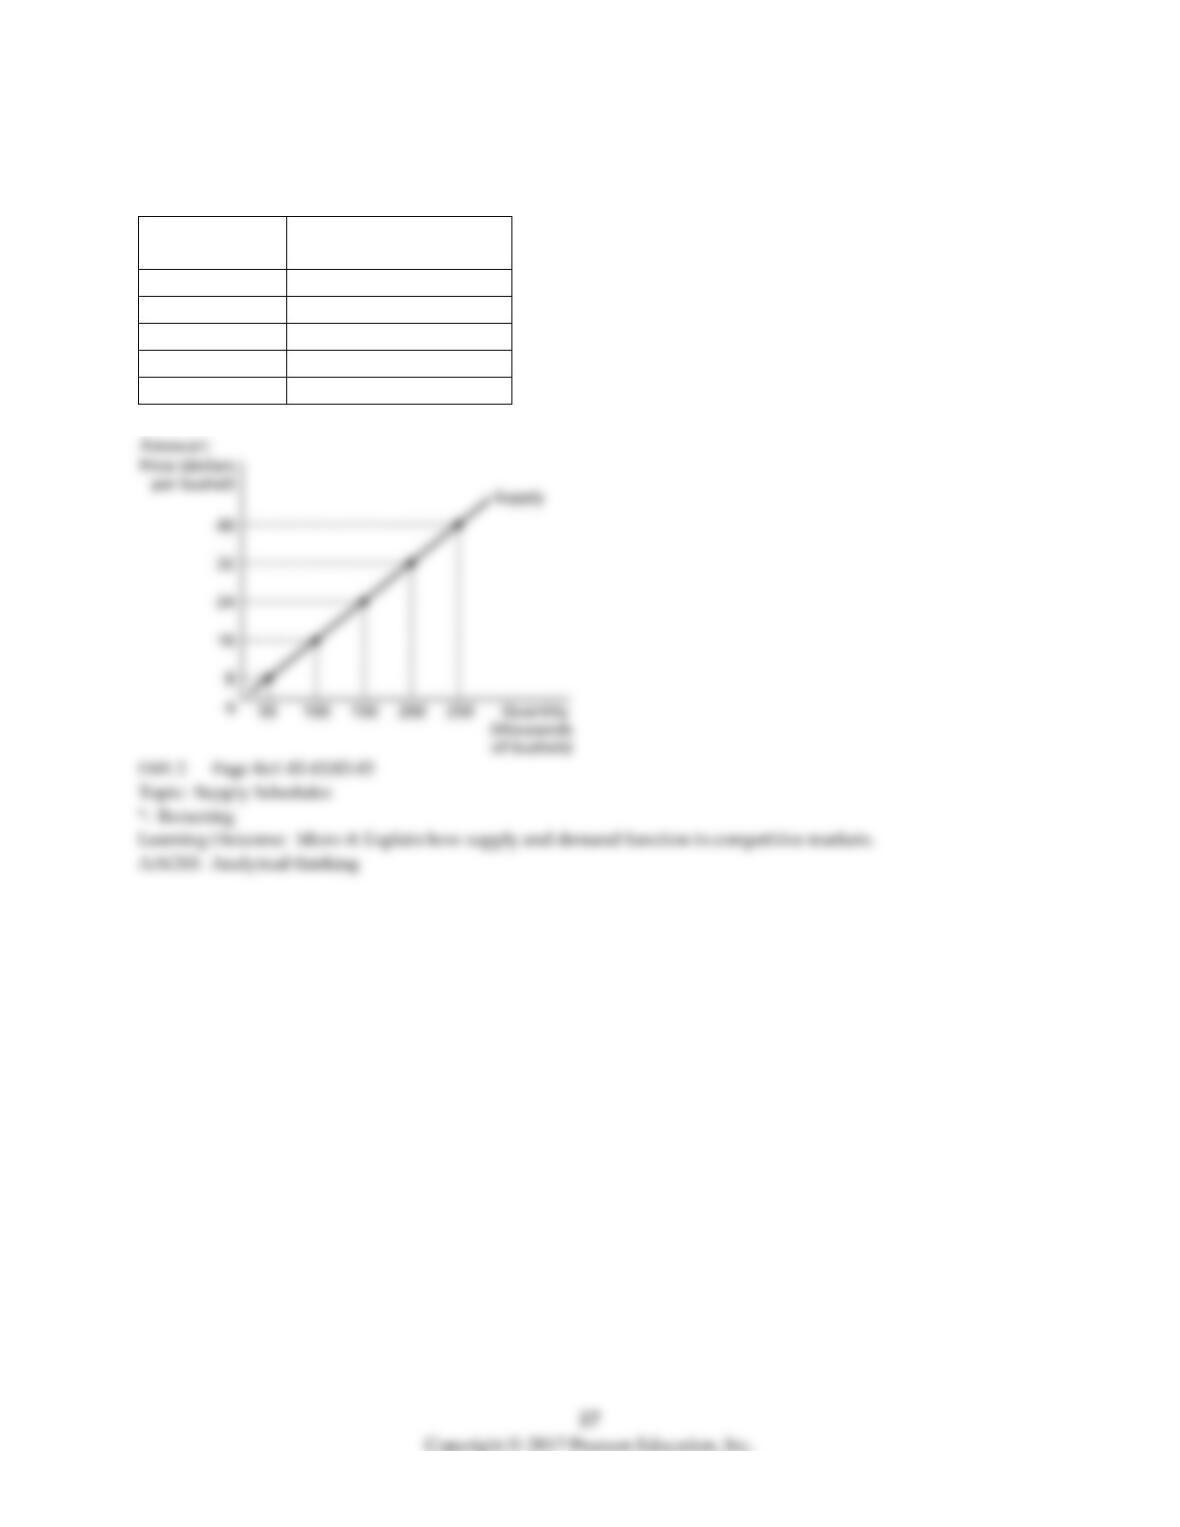
41) Use the following supply schedule for cherries to draw a graph of the supply curve. Be sure to label
the supply curve and each axis, and show each point on the supply curve.
Price (dollars
per bushel)
Quantity (thousands of
bushels)
8
50
16
100
24
150
32
200
40
250
38
3.3 Market Equilibrium: Putting Demand and Supply Together
1) At market equilibrium,
A) demand equals supply.
B) quantity demanded equals quantity supplied.
C) surpluses are greater than shortages.
D) shortages are greater than surpluses.
2) At a product’s equilibrium price
A) anyone who needs the product will be able to buy the product, regardless of ability to pay.
B) the federal government will provide the product to anyone who cannot afford it.
C) not all sellers who are willing to accept the price will find buyers for their products.
D) any buyer who is willing and able to pay the price will find a seller for the product.
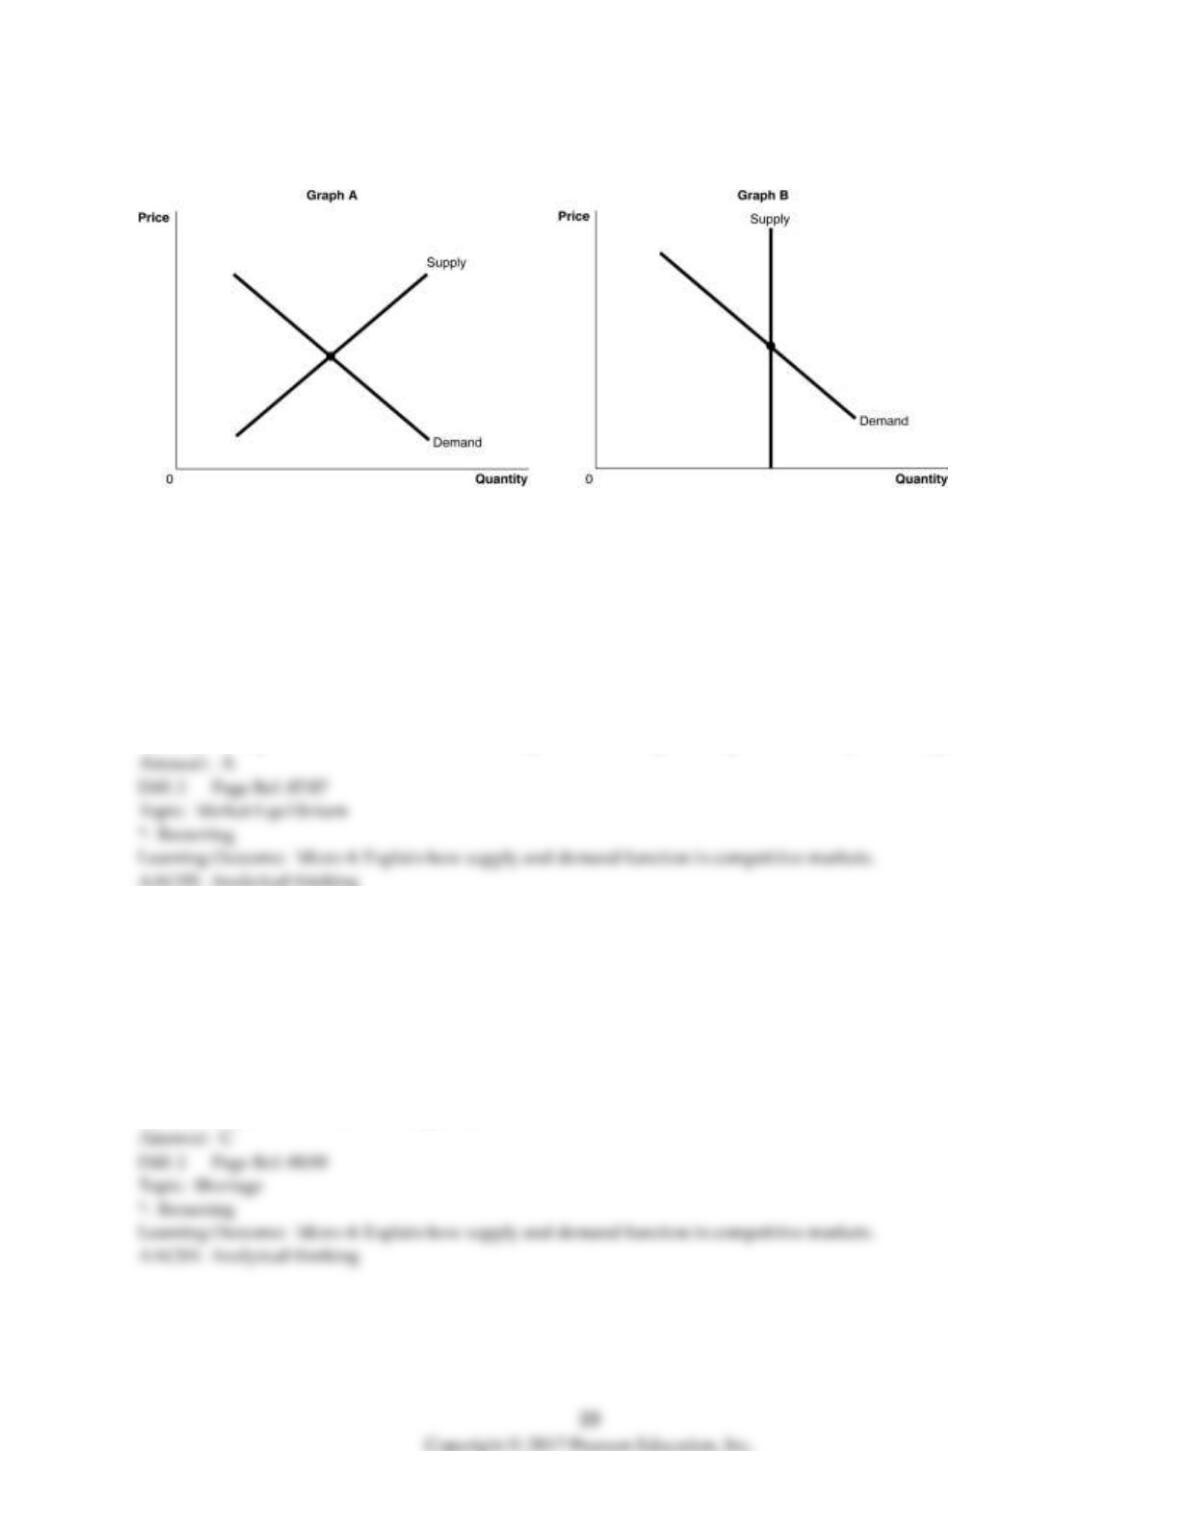
Figure 3-3
3) Refer to Figure 3-3. The figure above shows the supply and demand curves for two markets: the
market for original Michelangelo sculptures and the market for Ray Ban sunglasses. Which graph most
likely represents which market?
A) Graph B represents the market for original Michelangelo sculptures and Graph A represents the
market for Ray Ban sunglasses.
B) Graph A represents the market for original Michelangelo sculptures and Graph B represents the
market for Ray Ban sunglasses.
C) Graph A represents both the market for original Michelangelo sculptures and Ray Ban sunglasses.
D) Graph B represents both the market for original Michelangelo sculptures and Ray Ban sunglasses.
4) Hurricane Katrina damaged a large portion of refining and pipeline capacity when it swept through
the Gulf coast states in August 2005. As a result of this, many gasoline distributors were not able to
maintain normal deliveries. At the pre-hurricane equilibrium price (i.e., at the initial equilibrium price),
we would expect to see
A) a surplus of gasoline.
B) the quantity demanded equal to the quantity supplied.
C) a shortage of gasoline.
D) an increase in the demand for gasoline.
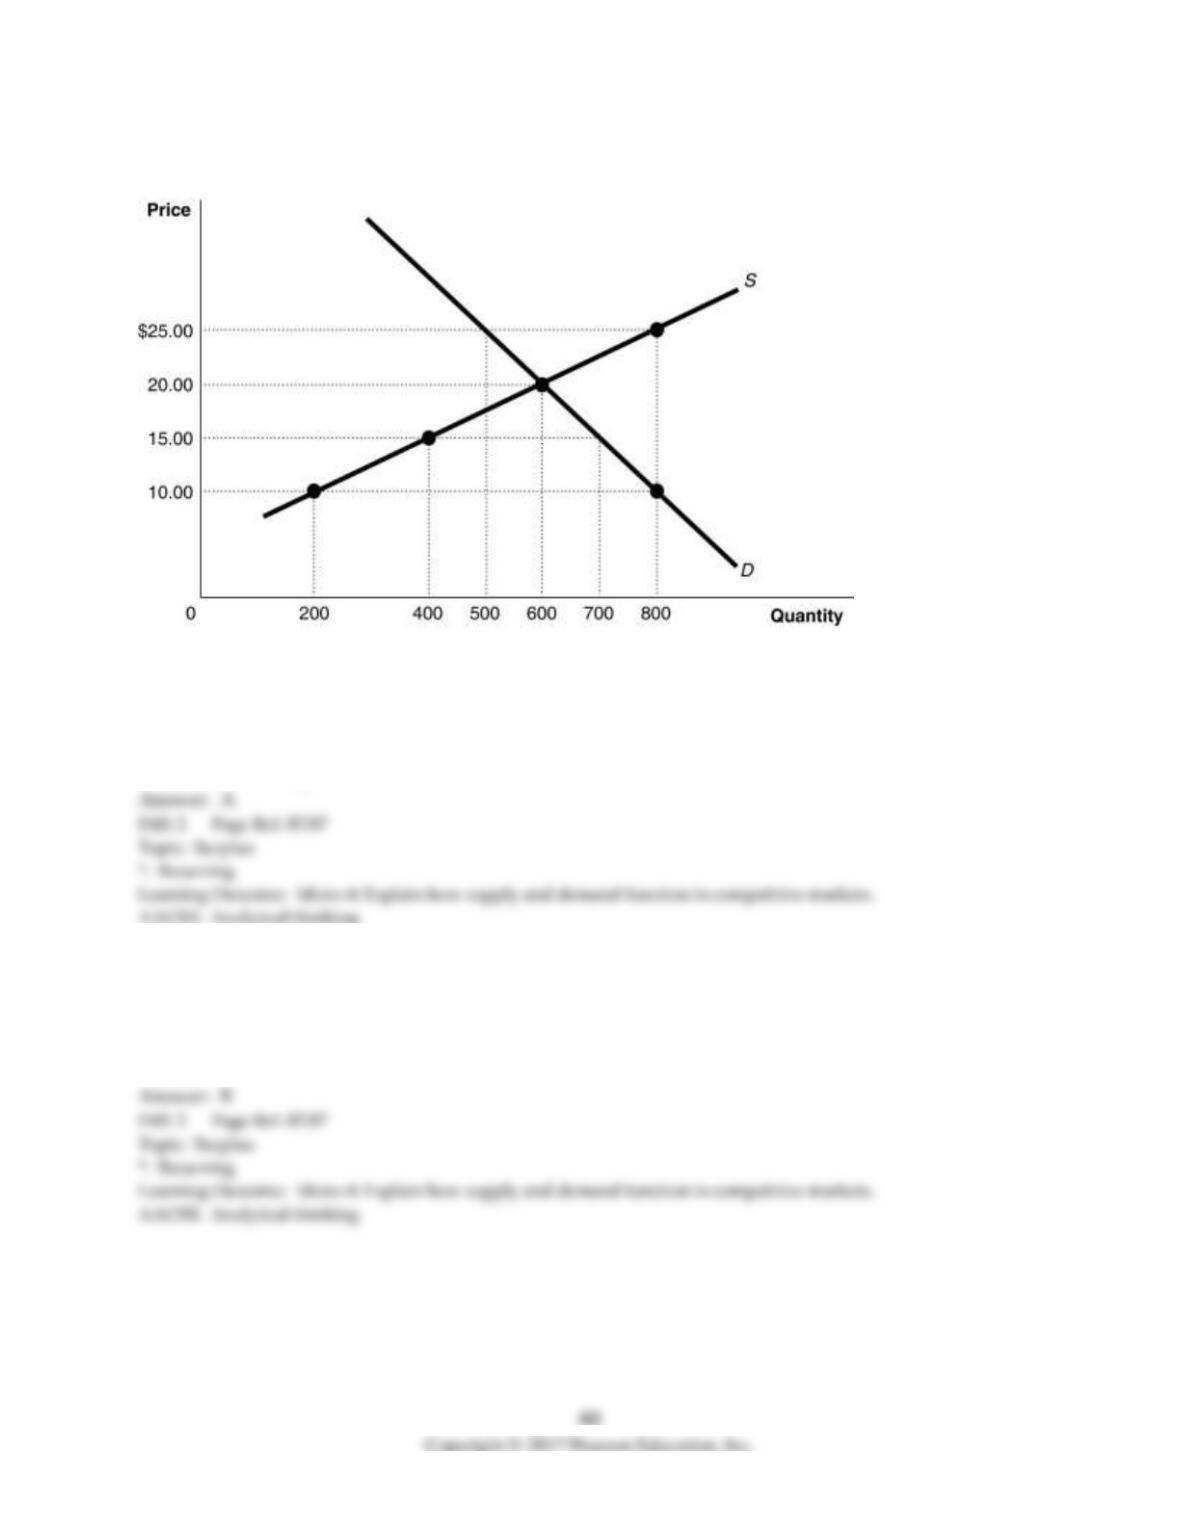
Figure 3-4
5) Refer to Figure 3-4. If the price is $25,
A) there is a surplus of 300 units.
B) there is a shortage of 300 units.
C) there is a surplus of 200 units.
D) there is a shortage of 200 units.
6) Refer to Figure 3-4. At a price of $25, how many units will be sold?
A) 400
B) 500
C) 600
D) 800