22
Barro
Chapter 3
TRUE/FALSE
1. The standard of living of people in a country is their per capita income.
2. Diminishing returns to labor implies that eventually the marginal product of labor will become
negative.
3. The marginal product of capital is how much output changes when capital increases by one unit.
4. Saving is income that is not consumed.
5. Real saving equals gross investment.
6. Data show that, from 1960 to 2000, the U.S. and other OECD countries grew at moderate rates.
7. Data from recent decades show that most countries in sub-Saharan Africa grew at a fast pace.
8. In a production function for the economy, the marginal product of capital typically is increasing.
9. Constant returns to scale in a production function imply that doubling both capital and labor will also
double output.
10. The Solow growth model indicates that the growth rate of real GDP per worker depends partly on the
saving rate.
MULTIPLE CHOICE
1. World growth data shows that from 1960 to 2000:
23
a.
the US and other OECD countries grew at
moderate rates.
c.
some countries particularly East Asian
countries grew rapidly.
b.
sub-Saharan African countries grew at
low rates or declined.
d.
all of the above.
2. World growth data reveals that from 1960 to 2000:
a.
the US and other OECD countries grew at
moderate rates.
c.
some countries particularly East Asian
countries grew a low rates or declined.
b.
sub-Saharan African countries grew
rapidly.
d.
all of the above.
3. World growth data reveals that from 1960 to 2000:
a.
the US and other OECD countries
stagnated.
c.
some countries particularly East Asian
countries grew at low or negative rates.
b.
sub-Saharan African countries grew at low
or negative rates.
d.
all of the above.
4. World growth data reveals that from 1960 to 2000:
a.
all countries grew at similar rates.
c.
some countries particularly East Asian
countries grew rapidly.
b.
sub-Saharan African countries grew
moderately.
d.
the US and other OECD countries
stagnated.
5. The US and other OECD countries had high levels of GDP per person in 2000 despite growing at a
moderate rate from 1960 to 2000 because:
a.
of exploitation of foreign countries.
c.
they stole the wealth of less developed
countries.
b.
their economies had grown at a moderate
rate for a century or more.
d.
all of the above.
6. If A in the production function Y = A • F(K,L) rises, then:
a.
output rises for any level of K and L.
c.
the marginal product of capital rises.
b.
the marginal product of labor rises.
d.
all of the above.
7. If A in the production function Y = A • F(K,L) doubles, while K and L remain the same, then
a.
output doubles.
c.
the marginal product of capital falls.
b.
the marginal product of labor falls.
d.
output increases by less than double.
8. A in the production function Y = A • F(K,L) is:
a.
the marginal product of labor.
c.
the marginal product of capital.
b.
the capital to labor ratio (K/L).
d.
the level of technology.
9. The marginal product of labor is:
a.
how much output rises for when labor
increases one unit.
c.
labor divided by capital (L/K)
b.
capital divided by labor (K/L).
d.
the level of technology.
10. The marginal product of capital is:
a.
.
c.
the slope of the production when
technology and labor are held constant.
b.
the change in output for a unit change in
capital.
d.
all of the above.
11. Diminishing marginal product of capital (MPK) means:
a.
output rises as capital rises.
c.
output rises as the MPK rises.
b.
the MPK eventually falls as capital rises.
d.
the marginal product of capital eventually
becomes negative as capital rises.
12. In the production function Y = A • F(K,L), L is:
a.
leisure.
c.
the marginal product of labor.
b.
labor.
d.
the marginal product of leisure.
13. In the production function Y = A • F(K,L), Y is:
a.
good Y.
c.
the marginal product of good Y.
b.
production.
d.
constant returns to scale.
14. Among the assumptions made about the production function Y = A • (K,L) is:
a.
diminishing marginal product of labor.
c.
diminishing marginal product of capital.
b.
constant returns to scale.
d.
all of the above.
15. For the production function Y = A • F(K,L) constant returns to scale means:
a.
if capital and labor double output doubles.
c.
the marginal products of capital and labor
are constant.
b.
capital and labor increase at a constant
rate.
d.
technology is constant.
16. If the production function Y = A • (K,L) is divided by L, then
a.
(Y/L) = A•f(K/L).
c.
y = A•f(k).
b.
output per capita equals technology times
a function of the capital labor ratio.
d.
all of the above.
25
17. Among the categories the growth rate is broken down into by growth accounting is:
a.
the growth rate of technology.
c.
the capital labor ratio.
b.
the marginal product of capital.
d.
all of the above.
18. Growth accounting shows that GDP growth depends on:
a.
growth of the capital stock.
c.
government purchases.
b.
holding environmental pollution in check.
d.
having a reasonable distribution of
income.
19. Growth accounting shows that economic growth depends on:
a.
government tax receipts.
c.
lowering environmental pollution.
b.
the growth of the labor force.
d.
all of the above.
20. Growth accounting shows that economic growth depends on:
a.
controlling environmental pollution.
c.
increases in technology.
b.
international cooperation.
d.
all of the above.
21. Growth accounting shows that economic growth depends on:
a.
increases in technology.
c.
growth in the capital stock.
b.
the growth of the labor force.
d.
all of the above.
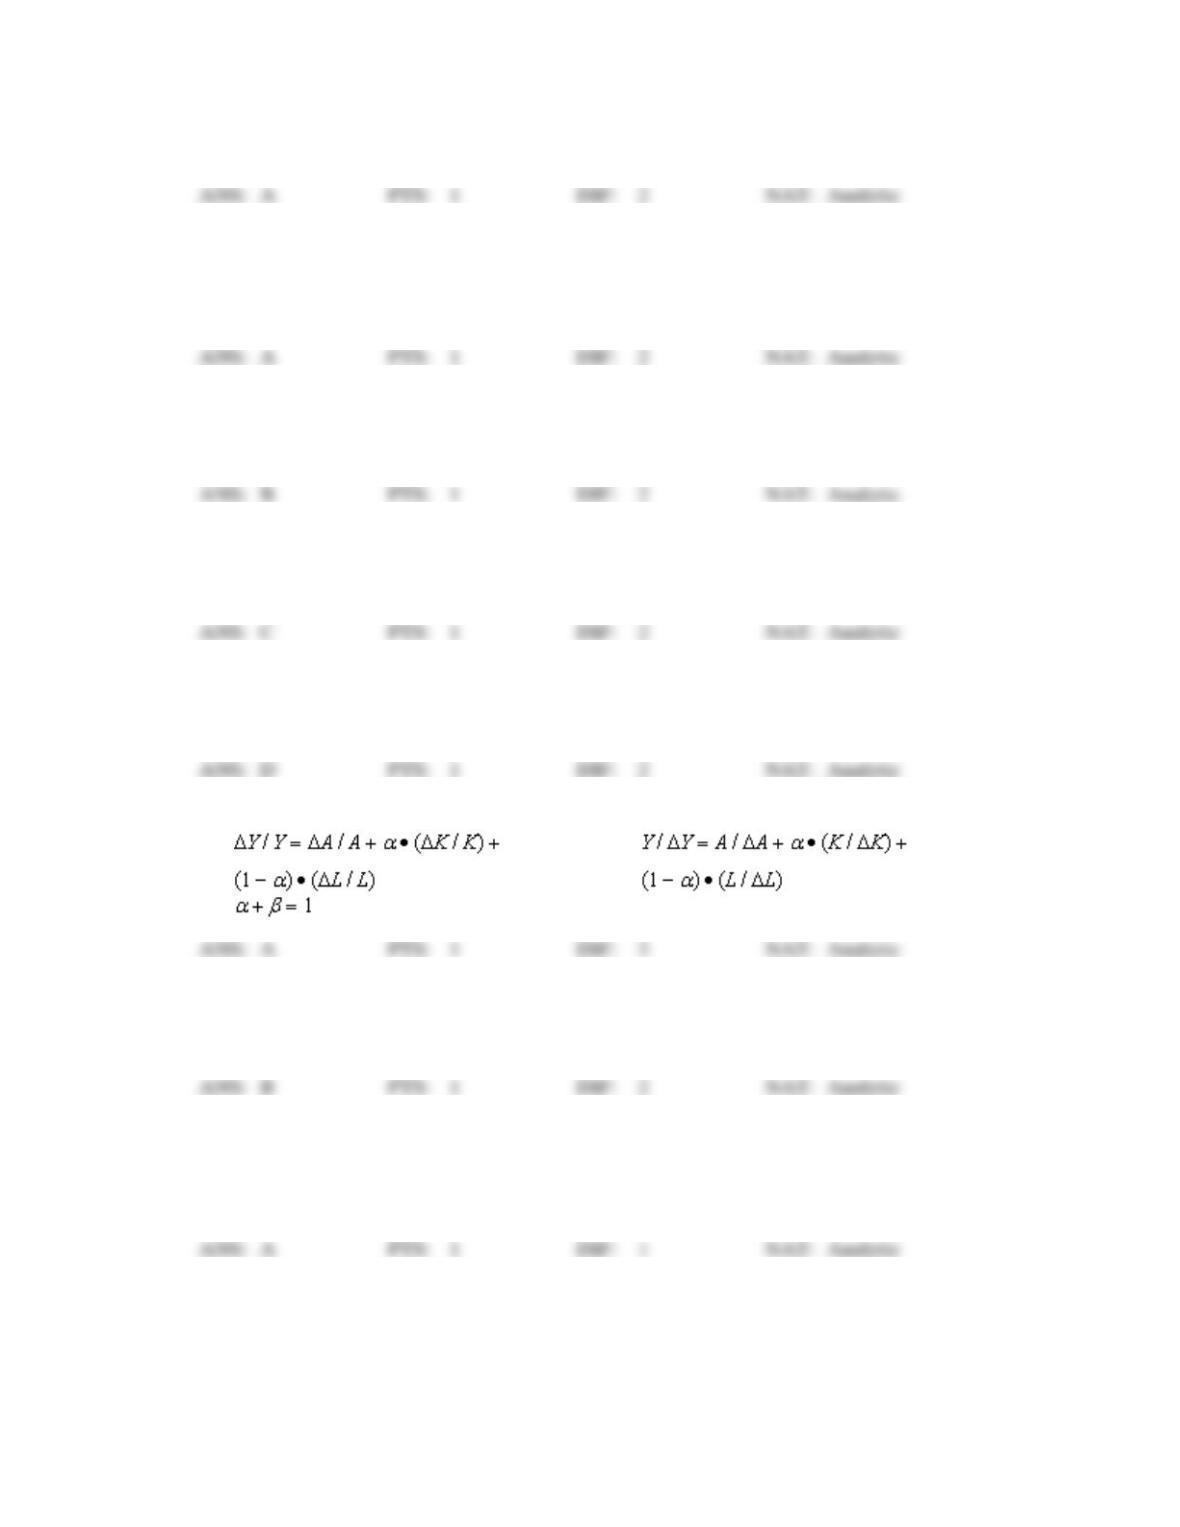
22. The growth accounting formula is:
a.
c.
b.
d.
Y= A • F(K,L)
23. The labor force participation rate is:
a.
the labor force divided into population.
c.
the labor force times population.
b.
the labor force divide by population.
d.
the labor population minus the labor force.
24. If a country has a population of 100 million and a labor force of 60 million, then its labor force
participation rate is:
a.
0.6.
c.
40 million.
b.
1.67
d.
60 million.
25. If a country has a population of 300 million and a labor force of 200 million, then its labor force
participation rate is:
a.
0.67
c.
100 million.
b.
1.5
d.
200 million.
26. The change in the capital stock in an economy depends on:
a.
the economy’s saving.
c.
the economy’s investment.
b.
the change in bond prices.
d.
all of the above.
27. In a closed economy with no government sector, the change in the capital stock is:
a.
net investment less depreciation.
c.
gross investment.
b.
gross investment less depreciation.
d.
nominal saving.
28. In a closed economy with no government sector, the change in the capital stock is equal to:
a.
net investment less depreciation.
c.
gross investment.
b.
nominal saving.
d.
real saving.
29. Depreciation of the capital stock occurs due to:
a.
machines deteriorating.
c.
bonds falling in value.
b.
real estate rising in value.
d.
all of the above.
30. Depreciation of the capital stock occurs due to:
a.
inflation.
c.
bonds falling in value.
b.
buildings needing repair.
d.
all of the above.
31. Depreciation of the capital stock occurs due to:
a.
deflation.
c.
bonds falling in value.
b.
vehicles requiring new parts.
d.
all of the above.
32. Depreciation of the capital stock occurs due to:
a.
machines deteriorating.
c.
buildings needing repair.
b.
vehicles needing parts.
d.
all of the above.
33. If there are 120 machines in an economy and the depreciation rate is 5% per year, then:
a.
depreciation is 5 machines a year.
c.
depreciation is 115 machines per year.
b.
depreciation is 6 machines a year.
d.
depreciation is 114 machines per year.
34. If there are 120 machines in an economy and the depreciation rate is 10% per year, then next year there
are:
a.
10 of the original machines left.
c.
108 of the original machines left.
b.
12 of the original machines left.
d.
110 of the original machines left.
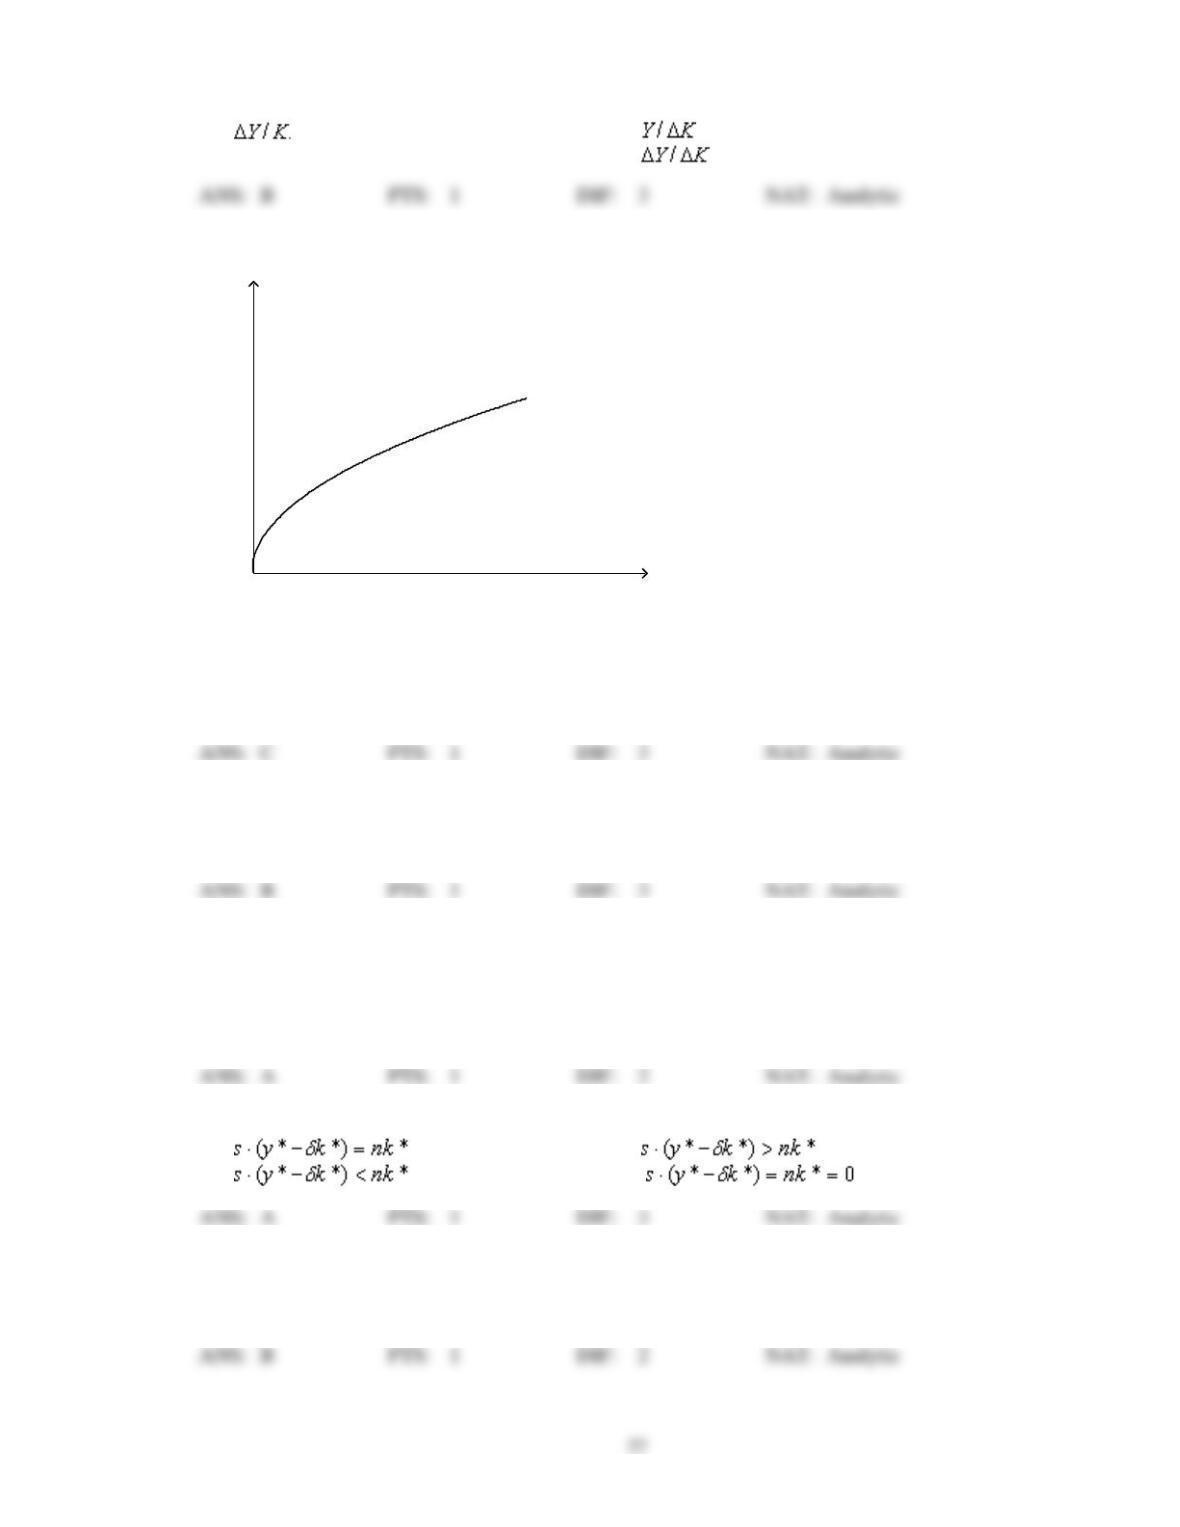
35. The average product of capital is:
a.
c.
.
b.
Y/K.
d.
.
Figure 3.1
A = F(K,L)
Capital
Output
36. In Figure 3.1 the average product of capital is:
a.
rising.
c.
falling.
b.
constant.
d.
unknown.
37. In Figure 3.1 the marginal product of capital is:
a.
rising.
c.
constant.
b.
declining.
d.
unknown.
38. Figure 3.1 shows:
a.
a production function with labor and
technology constant.
c.
a production function with capital and
technology constant.
b.
a production function with capital and
labor constant.
d.
a production function with capital, labor
and technology constant.
39. In the steady state of the Solow growth model:
a.
c.
b.
d.
40. In the Solow growth model the economy reaches the optimal k*:
a.
immediately.
c.
randomly.
b.
over a period of time.
d.
cyclically.
28
41. The Solow growth model assumes unemployment is:
a.
zero.
c.
rising.
b.
falling.
d.
constant.
42. The Solow growth model ignores:
a.
the international sector.
c.
changes in labor force participation.
b.
the role of government.
d.
all of the above.
43. The Solow growth model shows that the growth rate of real GDP per worker depends on:
a.
the saving rate, s
c.
the depreciation rate, .
b.
the growth rate of the labor force, n.
d.
all of the above.
44. The Solow growth model shows that the growth rate of real GDP per worker depends on:
a.
the saving rate, s
c.
the rate of inflation.
b.
government spending, G.
d.
all of the above.
45. The Solow growth model shows that the growth rate of real GDP per worker depends on:
a.
the rate of growth of the money supply.
c.
rate of growth of government debt.
b.
the growth rate of the labor force, n.
d.
all of the above.
46. The Solow growth model shows that the growth rate of real GDP per worker depends on:
a.
the rate of growth of the money supply.
c.
the depreciation rate, .
b.
level of output in the economy.
d.
all of the above.
47. In the Solow growth model the optimal capital to labor ratio, K/L, is where:
a.
s + n = s•(k/y).
c.
n + s = s•(y/k).
b.
s + n = s•(y/k).
d.
s + s = n•(y/k).
48. In the Solow growth model the steady state is when the economy has:
a.
full employment.
c.
zero inflation.
b.
the optimal capital labor ratio, k*.
d.
all of the above.
49. During the transition to the steady state in the Solow growth model:
a.
the output per worker rises.
c.
the rate of growth of capital rises.
b.
labor force participation rises.
d.
all of the above.
50. During the transition to the steady state in the Solow growth model:
a.
the output per worker falls.
c.
the rate of growth of capital falls.

b.
labor force participation rises.
d.
all of the above.
51. During the transition to the steady state in the Solow growth model:
a.
the output per worker rises.
c.
the rate of growth of capital falls.
b.
the capital to labor ratio rises.
d.
all of the above.
52. The Solow residual is:
a.
that part of output growth not attributed to
labor force growth.
c.
that part of output growth not attributed to
capital stock growth and labor force
growth.
b.
that part of output growth not attributed to
capital stock growth.
d.
the growth in output.
53. The Solow residual is that part of output growth attributed to:
a.
the growth rate of the labor force.
c.
the growth rate of the capital stock.
b.
the growth rate of output.
d.
the grow rate of technology.
54. The Solow residual:
a.
is not directly observable.
c.
is attributed to capital stock growth.
b.
attributed to labor force growth.
d.
is attributed to labor force growth and
capital stock growth.
55. Economists use the term poverty to identify people who
a.
earn less than $5,000 per year.
c.
have no access to the internet at home.
b.
earn less than $6,000 per year.
d.
have difficulty affording food and shelter.
56. In economics, the term inequality describes
a.
the same thing as poverty.
c.
an unequal representation in the U.N.
b.
an unequal distribution of income.
d.
disparity among countries’ voting rights.
57. Data from recent decades show that economic growth led to
a.
a worldwide increase in poverty.
c.
an increase in poverty in OECD countries
only.
b.
no signficant change in poverty.
d.
a worldwide decline in poverty.
58. Data from recent decades show that economic growth led to
a.
a worldwide increase in inequality.
c.
an decrease in inequality in China only.
b.
no signficant change in inequality.
d.
a worldwide decrease in inequality.
30
59. The world distribution of real GDP per person in 2000 shows that
a.
OECD countries dominate the bottom of
the distribution.
c.
sub-Saharan African countries dominate
the bottom of the distribution.
b.
OECD countries dominate the top of the
distribution.
d.
both (b) and (c).
60. The world distribution of real GDP per person in 2000 shows that
a.
OECD countries dominate the bottom of
the distribution.
c.
sub-Saharan African countries dominate
the top of the distribution.
b.
OECD countries dominate the top of the
distribution.
d.
both (b) and (c).
61. The slope of a production function in terms of capital, holding technology and labor fixed, usually
a.
increases with increases in capital.
c.
decreases with increases in capital.
b.
remains constant with increases in capital.
d.
either (a) or (b).
62. The slope of a production function in terms of labor, holding technology and capital fixed, usually
a.
decreases with increases in labor.
c.
increases with increases in labor.
b.
remains constant with increases in labor.
d.
either (a) or (b).
63. A bakery with a production function exhibiting constant returns to scale has 2 mixers and 4 workers,
who produce 10 cakes per day. If the bakery owner adds 2 more mixers and 4 more workers, then
production would most likely
a.
increase by 10 cakes per day.
c.
decrease by 2 cakes per day.
b.
increase by 40 cakes per day.
d.
increase by 60 cakes per day.
64. In the Solow model, the growth rate of the capital stock is a function of
a.
the saving rate and the depreciation rate.
c.
the labor force participation rate and the
technology growth rate.
b.
the saving rate and the labor force
participation rate.
d.
the depreciation rate and the labor force
participation rate.
65. In the Solow model, the growth rate of the labor is a function of
a.
the saving rate and the growth rate of the
population.
c.
the labor force participation rate and the
health technology growth rate.
b.
the saving rate and the labor force
participation rate.
d.
the growth rate of the population.
66. In the Solow growth model, the average product of capital
a.
increases as capital per worker rises.
c.
declines as capital per worker rises.
b.
remains constant as capital per worker
rises.
d.
declines, then rises, as capital per worker
rises.
67. In the steady state for the Solow growth model,
a.
the labor per technology unit ratio
increases.
c.
the capital per worker ratio increases.
b.
the labor per technology unit ratio no
longer moves.
d.
the capital per worker ratio no longer
moves.
68. In the steady state for the Solow growth model, the saving per worker
a.
is greater than the capital provided for
each new worker.
c.
is equal to the depreciation rate per
worker.
b.
is equal to the capital provided for each
new worker.
d.
is greater than the depreciation rate per
worker.
SHORT ANSWER
1. What is a production function?
2. What do constant returns to scale imply?
3. What is the growth account formula and what does it tell us?
4. Show why real saving equals net investment.
5. What is the key equation of the Solow growth model and what does it say to us?