Chapter 3 Demand and Supply 269
39) Which of the following is a non price determinant of supply?
A) the price of related goods consumers may buy
B) technological advances in production
C) consumers incomes
D) the number of consumers
40) The supply curve will shift to the left when
A) the supply of the product increases. B) the demand for the product decreases.
C) some producers leave the industry. D) the product becomes fashionable.
41) When the price of a good rises, there is
A) an increase in supply. B) a decrease in supply.
C) a decrease in quantity supplied. D) an increase in quantity supplied.
42) Which of the following would likely cause an increase in the supply of espresso coffee makers?
A) an increase in the number of business firms demanding espresso makers
B) an increase in the price of espresso makers
C) an increase in the cost of manufacturing espresso makers
D) a widespread expectation that the price of espresso makers will fall in the future
43) Which of the following will NOT cause a rightward shift in the supply curve?
A) an improvement in technology B) a reduction in resource costs
C) a reduction in the expected future price D) none of the above
44) When producers anticipate that the price of their product will increase in the future,
A) the supply curve will shift to the right.
B) the supply curve will shift to the left.
C) the current production will move along on the supply curve.
D) they will immediately lobby Congress to adjust prices now.
45) The imposition of a per unit tax on a product
A) will cause the supply curve to shift downward and to the right.
B) will cause the supply curve to shift upward and to the left.
C) will reduce the quantity supplied of the product.
D) will encourage producers to increase the quantity supplied of the product.
46) Which of the following will NOT cause market supply to increase?
A) an increase in the number of firms supplying the product in the market
B) a change in technology which allows a larger level of production at every price
C) an increase in the costs of resources used to produce the product
D) a decrease in labor costs
47) Which of the following would cause an increase in the market supply of mountain bikes?
A) a decrease in the demand for mountain bikes
B) an increase in taxes levied on mountain bike manufacturers
C) an increase in the cost of components used to assemble mountain bikes
D) an increase in the number of firms making mountain bikes
48) Which one of the following would cause an increase in the supply of cardboard?
A) a decrease in the demand for cardboard
B) an increase in the price of cardboard
C) an increase in taxes applied to cardboard producers
D) an improvement in the technology used to produce cardboard
49) Which of the following will shift the supply curve for laptop computers to the left?
A) development of a cheaper microchip used in laptop computer production
B) a subsidy to the laptop computer industry
C) expectations of a future decline in laptop computer prices
D) a reduction of the number of firms that make laptop computers
50) Which of the following will cause a movement along the supply curve for oil?
A) new technology to drill oil underwater in the Gulf of Mexico
B) a change in the price of oil
C) an increase in the number of oil producing firms
D) government subsidies to oil producers in Wyoming
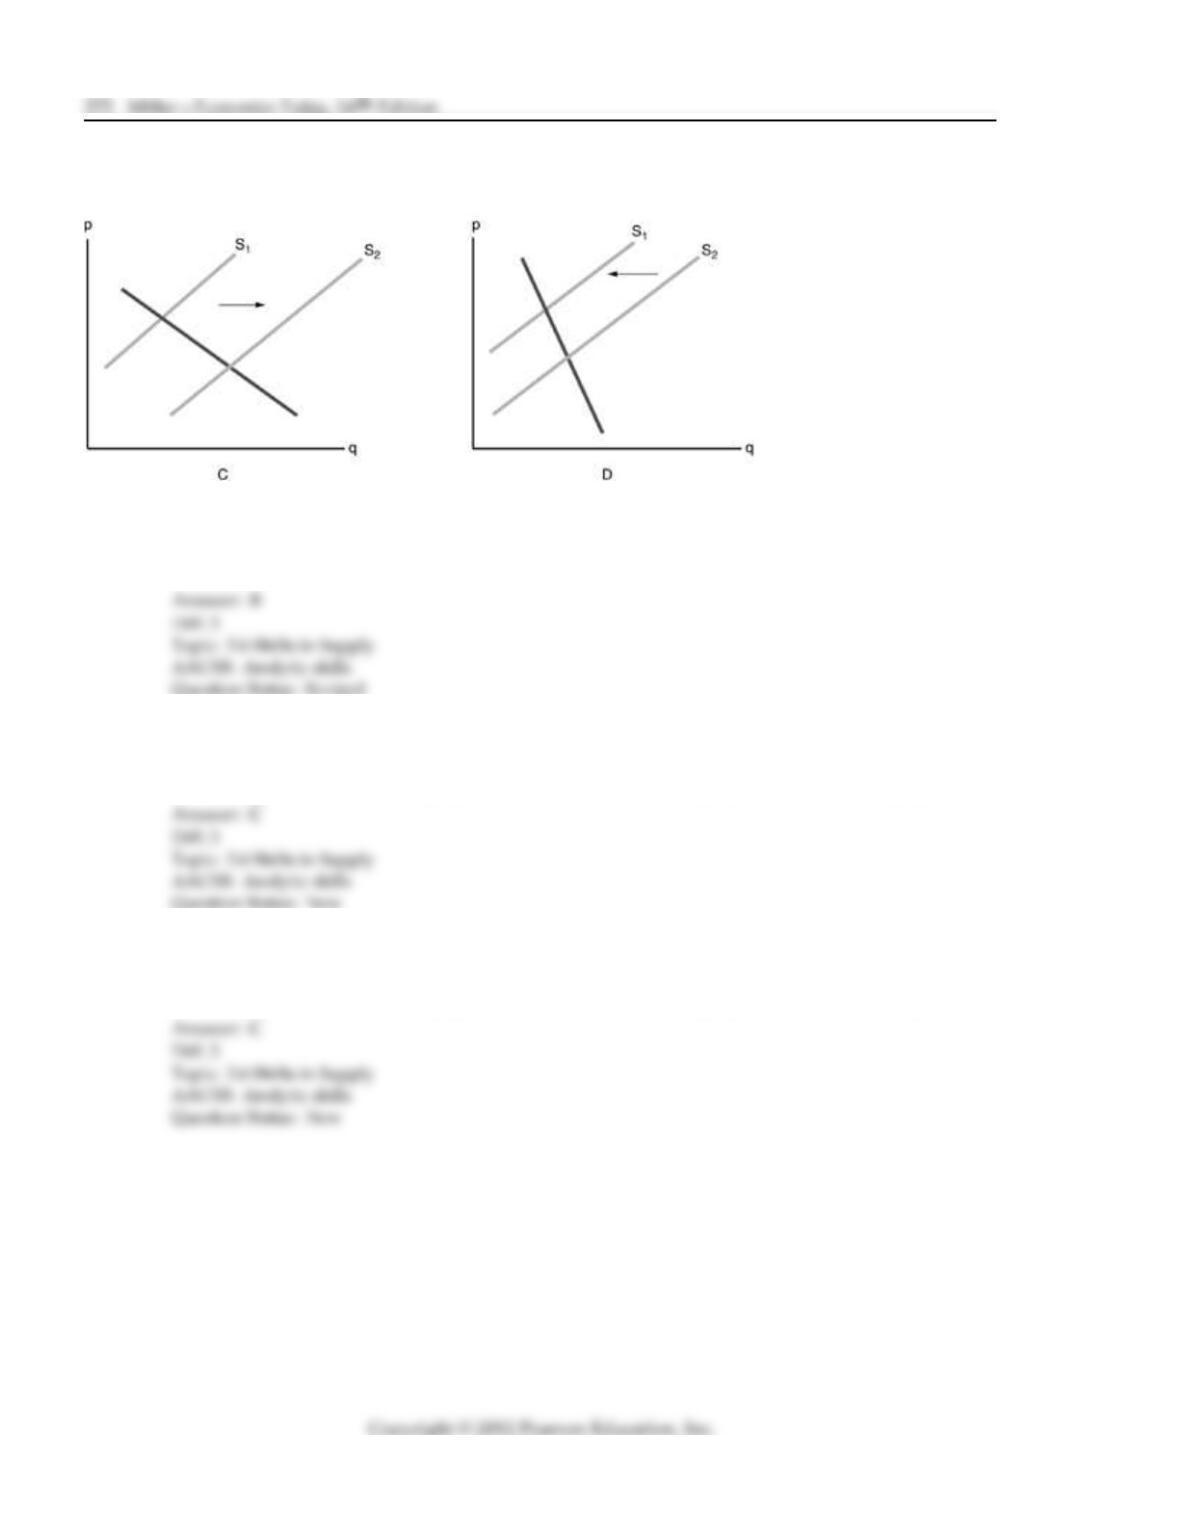
51) Refer to the above figure. Corn is an input for producing Corn Flakes. Which diagram shows the
effect on the supply of Corn Flakes when the price of corn has increased?
A) graph C B) graph D C) neither graph D)
b
oth graphs
52) Refer to the above figure. Which diagram shows the effect on the market of Corn Flakes when
the demand for Corn Flakes has increased?
A) graph C B) graph D C) neither graph D)
b
oth graphs
53) Refer to the above figure. Which diagram shows the effect on the market of Corn Flakes when
the price of Corn Flakes has increased?
A) graph C B) graph D C) neither graph D)
b
oth graphs
54) If one day a terrible disease were to wipe out over one half of the world s lime trees, which of
the following would likely result?
A) The supply curve of lime juice would shift downward and to the right.
B) The supply curve of lime juice would shift upward and to the left.
C) The demand curve for lime juice would shift to the right.
D) The demand curve for lime juice would shift to the left.
55) Suppose the price of cement goes up in the United States. What happens in the market for new
homes?
A) Supply shifts upward and to the left.
B) Demand shifts left.
C) Supply shifts downward and to the right.
D) Demand shifts to the right.
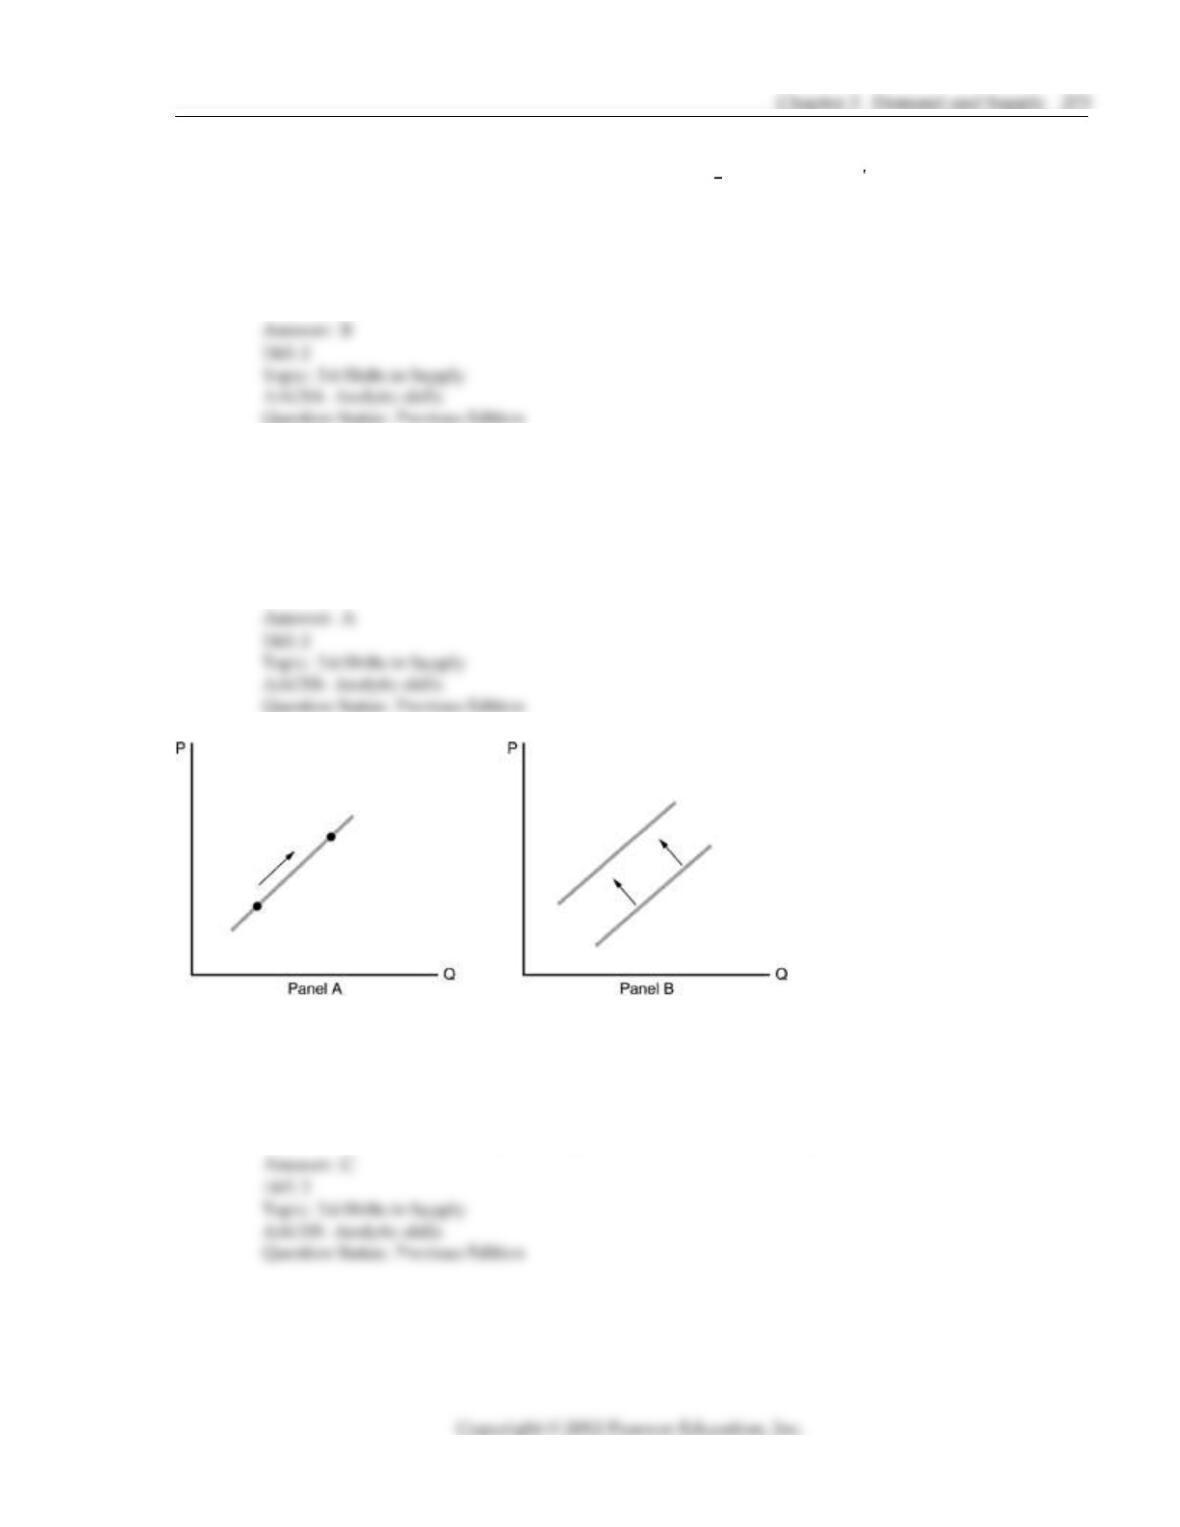
56) Refer to the above figure. Which of the following statements is true?
A) Panel A shows an increase in supply and Panel B shows a decrease in supply.
B) Both Panels A and B show an increase in supply.
C) Panel A shows a change in quantity supplied and Panel B shows a change in supply.
D) Panel A shows a change in supply and Panel B shows a change in quantity supplied.
57) If there is a decline in the price of milk, an input in the production of ice cream, then there will
be a(n)
A) decrease in the supply of ice cream and a leftward shift of the supply curve.
B) decrease in the quantity of ice cream supplied and a movement up along the supply curve.
C) increase in the supply of ice cream and a rightward shift of the supply curve.
D) increase in the quantity of ice cream supplied and a movement down along the supply
curve.
58) Which of the following will NOT affect the position of the market supply curve for a good?
A) The government grants a subsidy to the producers for each unit of a good that they
produce.
B) The price of the good increases.
C) The number of sellers in the market increases.
D) There is an increase in the prices of the inputs used in production.
59) When the amount supplied is greater at each price, there is a(n)
A) rightward shift in the supply curve.
B) leftward shift in the supply curve.
C) upward movement along the supply curve.
D) downward movement along the supply curve.
60) In order to increase the supply of a good, producers must
A) convince consumers to reduce the quantity demanded.
B) see an increase in quantity supplied by competitors.
C) reduce their per unit costs of producing the good.
D) cut back on labor to reduce production costs.
61) How is the market supply curve found? In what ways is the process similar to the way the
market demand curve is determined? In what ways are they different?
62) Distinguish between a change in quantity supplied and a change in supply.
63) Briefly discuss the determinants of supply other than price.
276 Miller Economics Today, 16th Edition
3.7 Putting Demand and Supply Togethe
r
Price per Quantity Demanded Quantity Supplied
Constant of Constant Quality of Constant Quality
Quality Unit Units per Year Units per Year
$1.00 1,000 200
2.00 800 400
3.00 600 600
4.00 400 800
5.00 200 1,000
1) According to the above table, at a price of $2 per unit, which of the following would exist?
A) A shortage of 800 units B) A surplus of 800 units
C) A shortage of 200 units D) A shortage of 400 units
2) In a free market economy, the market clearing (equilibrium) price in the above table would
adjust to
A) $1. B) $3. C) $4. D) $5.
3) According to the above table, a surplus exists when
A) the price is $1 per unit. B) the price is $2 per unit.
C) the price is $3 per unit. D) the price is greater than $3 per unit.
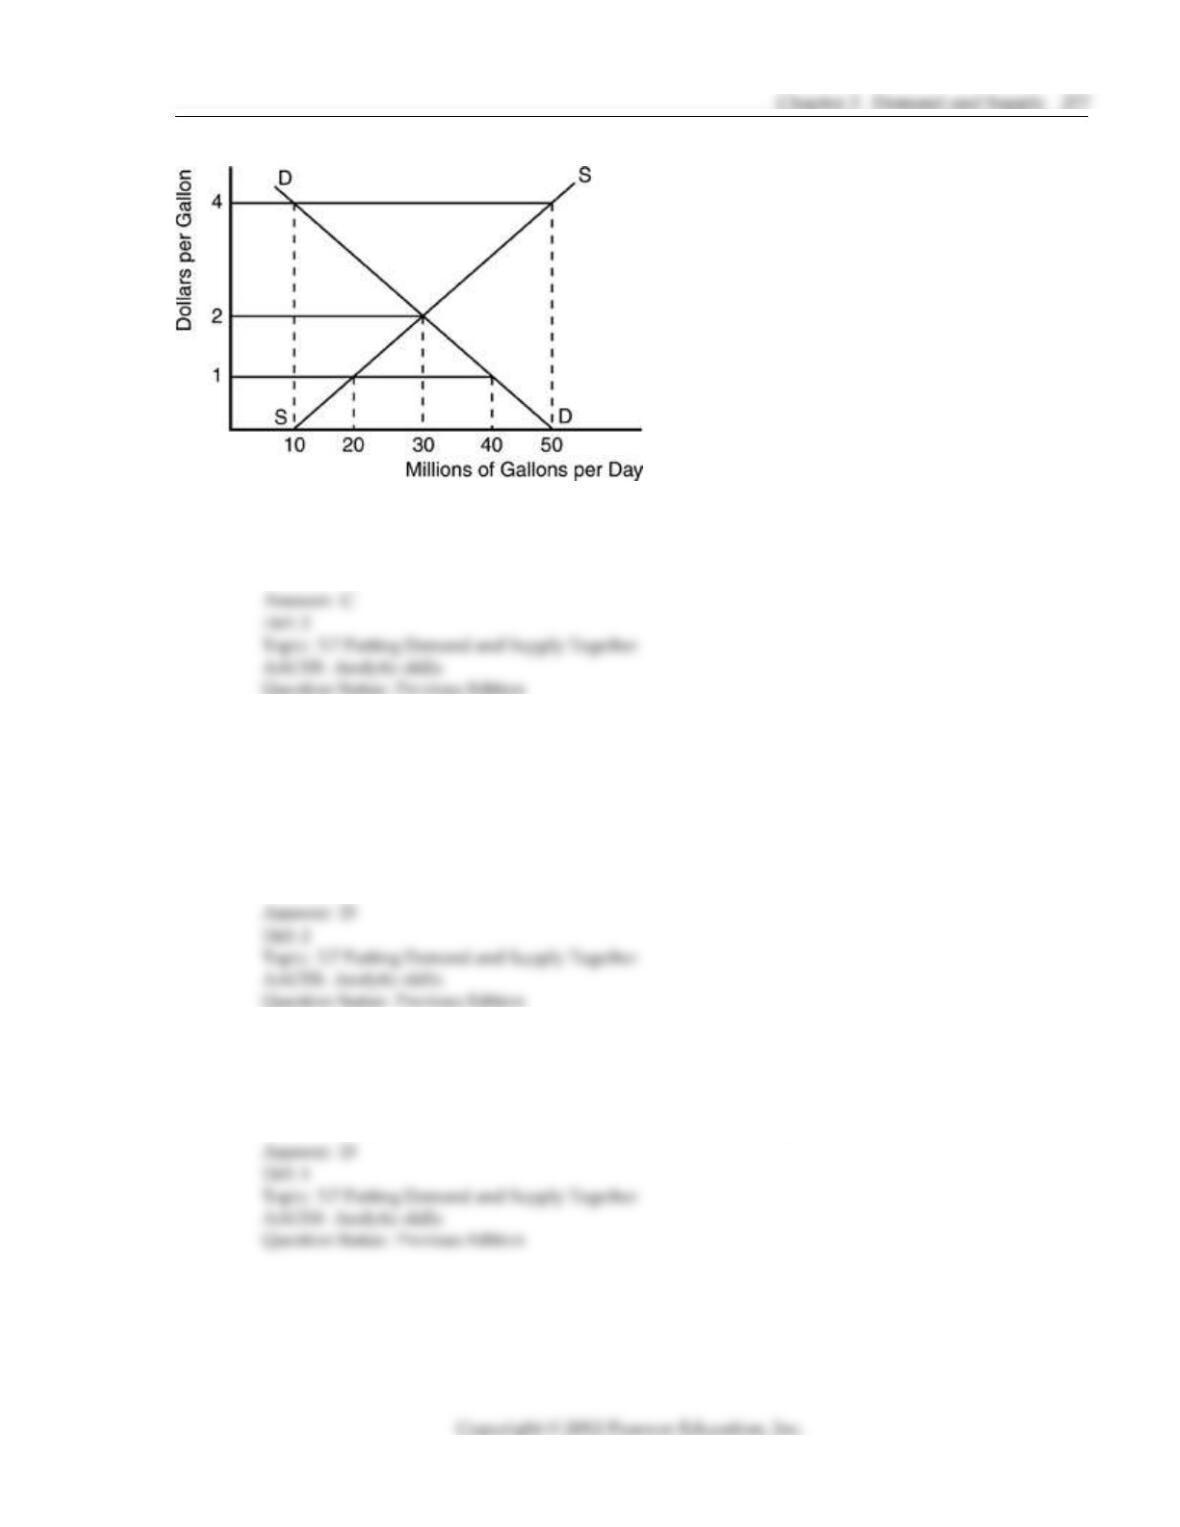
4) According to the above figure, at a price of $1 per gallon, there would be
A) a shortage of 30 million gallons. B) a surplus of 30 million gallons.
C) a shortage of 20 million gallons. D) a surplus of 50 million gallons.
5) According to the above figure, what happens when the price per gallon of gasoline jumps from
$1 to $4?
A) A gasoline surplus is replaces by a gas shortage.
B) The market moves from a shortage of 40 million gallons/day to a surplus of 50 million
gallons/day.
C) The market shortage is replaced by market equilibrium.
D) A surplus of 40 million gallons/day results.
6) In a free market economy, the equilibrium market price and quantity in the above figure will
adjust to equilibrium values of
A) $1 per gallon and 50 million gallons. B) $4 per gallon and 10 million gallons.
C) $2 per gallon and 60 million gallons. D) $2 per gallon and 30 million gallons.
7) According to the above figure, an increase in the price from $2 to $4 will result in
A) a shortage of 30 million gallons.
B) an increase in quantity demanded of 10 million gallons.
C) an increase in quantity supplied of 20 million gallons.
D) an increase in demand of 20 million gallons.
8) In the above figure, a surplus exists in the gasoline market when the price is
A) $1/gallon. B) $2/gallon.
C) $4/gallon. D)
b
elow $2/gallon.
9) According to the above figure, a shortage will occur at a price at which
A) quantity demanded equals quantity supplied.
B) quantity demanded exceeds quantity supplied.
C) quantity supplied exceeds quantity demanded.
D) government sets a price above equilibrium.
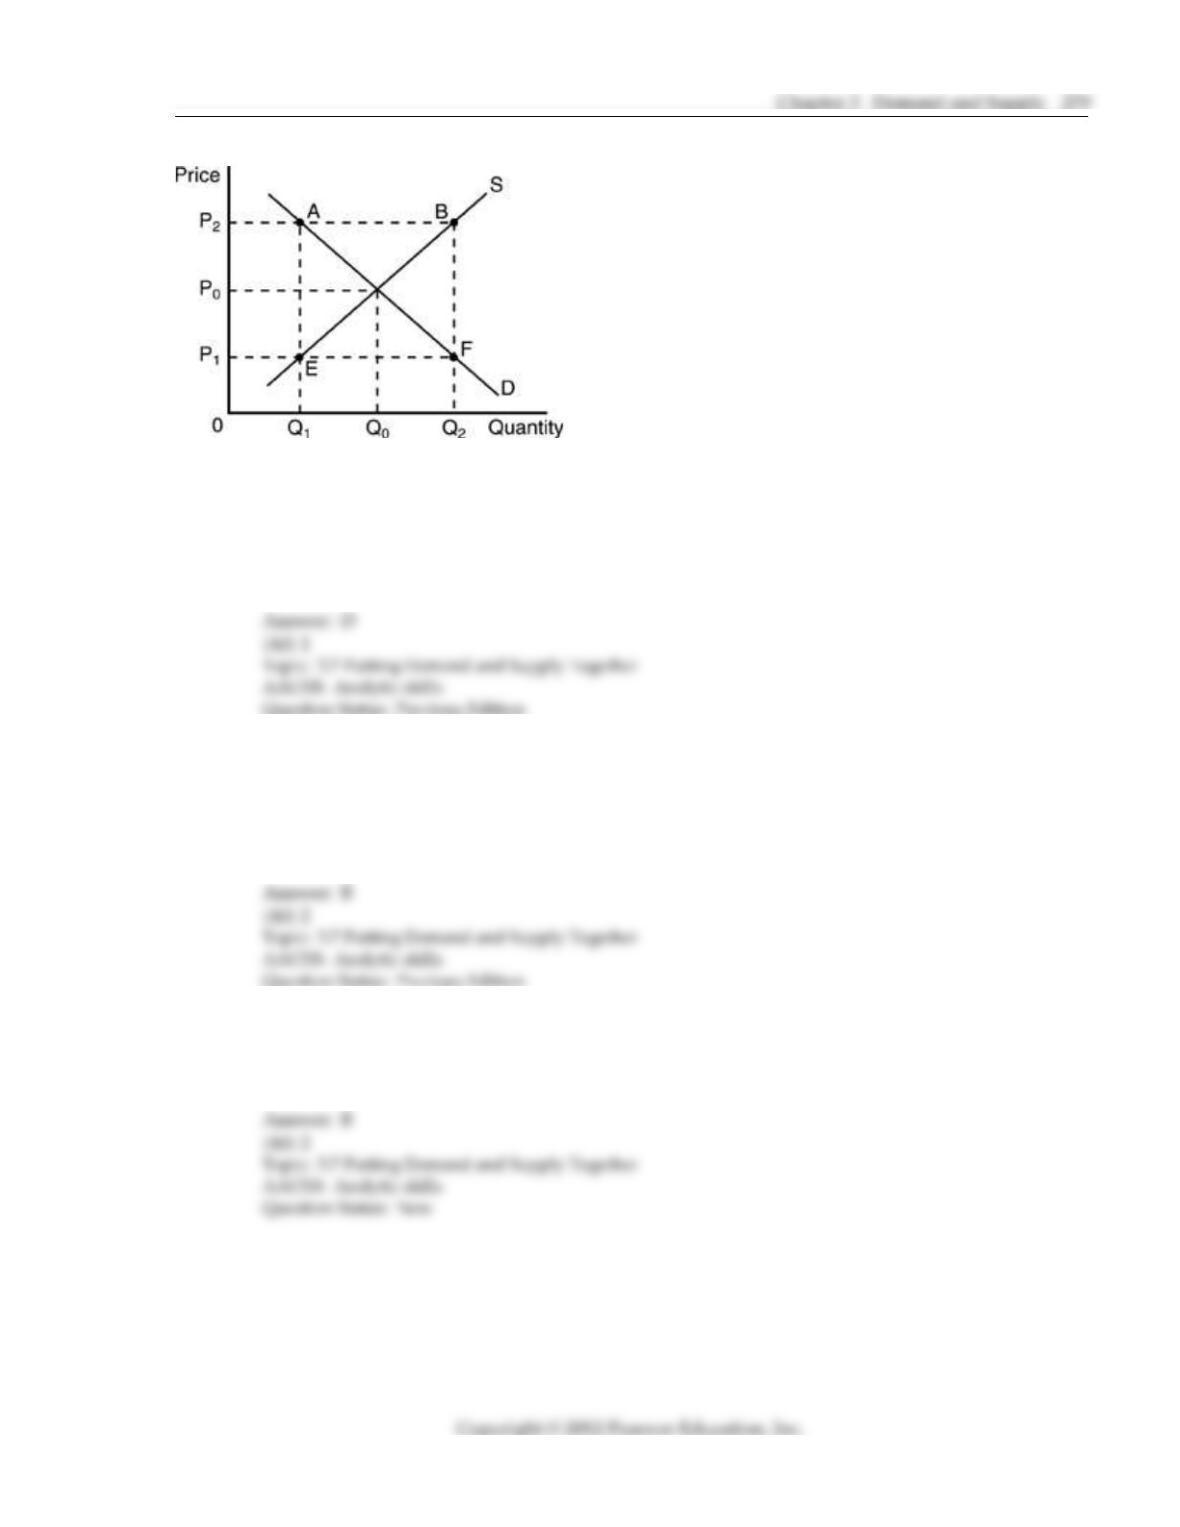
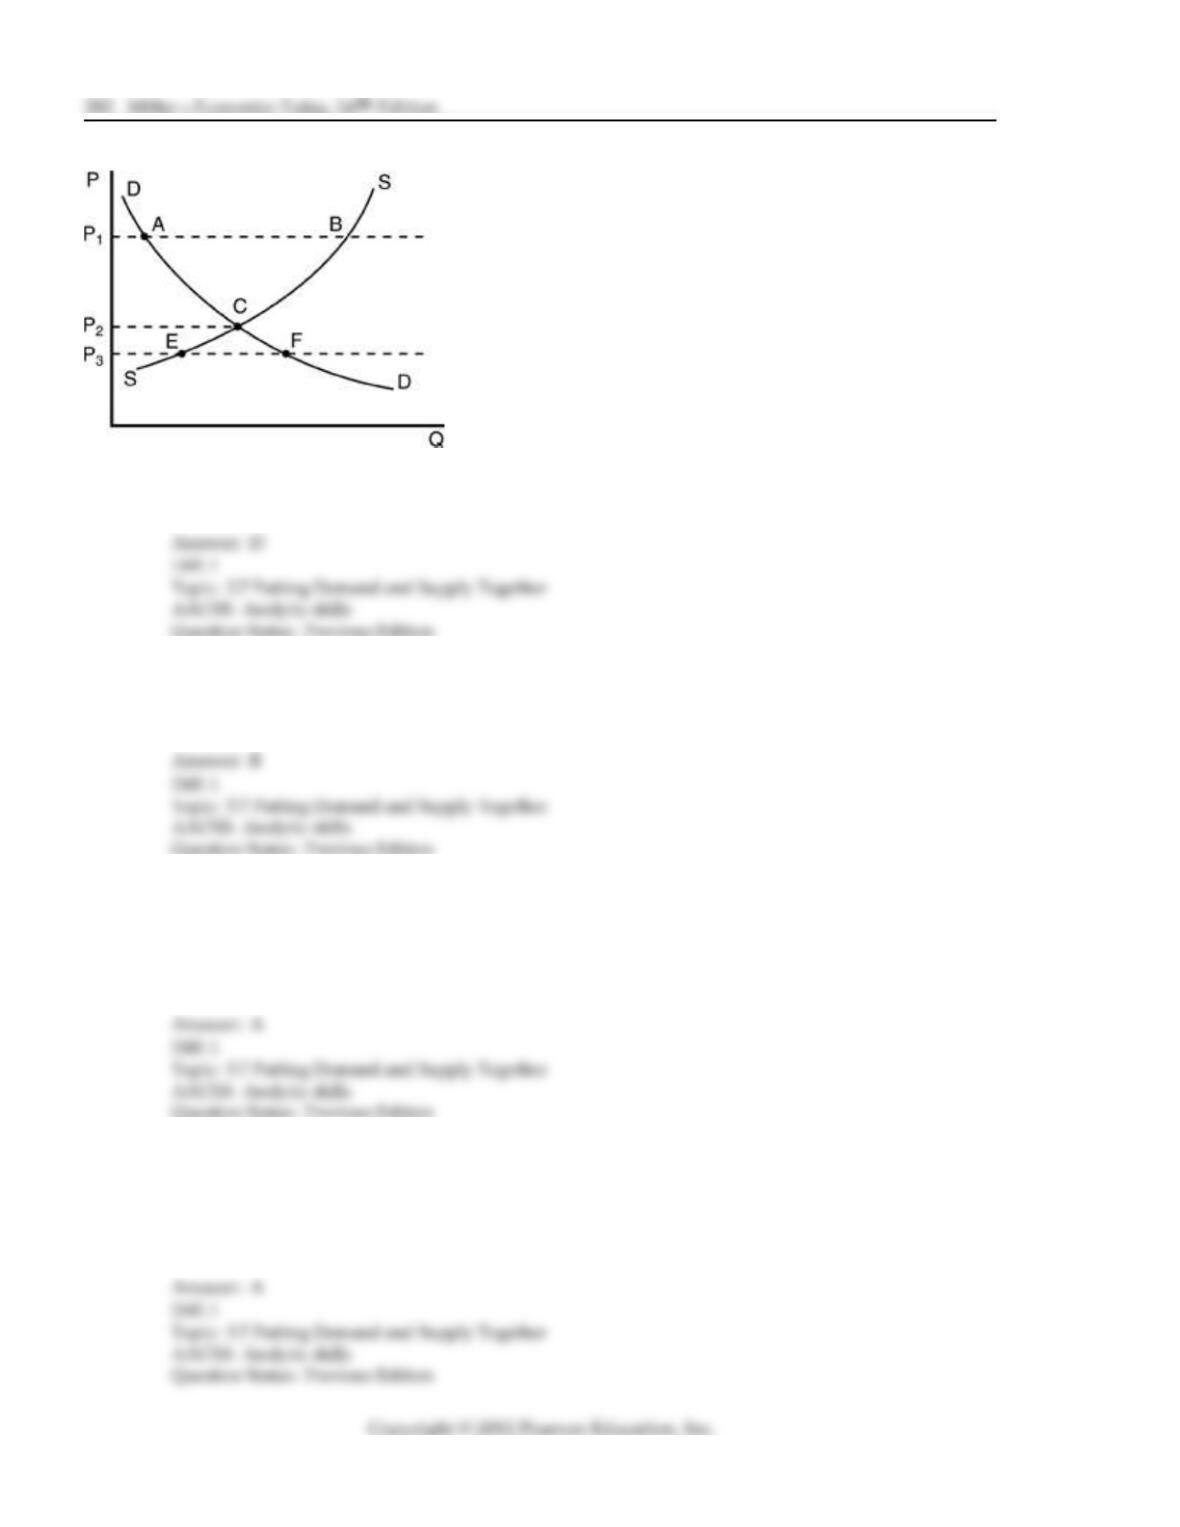
10) At a price of P0in the above figure, which of the following statements is FALSE?
A) Quantity demanded equals quantity supplied.
B) There is an equilibrium in the market.
C) P0is the market clearing price.
D) There is a surplus equal to Q0.
11) If the market price falls from P0to P1in the above figure, then
A) a new equilibrium quantity is established.
B) there is a shortage equal to the distance EF.
C) there will be a further tendency for price to fall.
D) there is a surplus of goods on the market equal to the distance Q 1
,
Q2.
12) If the market price rises from P0to P2in the above figure, then there is a
A) surplus equal to the distance Q0
,
Q2. B) surplus equal to the distance Q1
,
Q2.
C) shortage equal to the distance Q0
,
Q2. D) shortage equal to the distance Q1
,
Q2.
13) Refer to the above figure. The highest price that consumers would be willing to pay for quantity
Q2is
A) P2.
B) P0.
C) P1.
D) cannot be determined from the diagram.
14) Refer to the above figure. Other things being equal, if price is at P2, then we would expect
A) price to decline until an equilibrium is achieved at P0.
B) consumers to reduce their offering price for the good.
C) an excess quantity demanded to occur.
D) consumers to bid against each other for goods and force the price still higher.
Price per Quantity of Quantity of
Constant X Demanded X Supplied
Quality of X per Time Period per Time Period
$10 0 150
8 20 120
6 40 90
4 60 60
2 80 30
0 100 0
15) According to the above table, at a price of $8 per unit, other things constant,
A) consumers will continue to bid prices upward.
B) there will be no tendency for the market to approach an equilibrium.
C) a surplus of 100 units will exist.
D) a shortage of 80 units will exist.
16) According to the market data for good X in the above table, a stable equilibrium price is
established at
A) $2. B) $4. C) $6. D) $8.
17) Given the market data for good X in the above table, an equilibrium quantity is established at
A) 90 units. B) 60 units. C) 30 units. D) 120 units.
18) In any given market, prices are determined by
A) specialization of labor. B) transactions costs.
C) supply and demand. D) comparative advantage.
19) The equilibrium or market clearing price occurs at the point at which
A) quantity demanded equals quantity supplied.
B) the supply curve intersects the horizontal axis.
C) the demand curve intersects the vertical axis.
D) there is a shortage of the desired good.
20) According to the above figure, a shortage is shown between which two points?
A) A and E B) C and B C) A and B D) E and F
21) Using the above figure, at which price is there neither excess quantity demanded nor excess
quantity supplied?
A) P1B) P2C) P3D) none of these
22) At a market clearing price,
A) the quantity demanded will just equal the quantity supplied.
B) there will be an excess quantity demanded.
C) there will be a tendency for price to rise over time.
D) the demand function will shift outward.
23) A market is in equilibrium when
A) the quantity demanded equals the quantity supplied at the market clearing price.
B) the horizontal axis crosses the vertical axis.
C)
b
uyers do not desire for the price to be any lower.
D) the equilibrium price is below the market price.
Chapter 3 Demand and Supply 283
Quantity of Quantity of
Price DVDs DVDs
per CD Demanded Supplied
per Month per Month
$20 500 9000
18 1000 6000
16 1500 4500
14 2000 3500
12 2500 2500
10 3000 1500
8 3500 800
6 4000 100
24) According to the above table, the equilibrium price of DVDs is
A) $16. B) $14. C) $12. D) $10.
25) According to the above table, at a price of $16 per DVD, there is
A) an equilibrium. B) a surplus of 3000 DVDs.
C) a shortage of 3000 DVDs. D) a shortage of 3000 DVDs.
26) According to the above table, there is an excess quantity demanded of 1500 DVDs at the price
A) $14. B) $12. C) $10. D) $8.
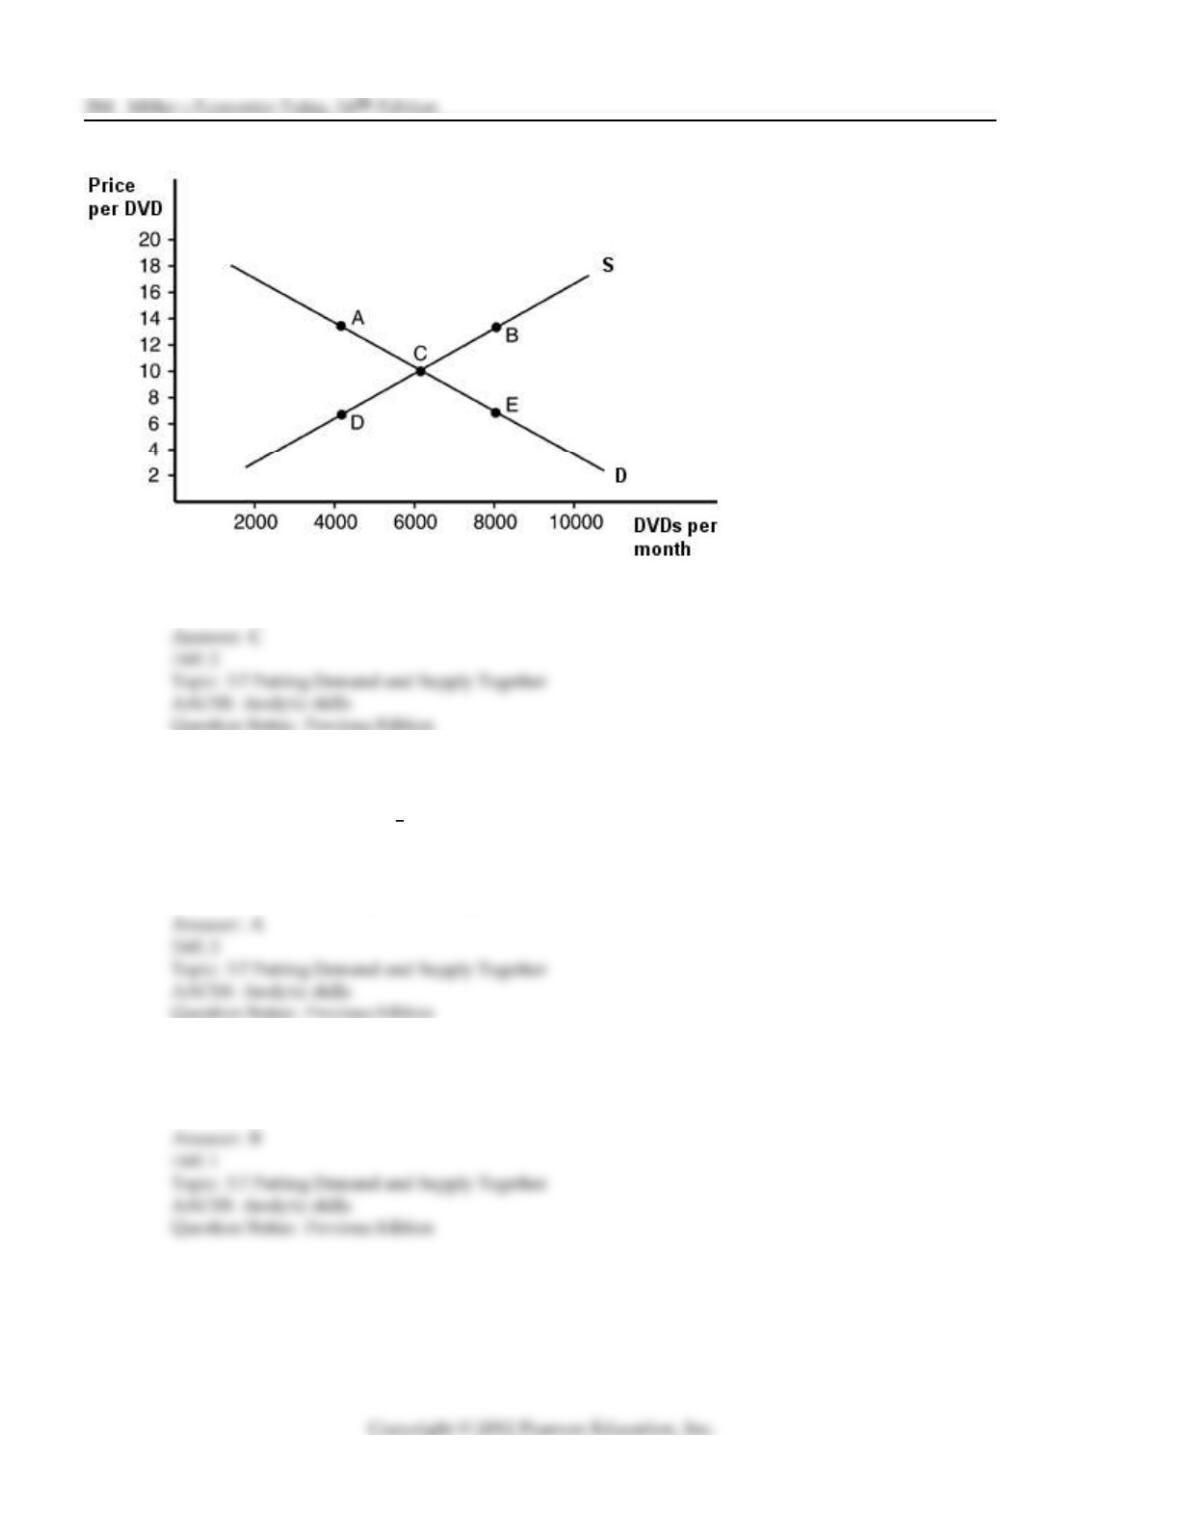
27) According to the above figure, equilibrium is at point
A) E. B) B. C) C. D) D.
28) Suppose a change takes place and the new equilibrium is at point A in the above figure. This
change could have been caused by
A) an increase in the per unit tax on CDs.
B) a decrease in the income of consumers.
C) a reduction in the wages paid to workers in the CD industry.
D) a reduction in the price of CD players.
29) A market requires
A) sellers only. B)
b
uyers and sellers.
C) government intervention. D)
b
uyers only.
30) A shortage will occur whenever
A) price is below the equilibrium price. B) price is above the equilibrium price.
C) price is equal to the equilibrium price. D) the supply curve is upward sloping.
31) If there is a shortage in a free market, then
A) consumers will offer to pay a lower price for the good, and the price will fall toward the
equilibrium level.
B) consumers will offer to pay a higher price for the good, and the price will rise toward the
equilibrium level.
C) suppliers will decrease their output to match demand.
D) suppliers will accept any price below equilibrium.
32) Scalping and other black market activities arise when
A) the prices of goods are allowed to adjust to their equilibrium levels.
B) the quantities of goods demanded and supplied are allowed to adjust to their equilibrium
levels.
C) the prices of goods are restricted to levels above equilibrium prices.
D) the prices of goods are restricted to levels below equilibrium prices.
33) A shortage will occur when
A) the price equals the market clearing level.
B) the price is above the market clearing level.
C) there is an excess quantity supplied.
D) the price is below the market clearing level.