130. A recent study found that it was cheaper to buy a chicken dinner from Kentucky Fried Chicken than it was to prepare
it at home. The researcher included all costs including the imputed value of time involved to prepare the meal at home.
This study illustrates the
a.
value of marginal analysis.
b.
law of increasing costs.
c.
difference between real costs and money costs.
d.
cost disease of the service sector.
131. In an attempt to boost enrollment, in January, 1996, a private college in Iowa offered free tuition for graduating high
school seniors from the county where it is located. For students who accepted the offer, how did this offer affect the
opportunity cost of attending college?
a.
The opportunity cost did not change, since lost earnings were still a factor.
b.
The opportunity cost became zero for the typical student.
c.
The opportunity cost was very low, because the only cost was for books and supplies.
d.
The opportunity cost did not change, since tuition was not a factor in computing opportunity cost.
e.
The opportunity cost was lower than if tuition was charged, but there was still a cost.
132. Rational production decisions require an understanding of
a.
trade-offs.
b.
opportunity costs.
c.
scarcity of resources.
d.
All of the above are correct.
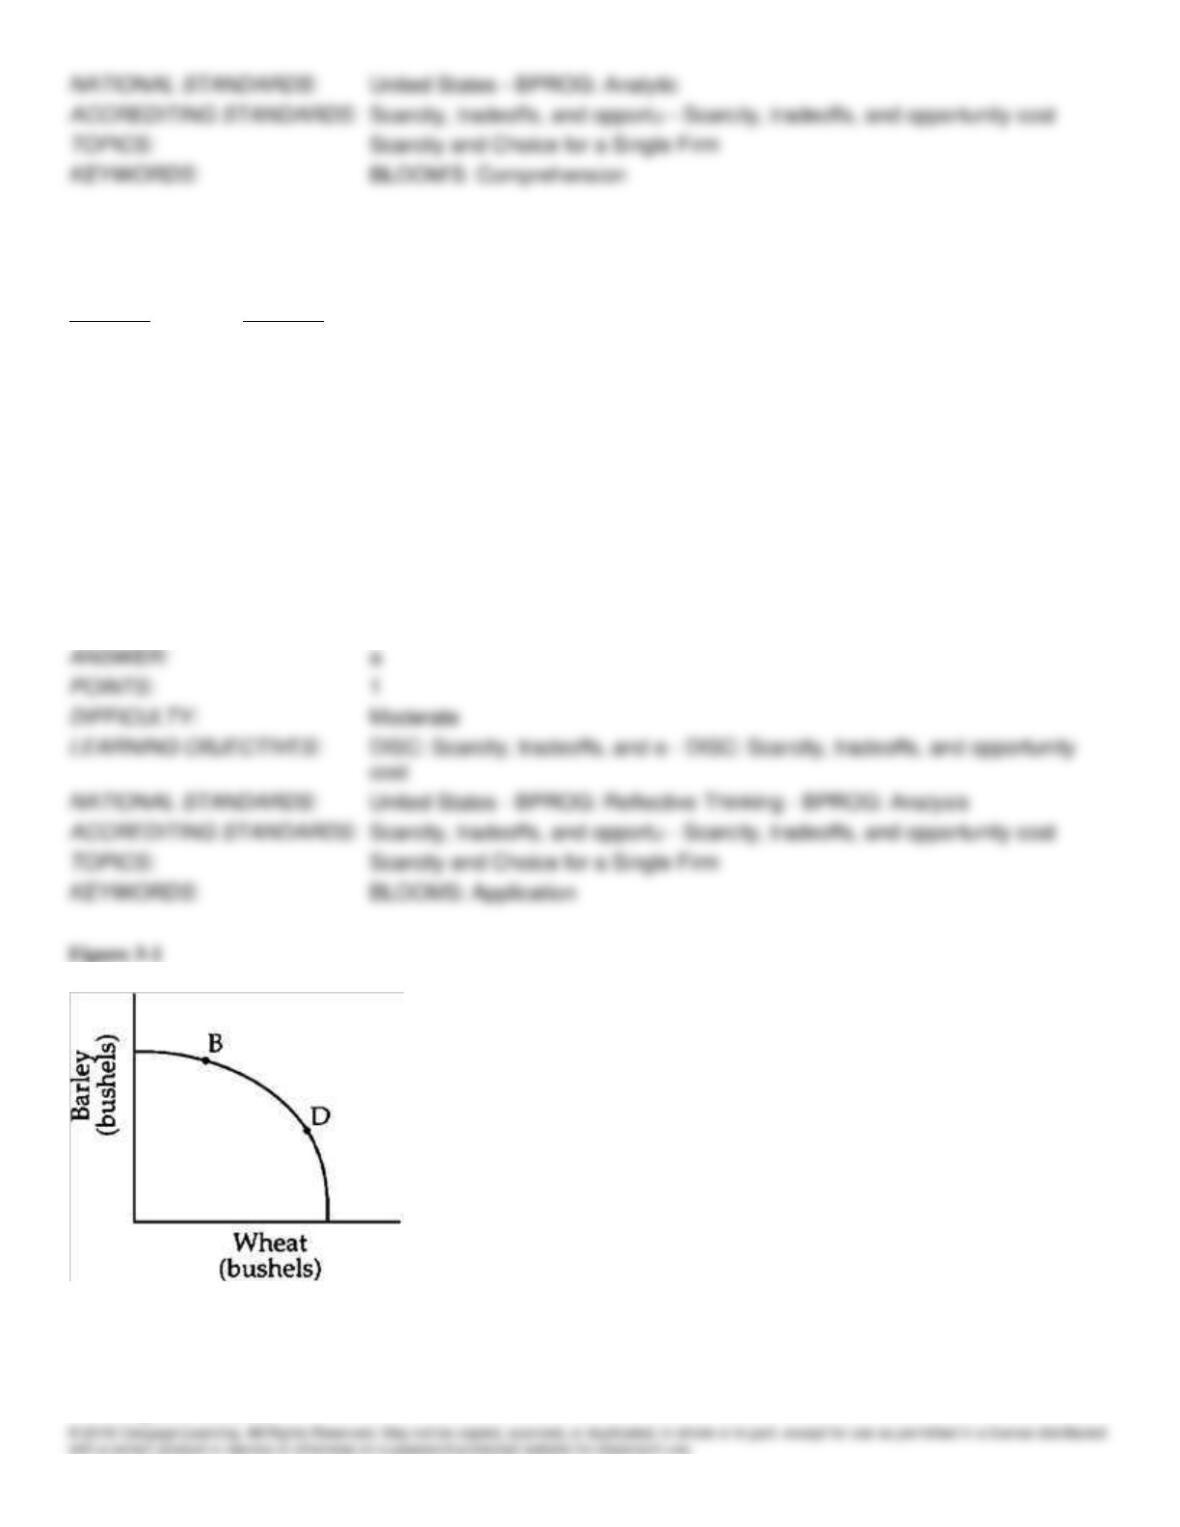
Table 3-1
Peanuts
Corn
(Bushels)
(Bushels)
0
55
10
50
20
42
30
28
40
0
133. Suppose a farmer produces 50 bushels of corn and 10 bushels of peanuts. According to Table 3-1, the opportunity
cost of 10 more bushels of peanuts is
a.
8 bushels of corn.
b.
42 bushels of corn.
c.
50 bushels of corn.
d.
impossible to determine from the information given.
134. According to Figure 3-1, the opportunity cost of one more bushel of wheat is
a.
higher at B than at D.
b.
lower at B than at D.
c.
equal at B and D.
d.
impossible to determine from the information given.
135. The shape of the production possibilities frontier in Figure 3-1 implies that
a.
some resources are better suited for producing wheat than for producing barley.
b.
the opportunity cost of producing more wheat falls as wheat production rises.
c.
the farmer’s technology is not subject to the principle of increasing costs.
d.
the financial cost of producing wheat is higher than the financial cost of producing barley.
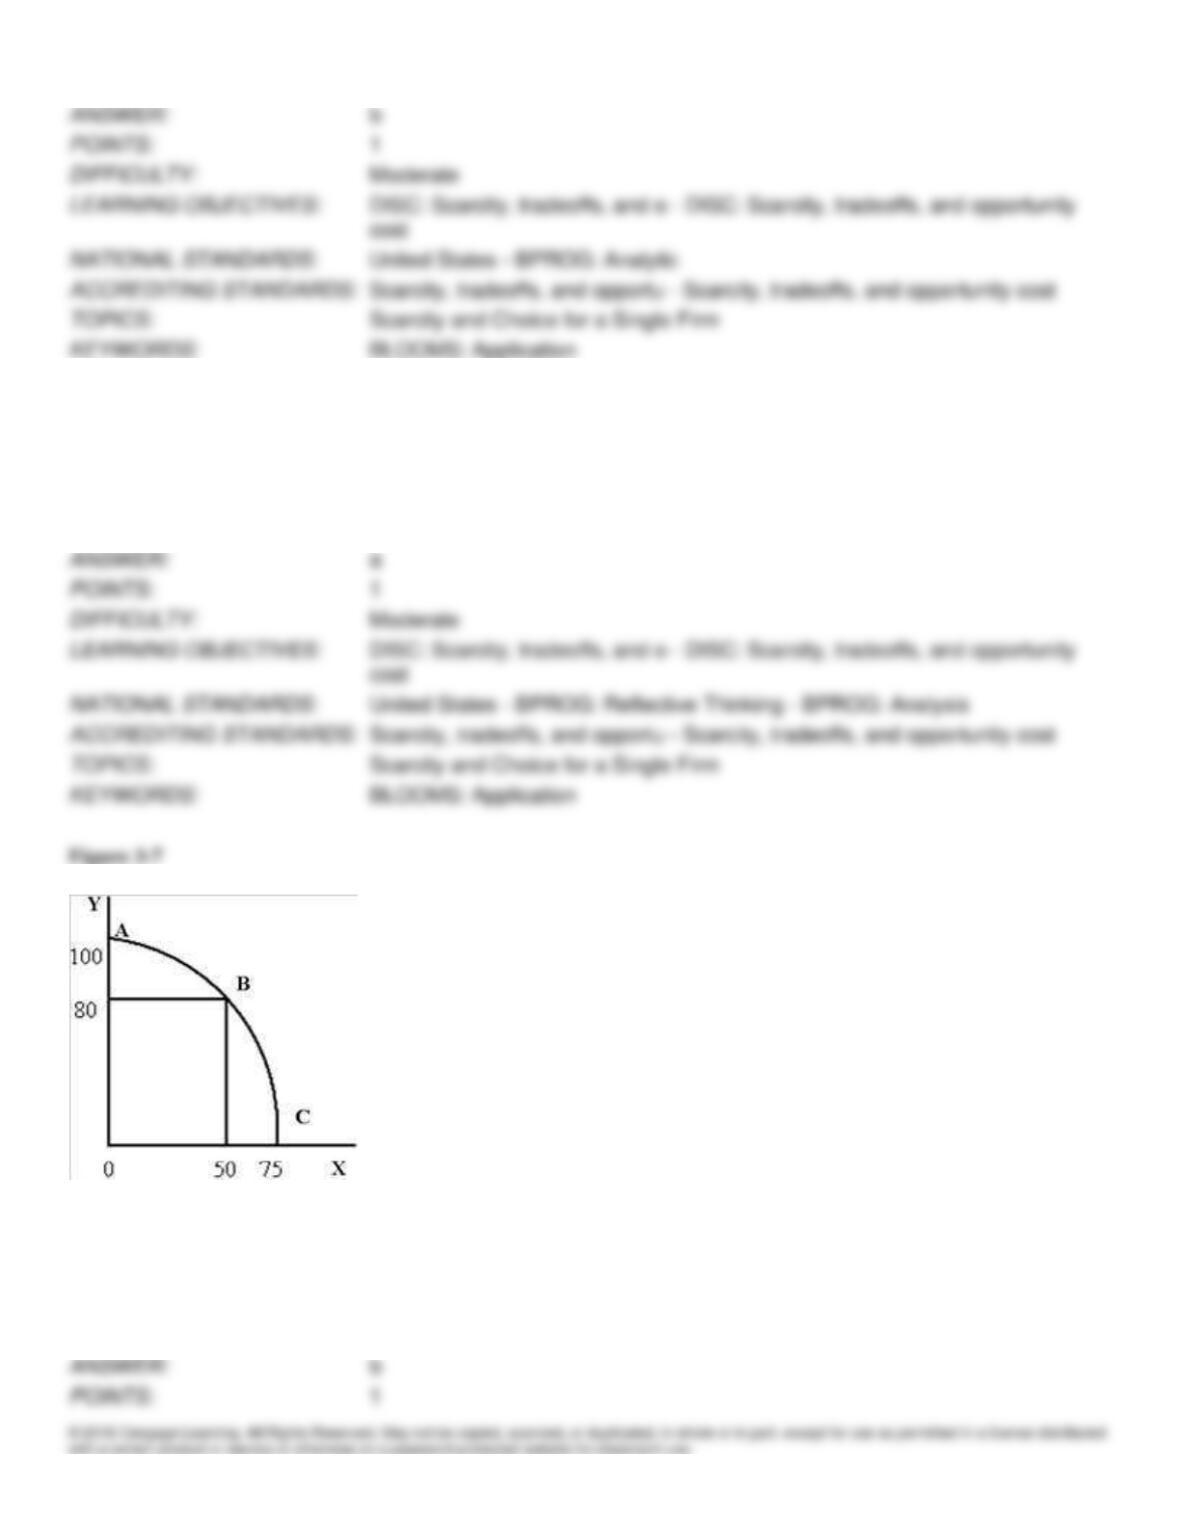
136. What is the opportunity cost of moving from point B to point A in Figure 3-7?
a.
20 units of X
b.
50 units of X
c.
25 units of X
d.
75 units of X
137. The production possibilities curve illustrates the basic principle that
a.
an economy’s capacity to produce increases in proportion to its population.
b.
if all resources of an economy are in use, more of one good can be produced only if less of another is
produced.
c.
an economy will automatically seek that output at which all of its resources are employed.
d.
no opportunity cost exists in production.
138. For a given production possibilities frontier, which points are attainable?
a.
points inside the frontier
b.
points outside the frontier
c.
points on or outside the frontier
d.
points on the frontier only
e.
points on or inside the frontier
139. A production possibilities curve always slopes downward to the right because resources
a.
are not scarce.
b.
have no opportunity cost.
c.
are freely available.
d.
are limited.
e.
are not related to outputs.
140. How are the slope of a production possibilities frontier and the opportunity cost of the goods related?
a.
The slope is a graphical representation of the cost of expanding production of both goods.
b.
The slope is a graphical measure of the growth rate of the economy.
c.
The slope is a graphical representation of the cost of decreasing unemployment.
d.
The slope is a graphical representation of the rate of trade-off between the goods.
e.
The slope is a graphical representation of the cost of economic growth in the economy.
141. Which of the following is likely to affect the position and shape of society’s production possibilities frontier?
a.
volume of physical resources
b.
level of labor skills
c.
level of technology
d.
amount of factories on hand
e.
All of the above are correct.
142. The notion of opportunity cost can be represented graphically by the
a.
area inside the production possibilities frontier.
b.
slope of the production possibilities frontier.
c.
vertical distance from the horizontal axis to the production possibilities frontier.
d.
horizontal distance from the vertical axis to the production possibilities frontier.
e.
sum of the horizontal and vertical distances to the production possibilities frontier.
Table 3-2
Combination
Cotton
Corn
A
12
16
B
17
15
C
21
13
D
23
9
E
24
5
143. From the data given in Table 3–2, the opportunity cost of increased cotton in moving from A to B is
a.
16 units of corn.
b.
31 units of corn.
c.
15 units of corn.
d.
4 units of corn.
e.
1 unit of corn.
144. In Table 3-2, from point C, the opportunity cost of 3 more units of cotton would be
a.
4 units of corn.
b.
8 units of corn.
c.
14 units of corn.
d.
16 units of corn.
145. All of the points inside a production possibilities frontier are ____; all of the points outside the production
possibilities frontier are ____.
a.
efficient, inefficient
b.
optimal, irrational
c.
attainable, unattainable
d.
rational, zero-cost
e.
unattainable, efficient
146. A production possibilities curve has a downward slope because
a.
increased production of one good always reduces the additional profit of production.
b.
decreased production of one good is associated with lower profit from that good.
c.
economists have a negative view of life and human nature.
d.
increased production of one good always reduces production of the other.
e.
increased production of one good necessarily causes production of other goods to increase.
147. If production involves constant opportunity cost, the production possibilities curve
a.
is “bowed inward.”
b.
is a straight line.
c.
is “bowed outward.”
d.
is a wavy line.
e.
has an unpredictable shape.
148. If production involves decreasing opportunity cost, the production possibilities curve
a.
is “bowed inward.”
b.
is a straight line.
c.
is “bowed outward.”
d.
is a wavy line.
e.
has an unpredictable shape.
149. The opportunity cost of increased production of some good can be measured with
a.
the slope of a ray to the production possibilities curve.
b.
the area under the curve of a production possibilities curve.
c.
the area of the rectangle bounded by the axes and the point on the production possibilities curve.
d.
the slope of the production possibilities curve.
e.
All of the above are correct.
150. Which principle states that as the production of one good expands, the opportunity cost of producing another unit of
this good generally increases?
a.
Principle of total cost
b.
Principle of increasing cost
c.
Principle of opportunity cost
d.
Principle of increasing marginal utility
151. If production involves increasing opportunity cost, then moving nearer the horizontal axis will increase the
opportunity cost of
a.
the good that is shown on the horizontal axis.
b.
the good that is shown on the vertical axis.
c.
both of the goods shown on the axes.
d.
neither of the goods shown on the axes.
152. In terms of the production possibilities diagram, the principle of increasing cost simply asserts that the frontier is
a.
downward sloping.
b.
upward sloping.
c.
bowed inward.
d.
bowed outward.
e.
undefined, because no market will exist in this case.
153. The production possibilities frontier for a country is usually drawn
a.
as a straight line, sloping downward.
b.
as a straight line, sloping upward.
c.
bowed outward from the origin.
d.
bowed inward toward the origin.
e.
as a dotted line when sloping downward and as a full line when sloping upward.
154. A normal production possibilities frontier has a
a.
positive slope, and is steeper near the horizontal axis than near the vertical axis.
b.
negative slope, and is steeper near the horizontal axis than near the vertical axis.
c.
positive slope, and is steeper near the vertical axis than near the horizontal axis.
d.
negative slope, and is steeper near the vertical axis than near the horizontal axis.
e.
zero slope, and it does not touch the horizontal axis.
155. The fact that resources tend to be specialized is one reason the production possibilities frontier is drawn
a.
bowed outward.
b.
bowed inward.
c.
as a straight line (but not horizontal).
d.
as a horizontal straight line.
156. The concavity or bowed-out shape of the production possibilities frontier is the result of
a.
the law of downward-sloping demand.
b.
the law of upward-sloping demand.
c.
the principle of increasing cost.
d.
complementarity in consumption.
157. If the production possibilities curve is a straight line,
a.
opportunity costs rise as output of either commodity is expanded.
b.
resources are not equally productive in the production of both goods.
c.
opportunity costs are negative.
d.
resources can be moved from the production of one good to production of others with no loss of productivity.
158. The tendency of opportunity cost to increase as production increases
a.
is an example of theory that has not been proven by facts.
b.
is a general principle, but not a universal fact.
c.
is a universal fact, with no known exceptions.
d.
rarely holds in reality, but is a useful theory.
e.
cannot be tested with standard economic tools.
159. The statement “Resources employed in producing X are better suited to making Y” is another way of saying
resources
a.
are specialized.
b.
are scarce.
c.
are used inefficiently.
d.
are unproductive.
e.
have no opportunity cost.
160. Increasing opportunity cost tends to occur if
a.
management is disorganized.
b.
markets do not equate money and opportunity cost.
c.
production is inefficient.
d.
resources are scarce.
e.
resources are specialized.
161. The statement “Resources employed in producing X are better suited to making Y” is another way of saying
a.
the production possibilities frontier is “bowed out.”
b.
the production possibilities frontier is a straight line.
c.
the production possibilities frontier is “bowed in.”
d.
resources are unproductive.
e.
resources have no opportunity cost.
162. If good “A” is represented on the horizontal axis and good “B” on the vertical axis, then the steeper the production
possibilities frontier at a given level of production of good “A,” the
a.
larger the opportunity cost of producing an extra unit of good “A.”
b.
larger the quantity of resources being devoted to the production of good “B.”
c.
smaller the quantity of resources being devoted to the production of good “A.”
d.
smaller the opportunity cost of producing an extra unit of good “A.”
e.
greater the returns to scale in the production of good “A.”
163. What determines the position and shape of a society’s production possibilities frontier?
a.
the physical resources of that society
b.
the skills of the workforce
c.
the level of technology of the society
d.
the amount of factories in the society
e.
All of the above are correct.
164. A typical economy produces thousands of different goods. Is it accurate to say that society faces a production
possibilities frontier?
a.
No, because two dimensions cannot capture the complexity of a full economy.
b.
No, although a graph with several thousand dimensions would be appropriate.
c.
Yes, although society does not face opportunity cost and the model does not apply.
d.
Yes, because scarcity always imposes opportunity costs.
e.
Uncertain-economic theory has no answer to this question.
165. Because resources tend to be specialized, increased production of military goods tends to
a.
decrease the opportunity cost of more military goods.
b.
increase the opportunity cost of more non-military goods.
c.
increase the opportunity cost of more military goods.
d.
change the position of the production possibilities curve.
e.
alter the slope of the production possibilities curve.
Figure 3-2
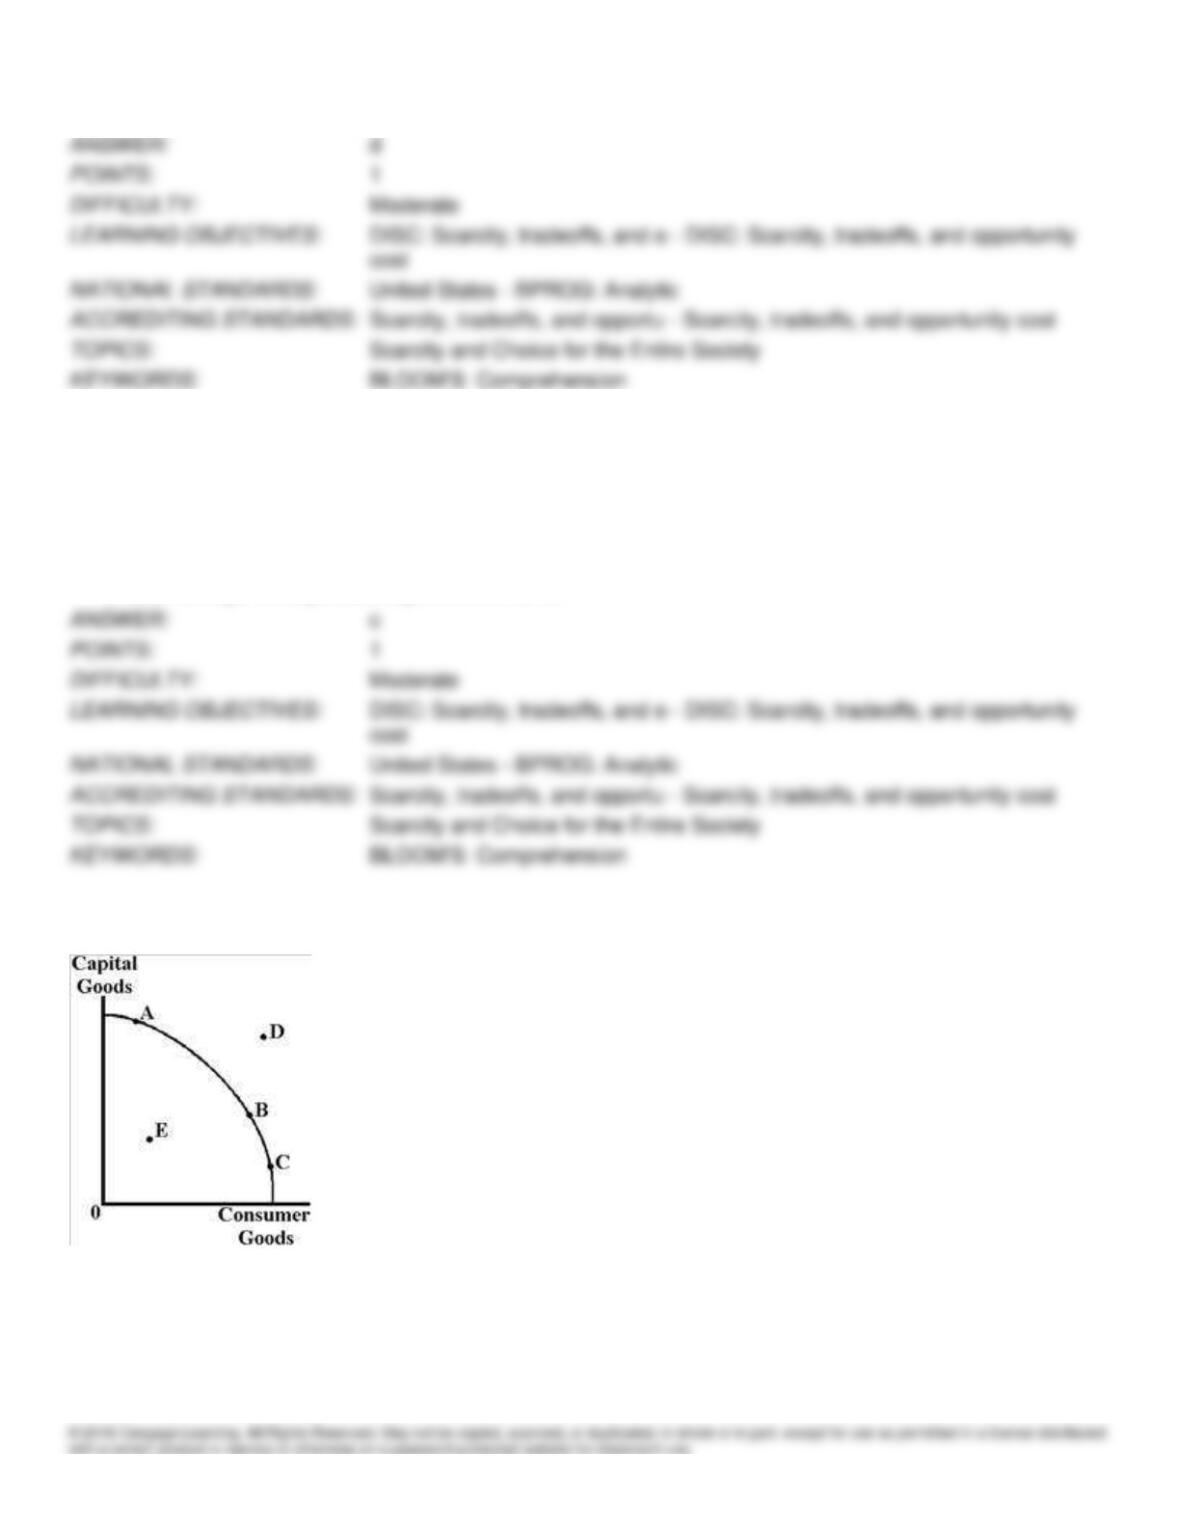
166. In Figure 3-2, the production possibilities frontier has a bowed-out shape because of the law of
a.
decreasing costs.
b.
increasing costs.
c.
demand.
d.
comparative advantage.
167. In Figure 3-2, a point such as E
a.
is not obtainable.
b.
is an efficient use of resources.
c.
represents an inefficient allocation of resources.
d.
indicates that the society is a capitalist society.
168. In Figure 3-2, a point such as A
a.
is preferable over B.
b.
is an efficient use of resources.
c.
represents a misallocation of resources.
d.
is not obtainable.
169. In Figure 3-2, a point such as D
a.
can be obtained through new technology.
b.
can never be obtained.
c.
can only be obtained by a capitalist society.
d.
represents a misallocation of resources.
170. In Figure 3-2, at point B
a.
it is impossible to increase production of consumer goods.
b.
it is impossible to increase production of capital goods.
c.
it is possible to increase production of both capital goods and consumer goods simultaneously.
d.
it is impossible to increase production of both capital goods and consumer goods simultaneously.
171. Which of the following does not determine the position and shape of a society’s PPF?
a.
physical resources
b.
price level
c.
skills and technology
d.
past construction of factories and research
172. Which of the following characteristics of a PPF indicates that tradeoffs must be made?
a.
the downward slope
b.
the upward slope
c.
the constant slope
d.
the curvature
173. Opportunity costs exist for
a.
households but not businesses or governments.
b.
businesses but not households or governments.
c.
businesses and households but not governments.
d.
households, businesses, and governments.
174. What would be the opportunity cost of a child using a coupon for a free ice cream cone?
a.
the dollar cost of the cone she selected
b.
the other types of ice cream she could have selected
c.
zero – because the good was not a durable good
d.
zero – because the good was free
175. Which of the following is not an example of a type of factor of production?
a.
land
b.
labor
c.
government
d.
capital
176. Which of the following is a listing of the types or categories of resources?
a.
land, labor, and capital
b.
land, labor, and education
c.
land, labor, and efficiency
d.
land, labor, and markets
e.
land, labor, and inputs
177. In order to make an optimal choice we must use
a.
percentage analysis.
b.
total analysis.
c.
average analysis.
d.
marginal analysis.
178. What is the opportunity cost of economic growth?
a.
investment in the current time period
b.
improved technology in the current time period
c.
capital goods in the current time period
d.
consumption in the current time period
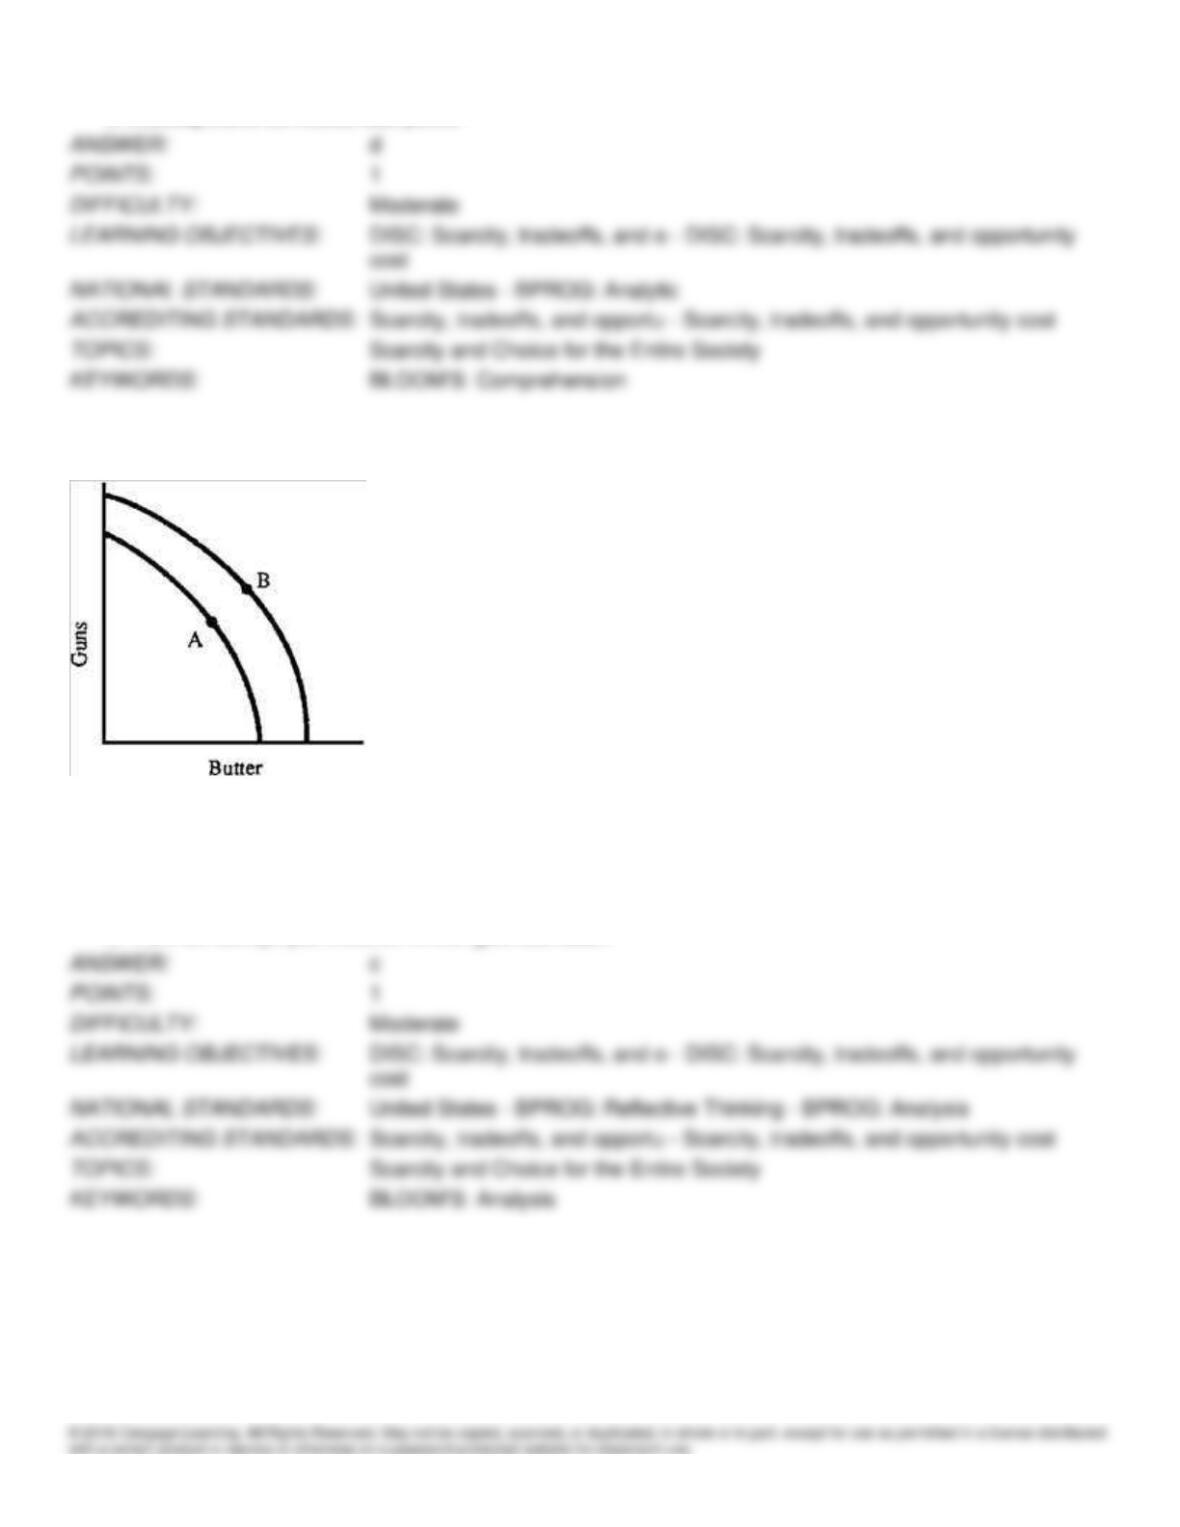
Figure 3-3
179. In Figure 3-3, a shift from A to B seems most consistent with which of the following?
a.
Society decided to give guns lower priority.
b.
There have been more technological advances in guns than in butter.
c.
There is a massive immigration of labor.
d.
There are unemployed resources in both guns and butter.
Figure 3-4
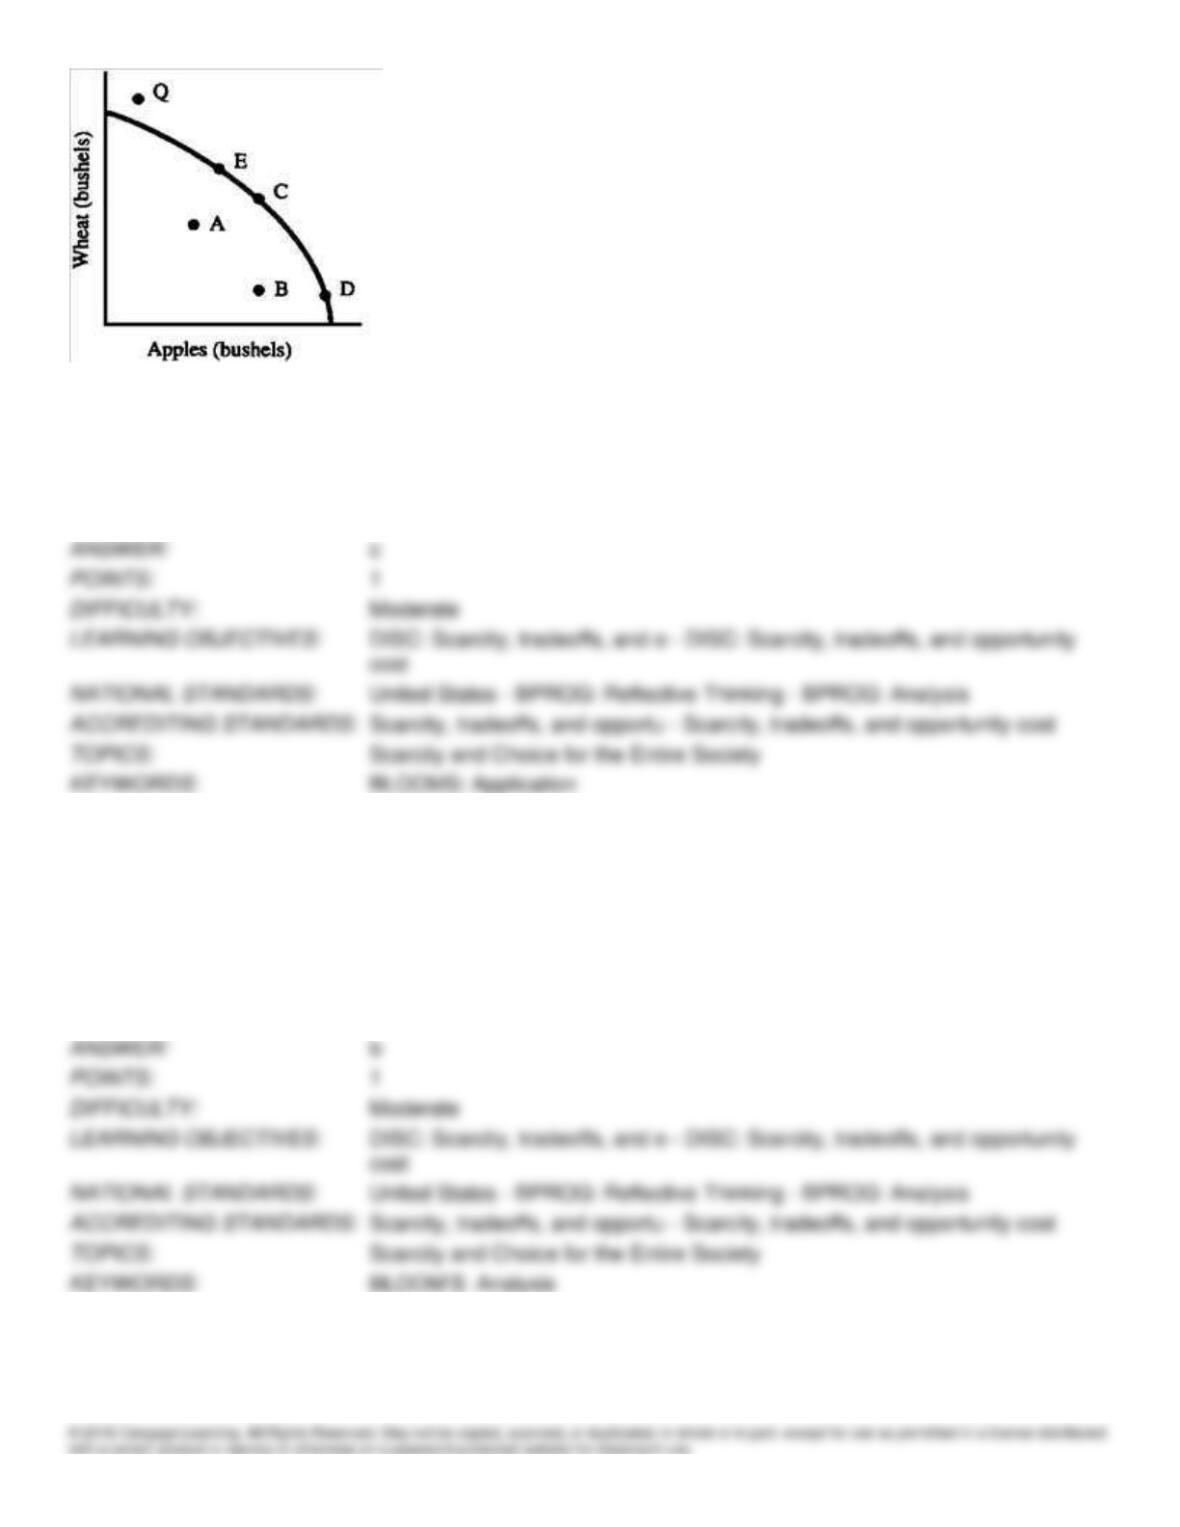
180. Which of the following would make point Q in Figure 3-4 attainable?
a.
full-employment policies
b.
a technological advance in the production of apples only
c.
an increase in land available for agriculture
d.
a transfer of available resources from apples to wheat
181. In Figure 3-4, for which of the following would this statement be true: “To get more apples we have to give up
wheat.” A movement from
a.
A to E
b.
C to D
c.
D to C
d.
D to E
e.
B to C
182. Suppose the U.S. government has an annual budget of about $3.03 trillion. Does the U.S. government face the
problem of scarcity?
a.
No, a government with $3.03 trillion faces no real constraints.