Chapter 3 Demand and Supply 249
131) What is the difference between a normal good and an inferior good? How does this relate to the
demand curve?
3.4 The Law of Supply
1) The law of supply implies that the supply curve is
A) flat. B) upward sloping.
C) downward sloping. D) vertical.
2) If the price of Pepsi increases, then there will be ________ of Pepsi.
A) a decrease in the supply B) an increase in the supply
C) an increase in the quantity supplied D) a decrease in the quantity supplied
3) The law of supply states that other things being equal,
A) supply creates its own demand.
B) supply will increase if productivity increases.
C) as price increases, quantity supplied increases.
D) supply will increase to meet demand if demand increases.
4) Other things being equal, the relationship between price and quantity supplied is
A) negative. B) constant. C) positive. D) non existent.
5) A movement along a supply curve is induced by a change in
A) input prices. B) taxes and subsidies.
C) price expectations. D) the product s own price.
6) The quantity supplied of a particular good is the amount of the good that
A) households are willing to consume at each particular price.
B) firms will actually end up buying at a particular price during a given time period.
C) firms are willing to sell at each price during a particular time period.
D) households want firms to sell at each price during a particular time period.
7) Which of the following represents the law of supply?
A) An increase in the price of a good causes an increase in the supply of that good.
B) An increase in the price of a good causes a rightward shift of the supply curve for that
good.
C) An increase in the price of a good causes an increase in the quantity supplied of that good.
D) all of the above
8) An increase in price will lead to an increase in quantity supplied. This statement is
A) the law of supply. B) the law of demand.
C) untrue always. D) a normative statement.
9) The law of supply includes the statement other things being equal. These other things include
all of the following EXCEPT
A) resource prices. B) technology.
C) producers expectations. D) consumer s income.
10) Which of the following is an example of the law of supply?
A) The price of gum has increased so producers are making more gum.
B) The price of labor has increased and producers decrease supply.
C) The amount of a good purchased increases when the price decreases.
D) Producers provide less of a good when the price increases.
11) According to the law of supply,
A) people buy more of a good when the price increases.
B) people buy less of a good when the price decreases.
C) producers provide more of a good when the price decreases.
D) producers provide less of a good when the price decreases.
12) Suppliers will provide more of a good when
A) the market price increases. B) the good is a normal good.
C) resource prices increase. D) there is a decrease in demand.
13) A given supply curve illustrates
A) the relationship between price and quantity supplied.
B) the effect of a change in resource costs on quantity supplied.
C) the effect of a change in technology on quantity supplied.
D) the relationship between expected future prices and quantity supplied.
14) The data points on a supply curve come from
A) survey analysis.
B) the same place from which we get the data points on a demand curve.
C) the supply schedule.
D) companies annual reports.
15) Other things being equal, an increase in the price of a good leads to an increase in the amount
produced. This is known as
A) the law of demand. B) the law of supply.
C) ceteris paribus. D) equilibrium.
16) The direct relationship between changes in price and changes in quantity supplied is
A) a change in supply. B) shown by a shift in the supply curve.
C) the law of supply. D) the law of relative production.
17) If the price of oil rises, producers of oil will
A) increase the quantity of oil supplied.
B) supply less oil.
C) leave the amount of oil supplied unchanged.
D) cut the price.
18) The law of supply states that there is
A) an inverse relationship between price and technology, ceteris paribus.
B) a direct relationship between profit and quantity supplied, ceteris paribus.
C) no relationship between price of resources and number of suppliers, ceteris paribus.
D) a direct relationship between price and quantity supplied, ceteris paribus.
19) Regarding the law of supply, which of the following statements is correct?
A) As the price of a good or service rises, the quantity supplied will increase.
B) As the price of a good or service rises, the quantity supplied will decrease.
C) The ceteris paribus assumption does not apply.
D) As demand falls, supply rises.
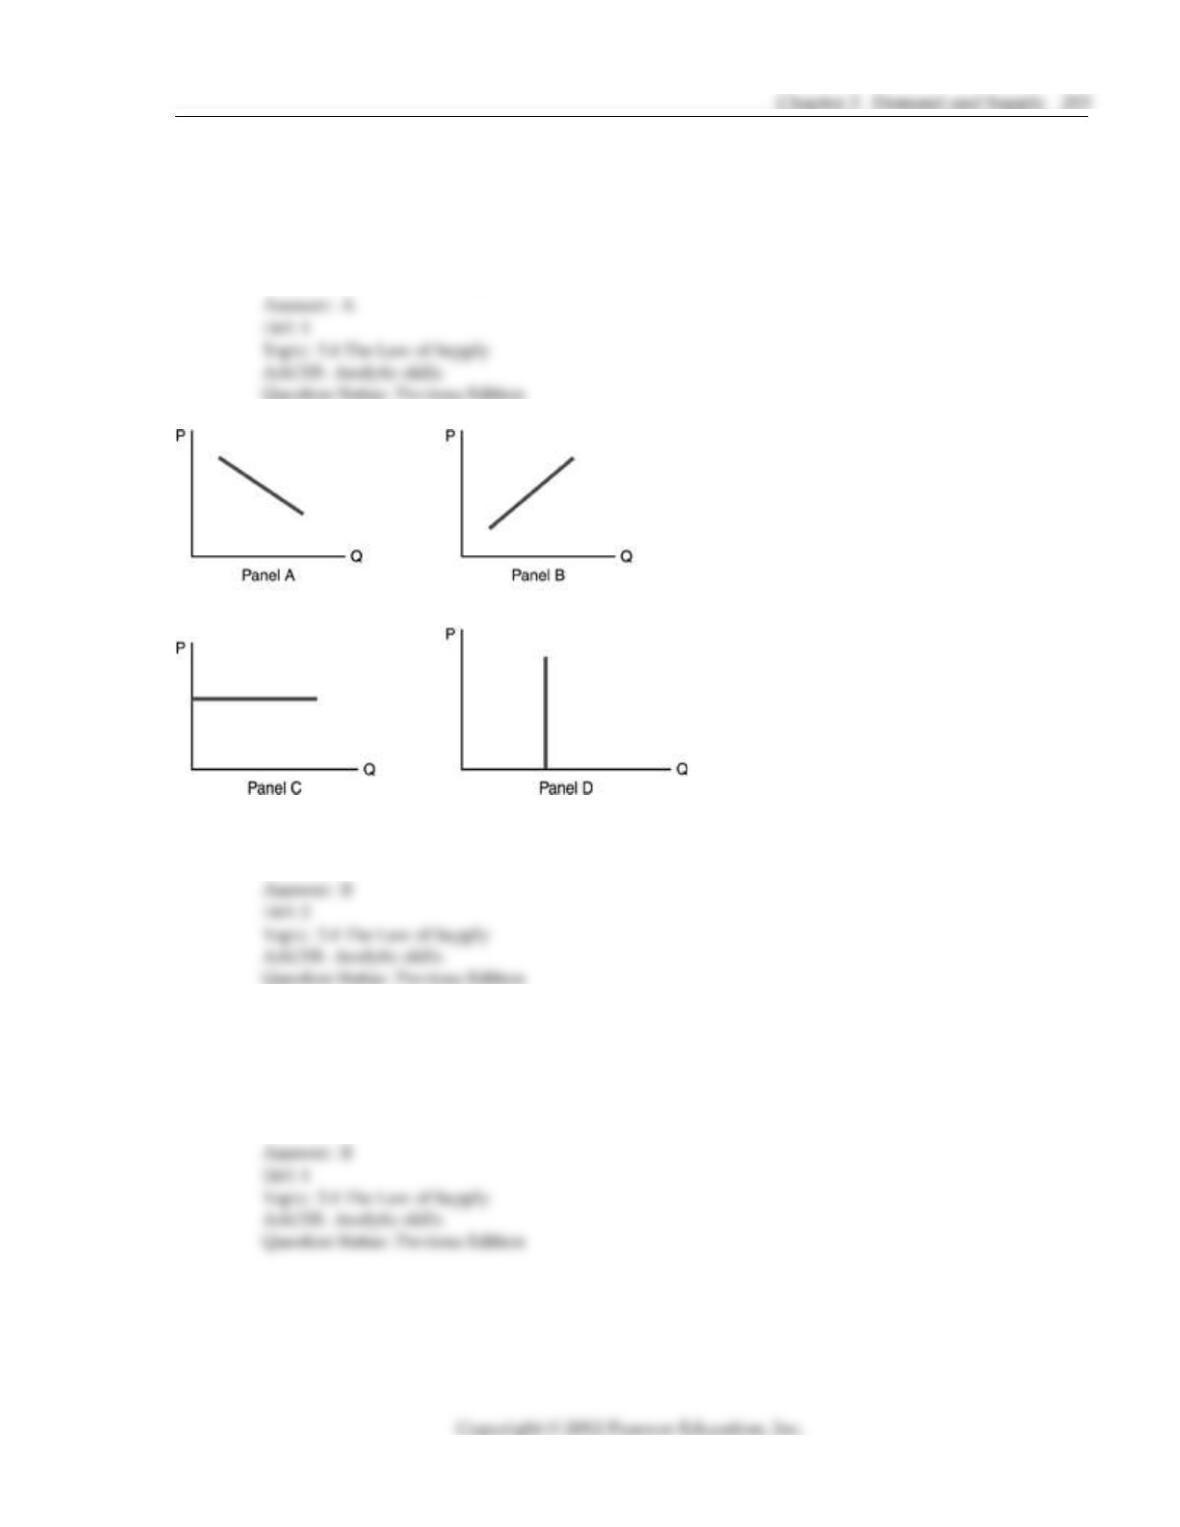
20) Refer to the above figure. Which panel demonstrates the law of supply?
A) Panel A. B) Panel B. C) Panel C. D) Panel D.
21) The relationship between quantity supplied and the price of output is such that
A) an increase in quantity will automatically lead to a reduction in price.
B) an increase in price will lead to an increase in quantity supplied.
C) an increase in price will produce an inward shift in the supply curve.
D) quantity will decrease as the number of firms increases.
22) Explain why there is a direct relationship between price and quantity supplied.
23) State the law of supply and explain it.
3.5 The Supply Schedule
1) For typical goods, supply curves are
A) downward sloping. B) upward sloping.
C) horizontal. D) vertical.
2) Which one of the following statements is FALSE?
A) There is an inverse (negative) relationship between product price and quantity supplied.
B) There is some price at which quantity supplied of a product is zero.
C) As product price increases, producers are willing to put more of the good on the market
for sale.
D) In order to entice producers to offer more of a product on the market for sale, product
price must rise.
3) If the price of a product increases, we would expect
A) the level of demand to decrease. B) quantity supplied to increase.
C) the level of supply to increase. D) an increase in quantity demanded.
4) The relationship between quantity supplied and price is usually
A) an inverse relationship. B) a direct relationship.
C) a negative relationship. D) impossible to determine.
5) Which of the following statements about a supply curve is FALSE?
A) It shows a direct (positive) relationship between price and quantity supplied.
B) It shows the quantity supplied at each specific price.
C) It typically slopes downward to the right.
D) It has a positive slope.
6) A supply schedule
A) can be used to generate a supply curve.
B) is a table reflecting the inverse relationship between price and quantity supplied.
C) shows what happens to quantity supplied when price is held constant.
D) all of the above.
7) Last year there were 6 pizza shops in town. This year there are only 4. Other things being equal,
the decrease in the number of suppliers will
A) cause the market supply curve to shift to the right.
B) increase the market demand for pizza.
C) cause a decrease in the quantity supplied at each price.
D) have no impact on market supply as long as the demand for pizza remains strong.
8) The market supply curve is found by
A) surveys of consumer groups.
B) vertically summing up the equilibrium prices of individual firms.
C) horizontally summing up the supply curves of individual firms.
D) estimating what the supply curve would be of one huge firm large enough to serve the
entire market.
9) A direct or positive relationship between price and quantity supplied is
A) the market clearing price. B) a change in demand.
C) a supply curve. D) a demand curve.
10) A supply curve
A) has an indirect or negative relationship between price and quantity supplied.
B) has a direct or positive relationship between price and quantity supplied.
C) shows the relationship between quantity supplied and income.
D) shows the relationship between complements.
11) Which of the following causes a movement along a supply curve?
A) a change in resource costs B) a change in technology
C) a change in the price D) all of the above
12) Market supply is obtained by
A) summing the amount demanded by individual consumers at various prices.
B) summing the amount supplied by individual producers at various prices.
C) the law of supply.
D) observing how the supply curve shifts.
13) Graphically, the market supply curve is obtained by
A) changing the ceteris paribus conditions.
B) a change in quantity supplied.
C) horizontally summing quantity supplied at various prices for individual producers.
D) vertically summing quantity supplied at various prices for individual producers.
Supplier 1 Supplier 2 Supplier 3
Quantity Supplied Quantity Supplied Quantity Supplied
Price (thousands) (thousands) (thousands)
8 11 7 20
7 8 6 15
6 5 5 10
5 2 4 5
14) Refer to the above table. The market quantity supplied when the price is $6 is
A) 0 B) 5 C) 10 D) 20
15) Refer to the above table. The market quantity supplied when the price is $7 is
A) 0 B) 20 C) 29 D) 38
16) The market supply curve is found by
A) plotting the supply curves of individual firms.
B) plotting and summing up the supply curves of individual firms.
C) plotting the supply curves of individual consumers.
D) taking the supply curve of the representative firm.
17) Total market supply can be derived by
A) horizontally summing individual supply curves at each and every price level.
B) vertically summing individual supply curves at the current technology level.
C) adding up the largest quantity demanded at various prices.
D) looking at the changes in the price of raw materials needed to produce the product.
18) The market supply curve can be derived by
A) vertically adding the individual supplies at each quantity level.
B) multiplying the price and quantity supplied at each price level.
C) horizontally adding the individual supplies at each price level.
D) looking at the capacity utilization in the largest firms in the industry.
19) The supply curve has a
A) negative slope. B) positive slope.
C) slope equal to 1. D) undefined slope.
20) The supply curve shows the relationship between the
A) cost of production and the price of the product.
B) cost of resources and cost of production.
C) price of the product and quantity supplied.
D) quantity demanded and the quantity supplied.
21) Suppose that because of unseasonably cold weather in Florida, a significant portion of the
orange crop has been lost to freezing temperatures. This statement means that
A) the demand for oranges will rise.
B) the equilibrium quantity of oranges will rise.
C) the amount of oranges available at various prices will decline.
D) the price of oranges will fall.
3.6 Shifts in Supply
1) Other things being equal, an increase in wages paid to workers in the steel industry will cause
A) the quantity of steel demanded to increase.
B) the quantity of steel supplied to decrease.
C) the supply of steel to decrease.
D) the demand for steel to decrease.
2) Sugar is an input used to produce cereal. Suppose that the price of sugar rises. As a result,
A) the supply curve for sugar will shift to the right.
B) the supply curve for sugar will shift to the left.
C) the supply curve for cereal will shift to the right.
D) the supply curve for cereal will shift to the left.
3) An improvement in technology in the production of computers would
A) increase the demand for computers. B) increase the supply of computers.
C) decrease the demand for computers. D) decrease the supply of computers.
4) A per unit government subsidy to producers of a good tends to
A) reduce the supply of the good.
B) increase the supply of the good.
C) shift the supply curve to the left.
D) not have any effect on the good s supply.
5) In the long run, the number of firms in an industry may change. If the number of firms
increases, then
A) the supply curve will shift outward to the right.
B) the demand curve will shift outward to the right.
C) the supply curve will shift inward to the left.
D) the demand curve will shift inward to the left.
6) Any improvement in overall production technology that permits more output to be produced
with the same level of inputs causes
A) a movement up the supply curve resulting in both a higher equilibrium price and
quantity.
B) a rightward shift of the supply curve so that more is offered at each price.
C) no movement of the supply curve, but a fall in price and a decrease in quantity supplied.
D) a leftward shift of the supply curve so that less is offered for sale at each price.
7) If more foreign auto plants relocate to the United States, we would expect
A) the U.S. supply curve for automobiles to shift to the right.
B) the U.S. supply curve for automobiles would shift to the left.
C) that the U.S. auto market would not respond.
D) that U.S. auto demand might change, but U.S. auto supply would remain static.
8) Which of the following is a determinant of supply?
A) Tastes and preferences of consumers B) Technology
C) Consumer income D) Number of consumers
9) All of the following will cause a shift in the supply of jeans EXCEPT
A) a decrease in the prices of jeans.
B) an increase in the cost of producing jeans.
C) a per unit government subsidy on the production of jeans.
D) a decrease in the number of jean manufacturers.
10) Which of the following will shift today s supply curve to the right?
A) Input prices rise.
B) Sales taxes increase.
C) Prices are expected to be higher in the future.
D) Prices are expected to be lower in the future.
11) In general, any ceteris paribus determinant of supply that is favorable to production will
A) cause a movement along the supply curve.
B) shift the supply curve to the right.
C) shift the demand curve to the left.
D) shift the supply curve to the left.
12) Other things being constant, the only way to move along a given supply curve for a product is
for
A) the product s relative price to change.
B) the future relative price of related goods to change.
C) the number of sellers to change.
D) technological changes to occur.
13) The effects of a per unit tax imposed on sales of an industry s product would likely include
A) a lower product price at any amount of the product supplied.
B) a leftward shift of the market supply curve for the product.
C) a leftward movement along the market supply curve for the product.
D) none of the above.
14) If the government imposes a per unit tax on sales of an industry s product, then we would
expect
A) the supply curve in that industry would shift to the left.
B) the supply curve in that industry would shift to the right.
C) the demand curve for that industry would shift to the right.
D) the demand curve for that industry would shift to the left.
15) If the price of cotton used in making blue jeans increases, which of the following will occur?
A) There will be a movement along an unchanged supply curve for jeans.
B) The supply curve for jeans will shift rightward.
C) The supply curve for jeans will shift leftward.
D) There will be a rightward shift in the supply curve for jeans, followed by a movement
along the supply curve.
16) Which of the following will cause an outward (rightward) shift in the supply curve?
A) A reduction in the price of the good
B) An increase in the price of labor input
C) An increase in the number of consumers
D) Technological progress
17) All of the following will cause the supply curve of good A to shift rightward EXCEPT
A) a reduction in the prices of inputs used to produce good A.
B) an increase in the number of firms in the industry producing good A.
C) a decrease in the per unit tax on good A which producers must pay.
D) an increase in the market price of good A.
18) How does a change in quantity supplied differ from a change in supply?
A) A change in quantity supplied shifts the supply curve; a change in supply is a movement
along the curve.
B) A change in one of the ceteris paribus conditions affects quantity supplied, not supply.
C) A change in the price affects quantity supplied, not supply.
D) There is no difference.
19) There is a 15 percent increase in the price of lumber used by a firm that builds new homes. This
causes
A) a decrease in the quantity of new homes supplied.
B) an increase in the supply of new homes.
C) an increase of the quantity supplied of new homes.
D) a decrease in the supply of new homes.
20) Suppose that milk producers expect that the price of milk is going to drop next week. This
would cause
A) a decrease in the supply of milk today.
B) an increase in the supply of milk today.
C) an increase in the demand for milk today.
D) the selling price of milk to rise today.
21) Each of the following would cause an increase in the supply of baseballs EXCEPT
A) an improvement in technology.
B) a decrease in the cost of labor used to produce baseballs.
C) an expectation that the price of baseballs will rise in the future.
D) an increase in the number of baseball producers.
22) Which of the following does NOT cause a rightward shift in the supply curve?
A) a reduction in resource costs
B) an increase in technology
C) a reduction in the price of the good
D) a reduction in the expected future price of the good
23) A change in the price of a good causes
A) an increase in supply.
B) a decrease in supply.
C) an increase in demand and a decrease in supply.
D) a change in quantity supplied.
24) A change in the ceteris paribus conditions for supply will lead to a
A) change in quantity supplied.
B) change in supply.
C) change in quantity supplied and a change in supply.
D) change in how consumers view the quality of the good.
25) An increase in supply will occur when
A) the supply curve shifts downward to the right.
B) the supply curve shifts upward to the left.
C) the demand curve shifts downward to the left.
D) the demand curve shifts upward to the right.
26) A decrease in supply will occur when
A) the supply curve shifts downward to the right.
B) the supply curve shifts upward to the left.
C) the demand curve shifts downward to the left.
D) the demand curve shifts upward to the right.
27) There will be an increase in supply when
A) a consumer s income increases. B) there is an improvement in technology.
C) the demand curve shifts. D) the market price rises from $3 to $4.
28) Which of the following statements is consistent with an increase in supply?
A) The price of labor input has increased.
B) There has been an advance in technology.
C) Consumers incomes have increased.
D) The market price has decreased.
29) Which of the following statements is consistent with a decrease in supply?
A) Prices of raw material inputs have increased.
B) There has been an advance in technology.
C) Consumers incomes have increased.
D) The market price has decreased.
30) An increase in the price of input used to produce a product will lead to
A) a decrease in the demand for that product.
B) a decrease in quantity supplied of that product
C) a decrease in the supply of that product.
D) an increase in the supply of that product.
31) An increase in the price of steel to producers of refrigerators will cause
A) the quantity demanded for steel to increase.
B) the demand for refrigerators to decrease.
C) the quantity supplied of refrigerators to increase.
D) the supply curve for refrigerators to shift left.
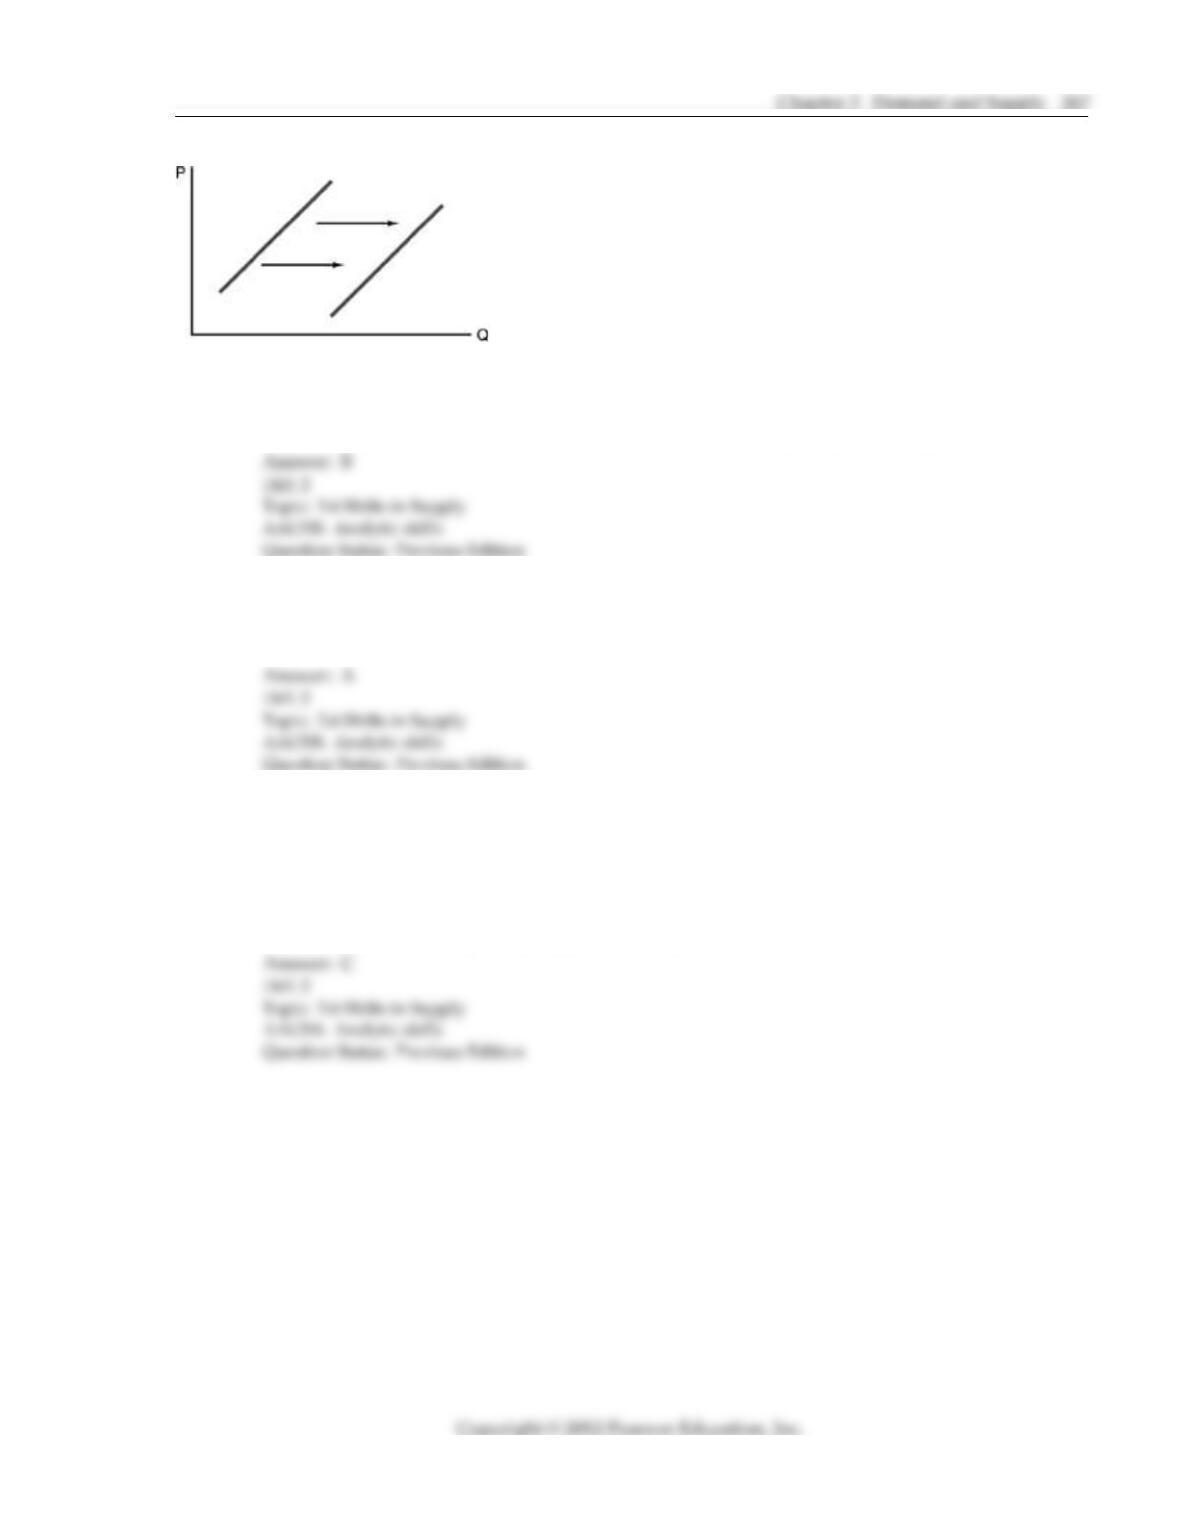
32) Refer to the above figure. The rightward shift of the curve indicates
A) an increase in demand. B) an increase in supply.
C) a change in quantity demanded. D) a change in quantity supplied.
33) Refer to the above figure. The rightward shift of the curve could have been caused by
A) a technological improvement. B) a technological setback.
C) an increase in income. D) a decrease in income.
34) Which of the following is a likely result of the dramatic decrease in the price of microprocessor
chips to computer manufacturers in the last two decades?
A) An increase in the demand for computers.
B) A decrease in the supply of diskettes.
C) An increase in the supply of computers.
D) An increase in the quantity supplied of computers.
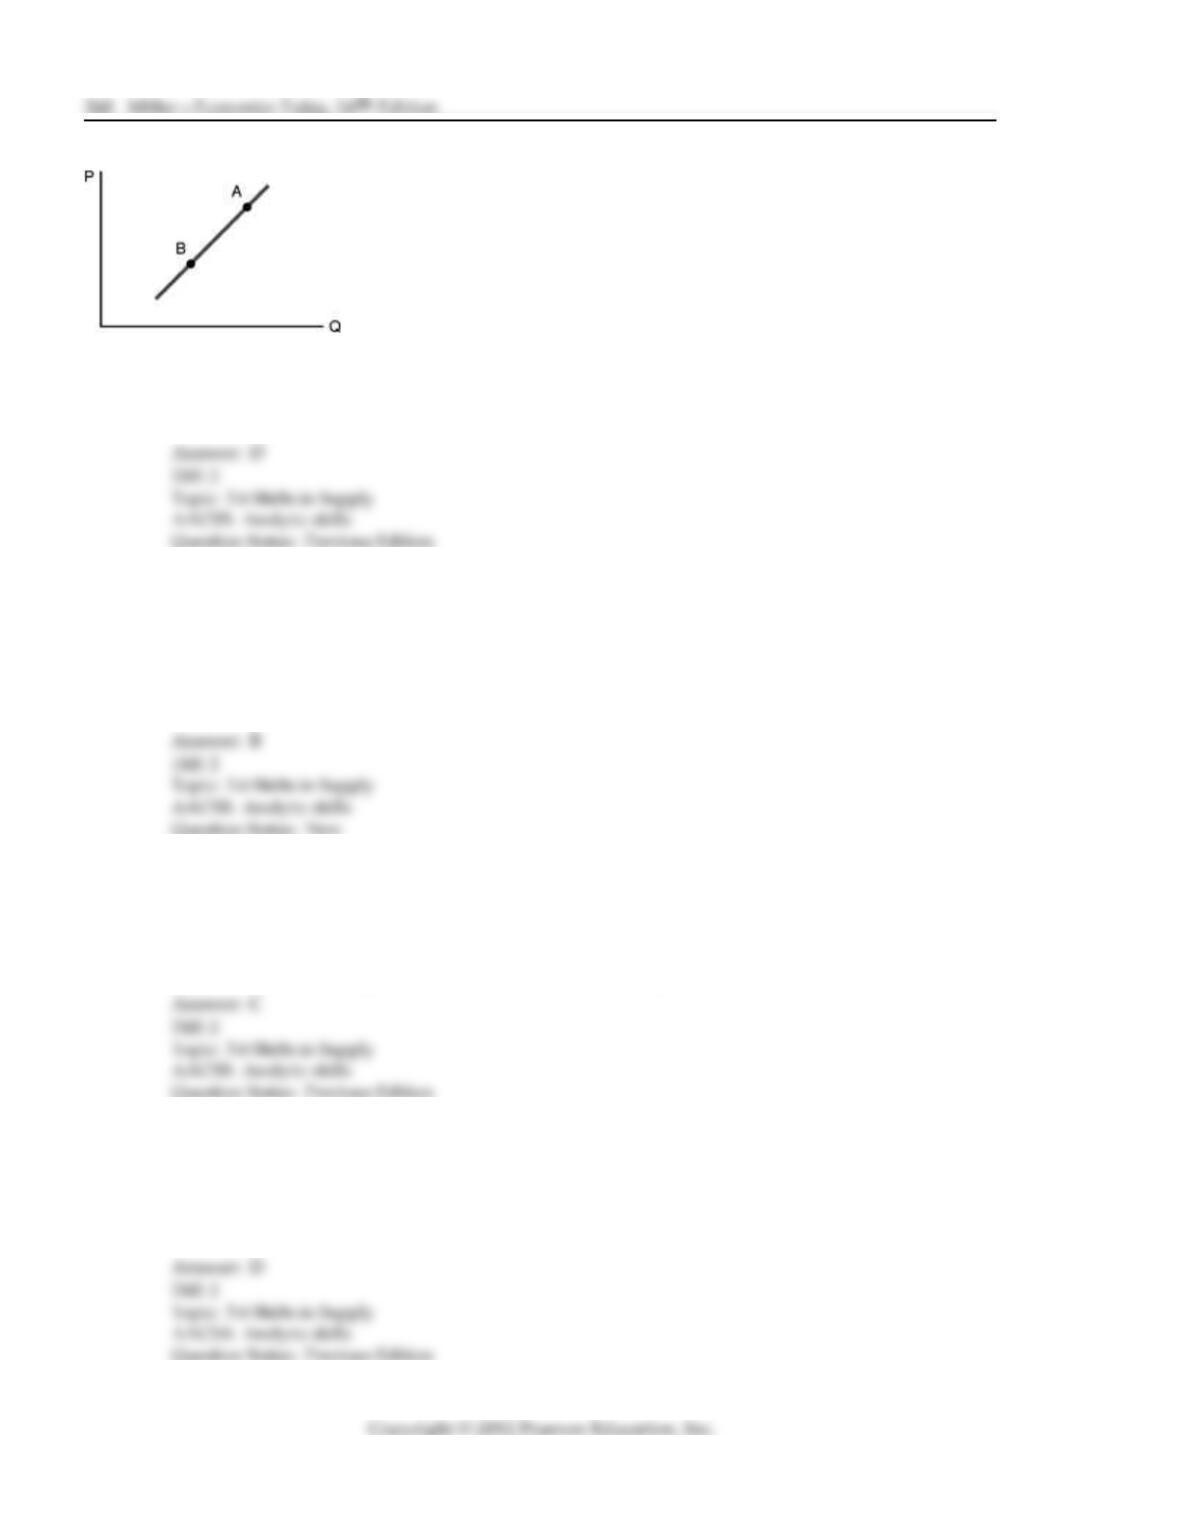
35) Refer to the above figure. Moving from point A to point B indicates
A) An increase in supply. B) An increase in quantity supplied.
C) A decrease in supply. D) A decrease in quantity supplied.
36) Refer to the above figure. A movement from point A to point B for a good is most likely a result
of
A) an increase in the price of that good.
B) a decrease in the price of that good.
C) an expectation of an increase in the relative price of that good.
D) an expectation of a decrease in the relative price of that good.
37) A subsidy to carrot farmers will
A) increase the quantity of carrots demanded.
B) decrease the quantity of carrots supplied.
C) increase the supply of carrots.
D) leave both the supply and demand of carrots unchanged.
38) Which of the following will NOT affect the supply of cars?
A) an increase in the price of steel
B) an improvement in automobile production technology
C) an increase in the productivity of auto workers
D) a decrease in the price of cars