Chapter 3/Interdependence and the Gains from Trade ❖ 61
133. Refer to Table 3-11. Varick has an absolute advantage in the production of
a.
wheat.
b.
cloth.
c.
both goods.
d.
neither good.
134. Refer to Table 3-11. Falda has a comparative advantage in the production of
a.
wheat.
b.
cloth.
c.
both goods.
d.
neither good.
135. Refer to Table 3-11. Varick has a comparative advantage in the production of
a.
wheat.
b.
cloth.
c.
both goods.
d.
neither good.
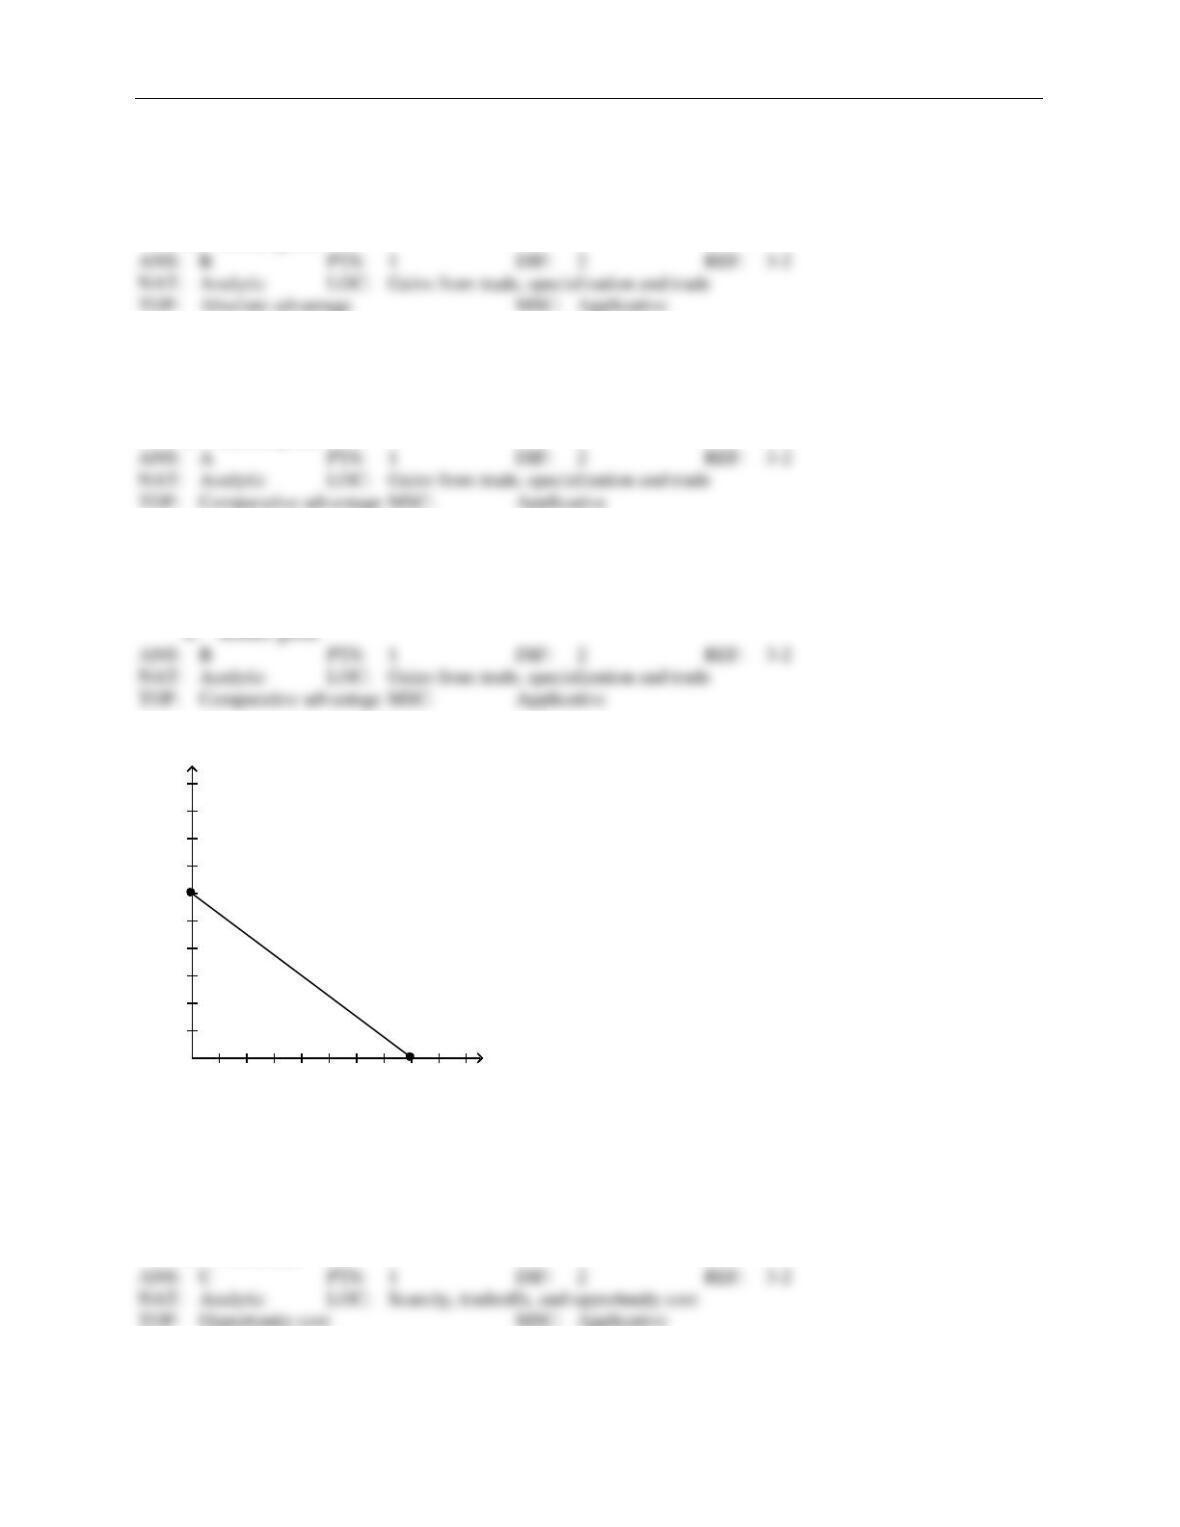
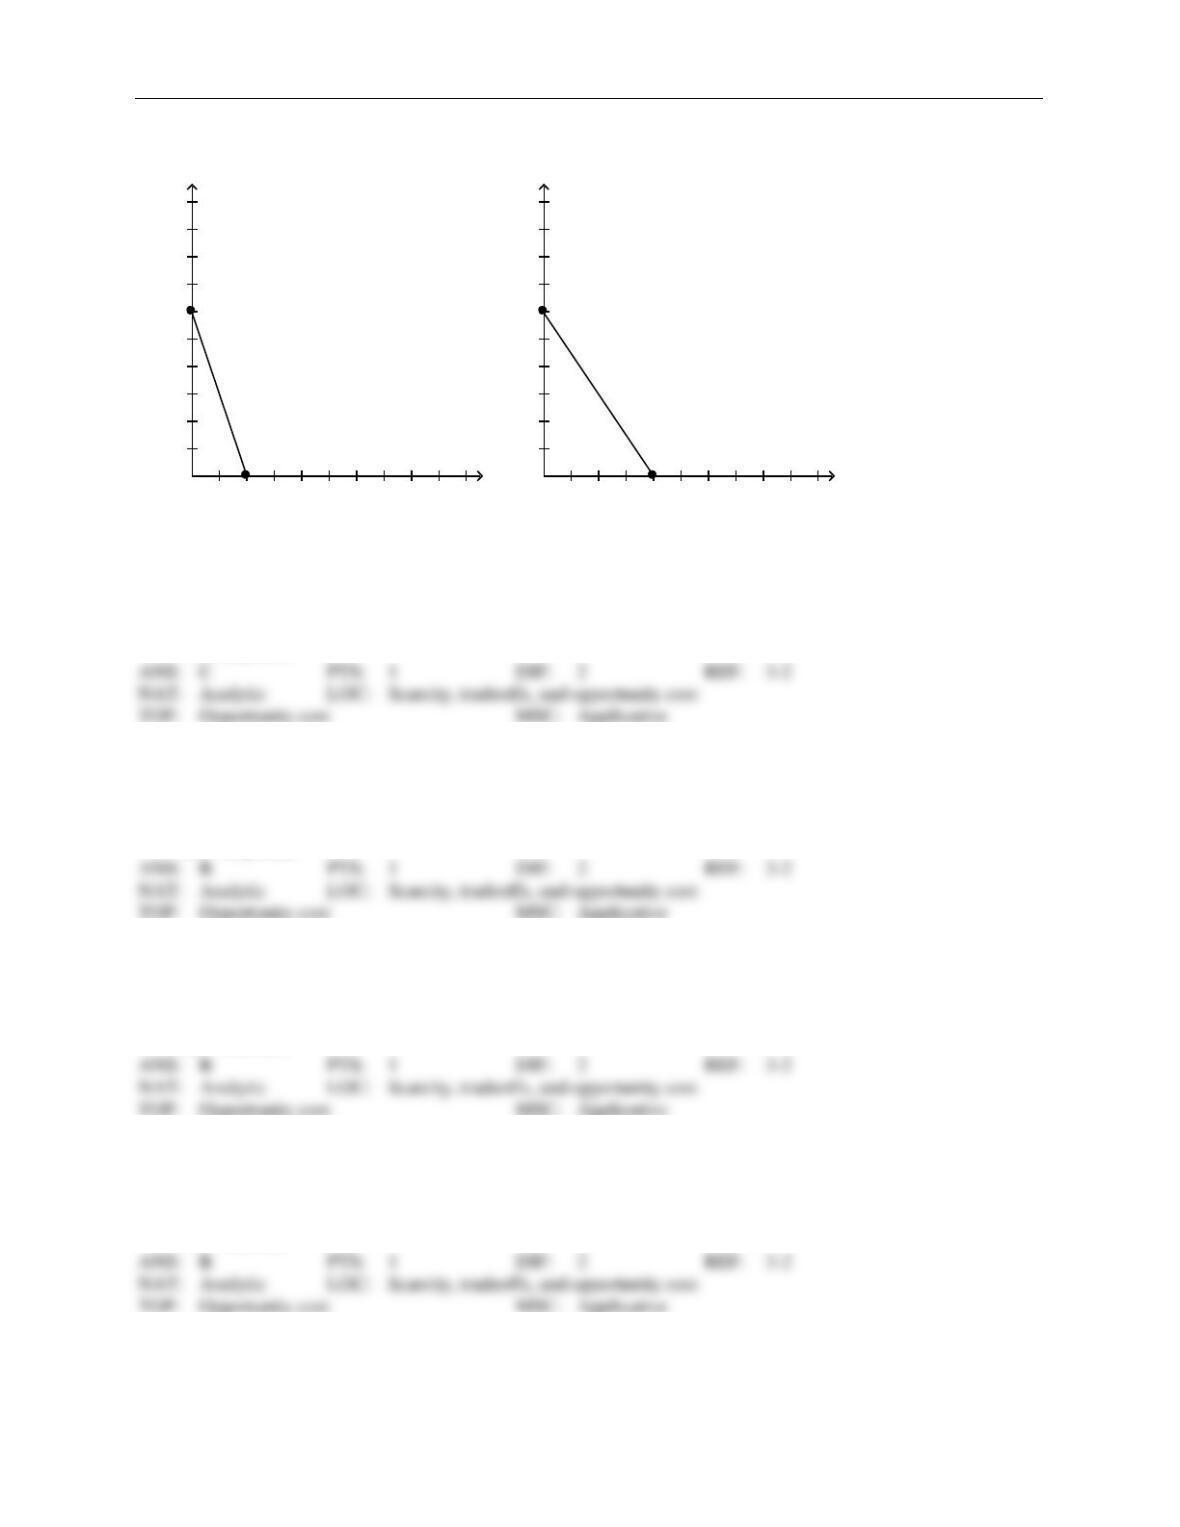
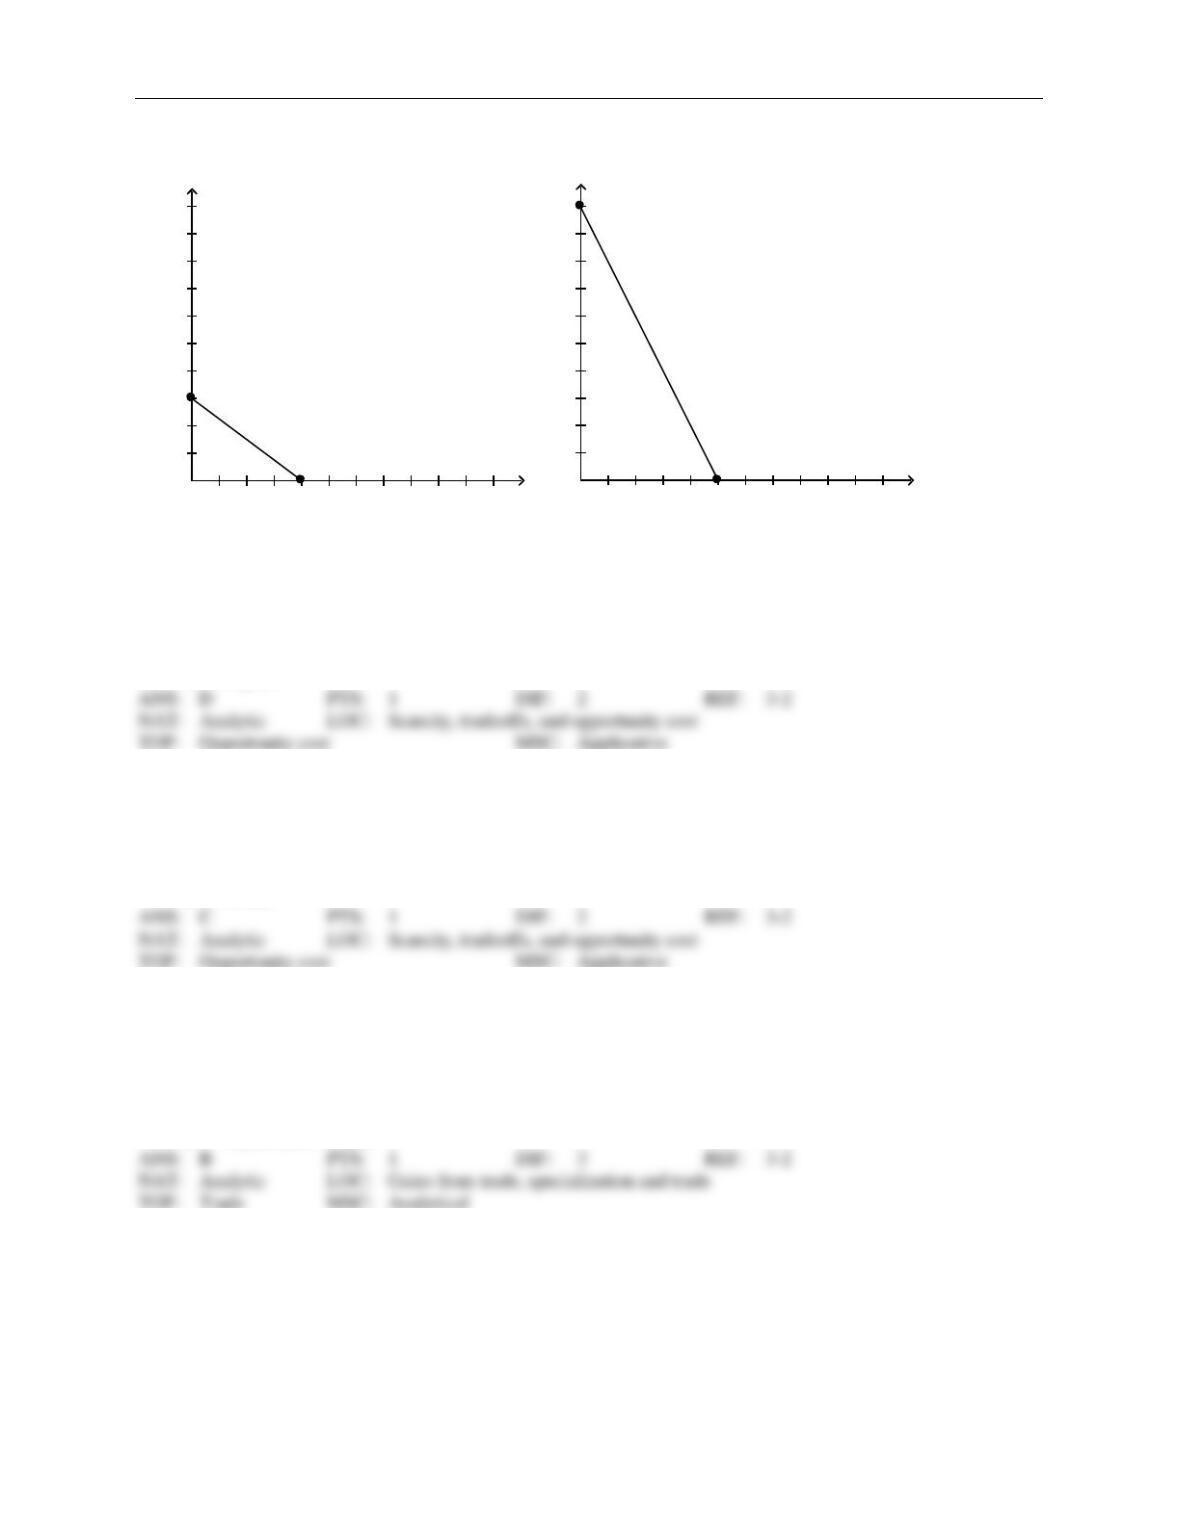
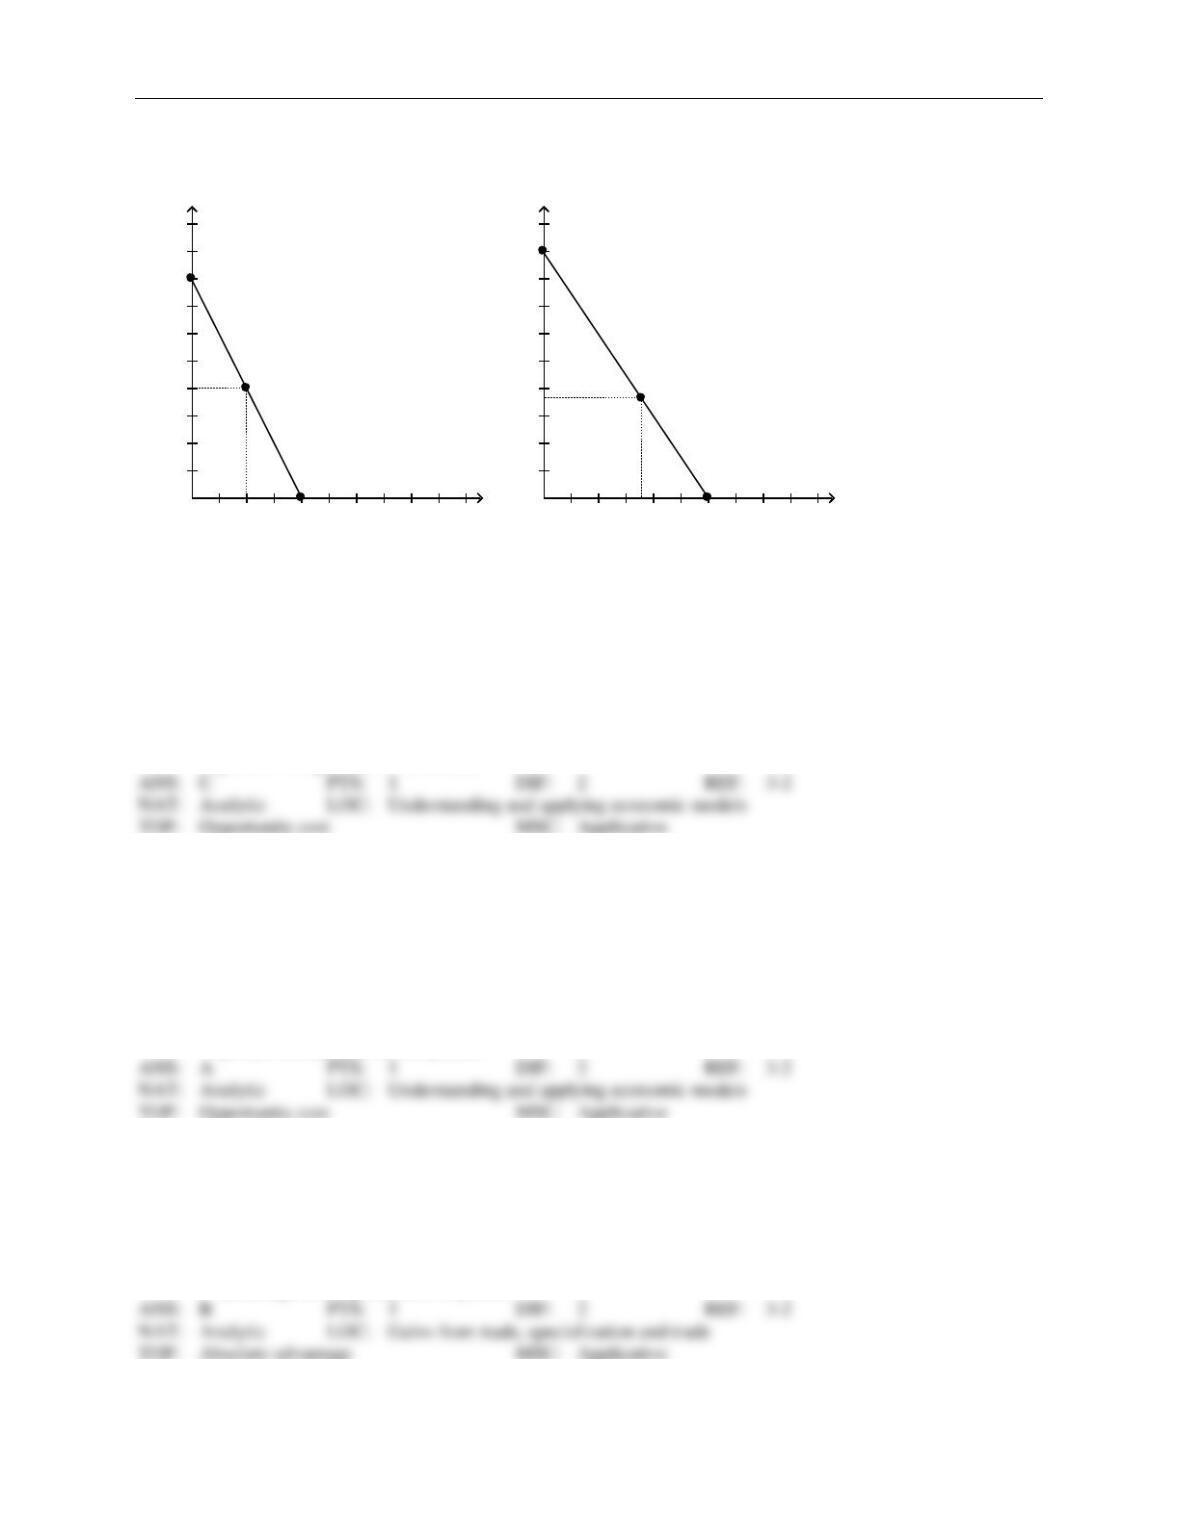
Figure 3-2
Peru’s Production Possibilities Frontier
1 2 3 4 5 6 7 8 emeralds
40
80
120
160
200
240
280
320
360
400 rubies
136. Refer to Figure 3-2. Suppose Peru decides to increase its production of rubies by 30. What is the opportuni-
ty cost of this decision?
a.
1/8 emerald
b.
1/3 emerald
c.
1 emerald
d.
3 emeralds
62 ❖ Chapter 3/Interdependence and the Gains from Trade
137. Refer to Figure 3-2. Suppose Peru decides to increase its production of emeralds by 2. What is the oppor-
tunity cost of this decision?
a.
30 rubies
b.
40 rubies
c.
60 rubies
d.
120 rubies
138. Refer to Figure 3-2. Suppose Madagascar is willing to trade 40 rubies to Peru for each emerald that Peru
produces and sends to Madagascar. Which of the following combinations of emeralds and rubies could Peru
then consume, assuming Peru specializes in emerald production?
a.
2 emeralds and 240 rubies
b.
3 emeralds and 220 rubies
c.
4 emeralds and 200 rubies
d.
5 emeralds and 140 rubies
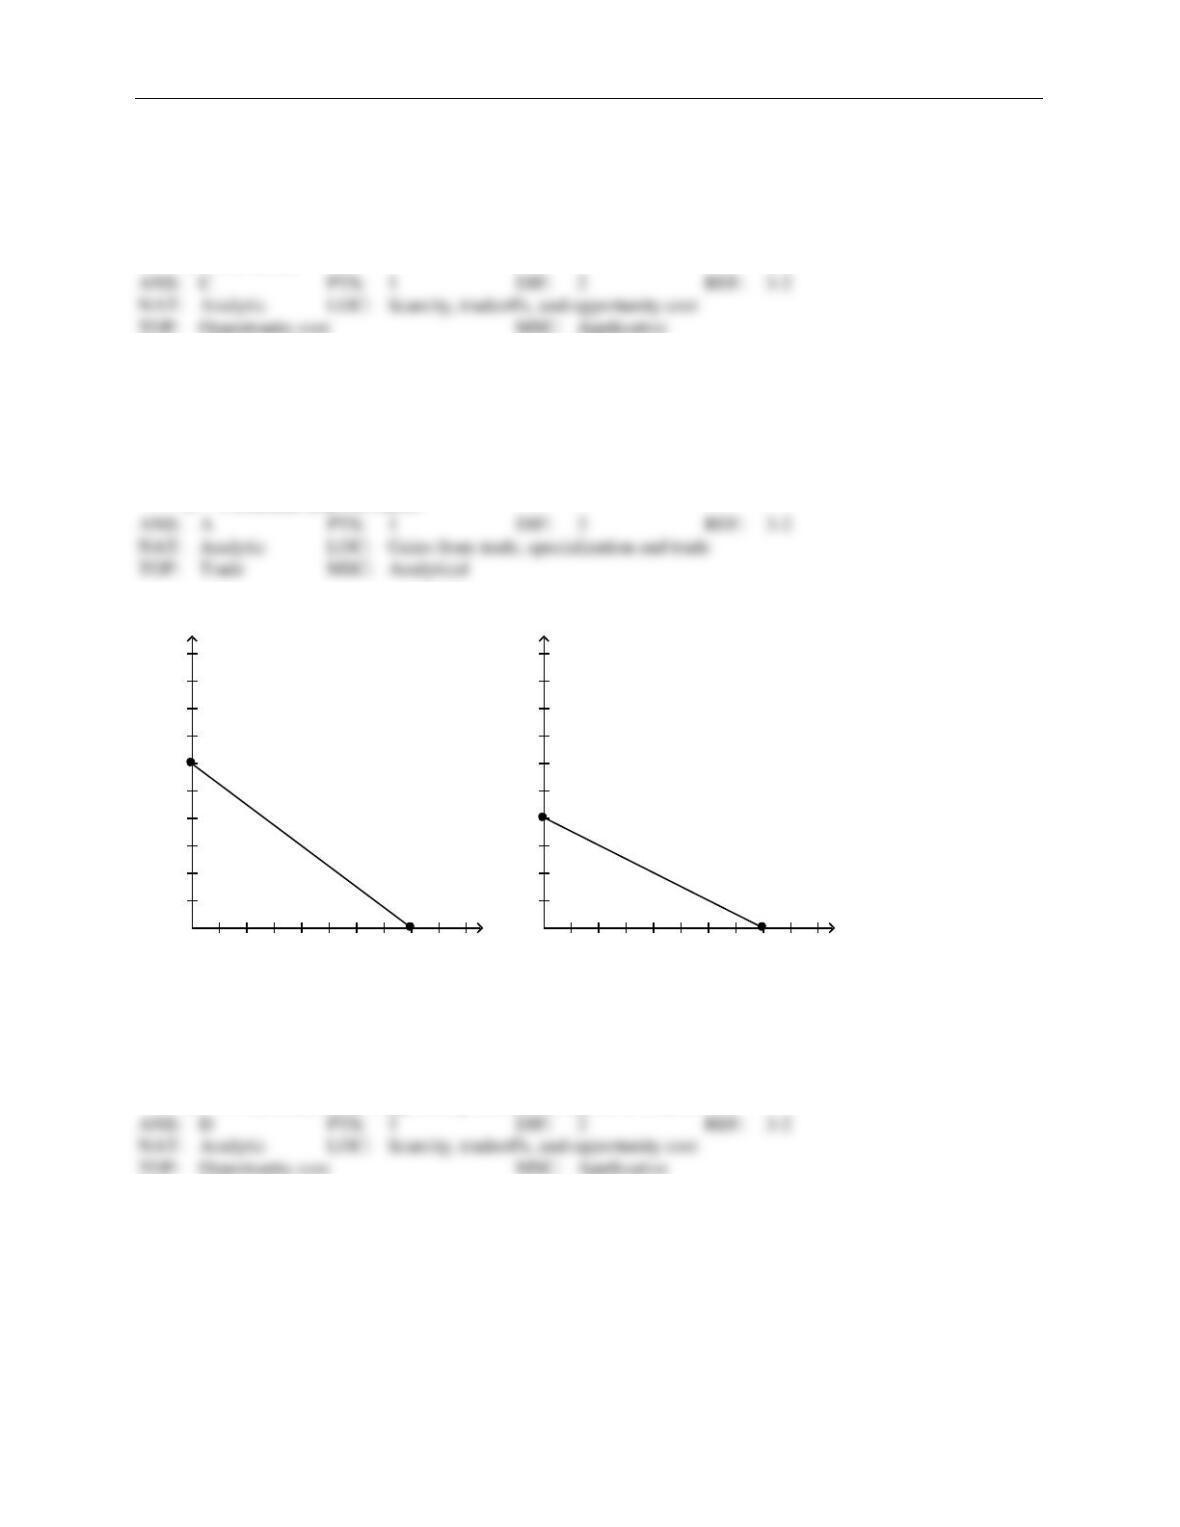
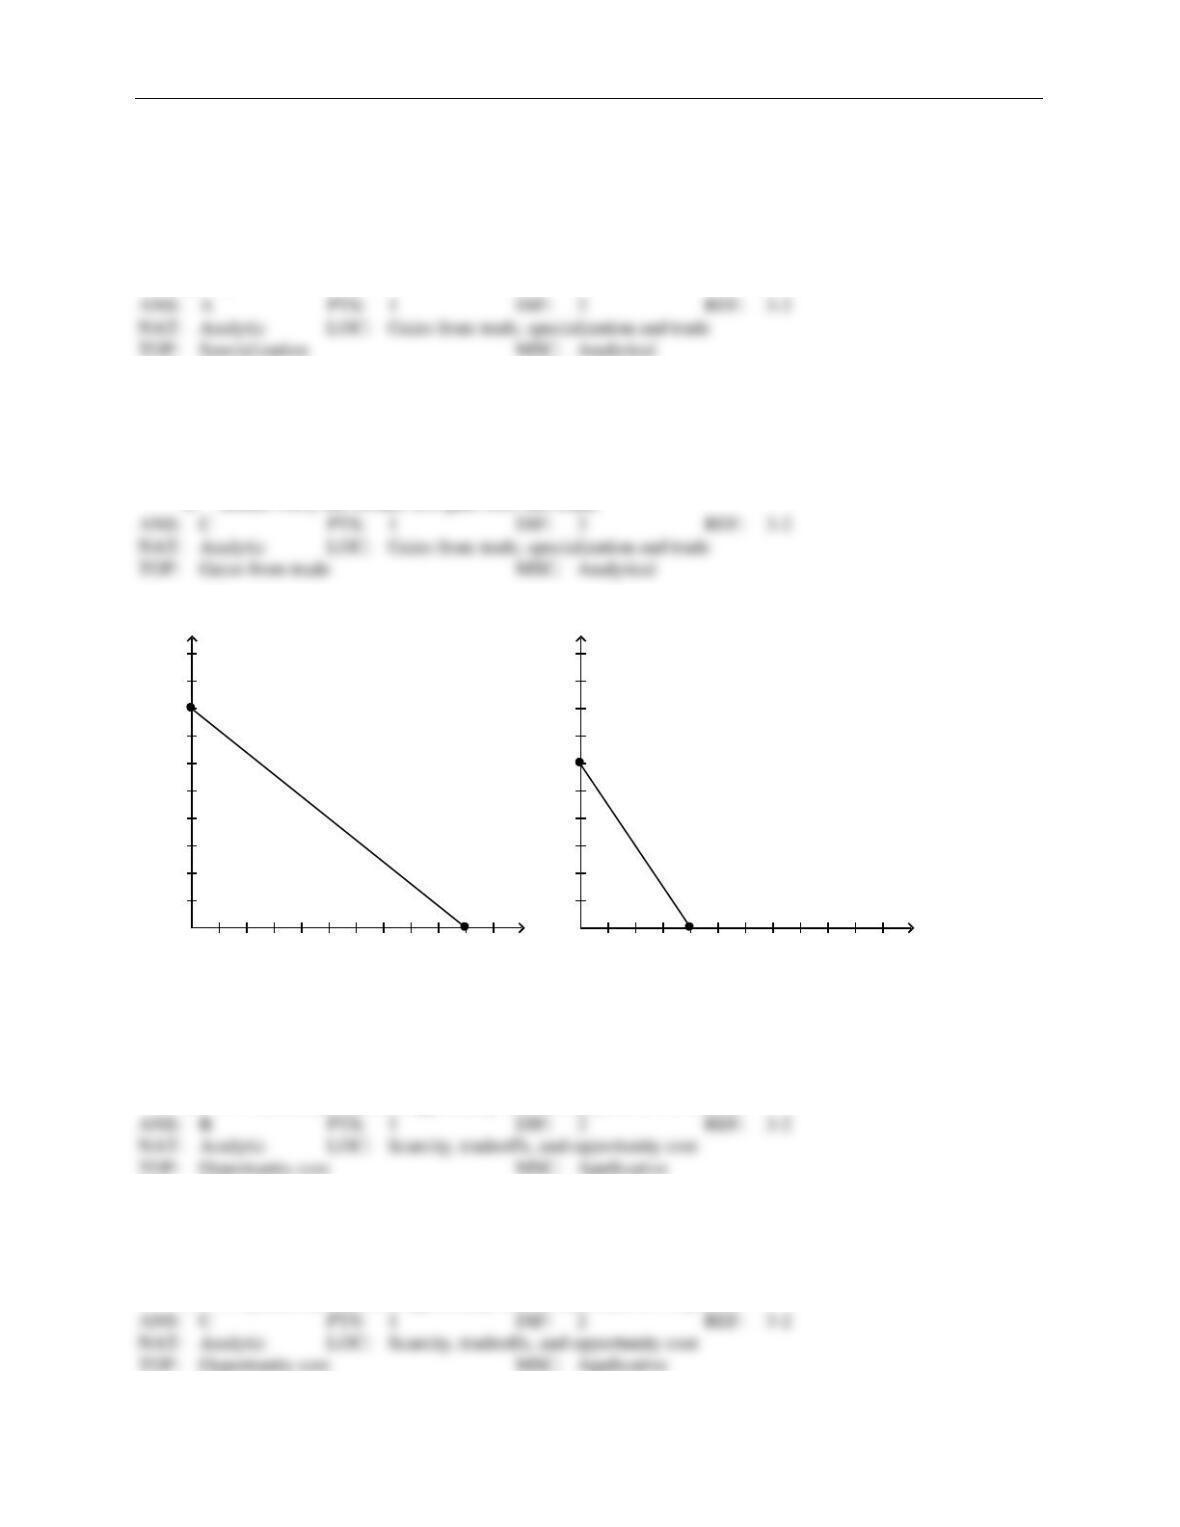
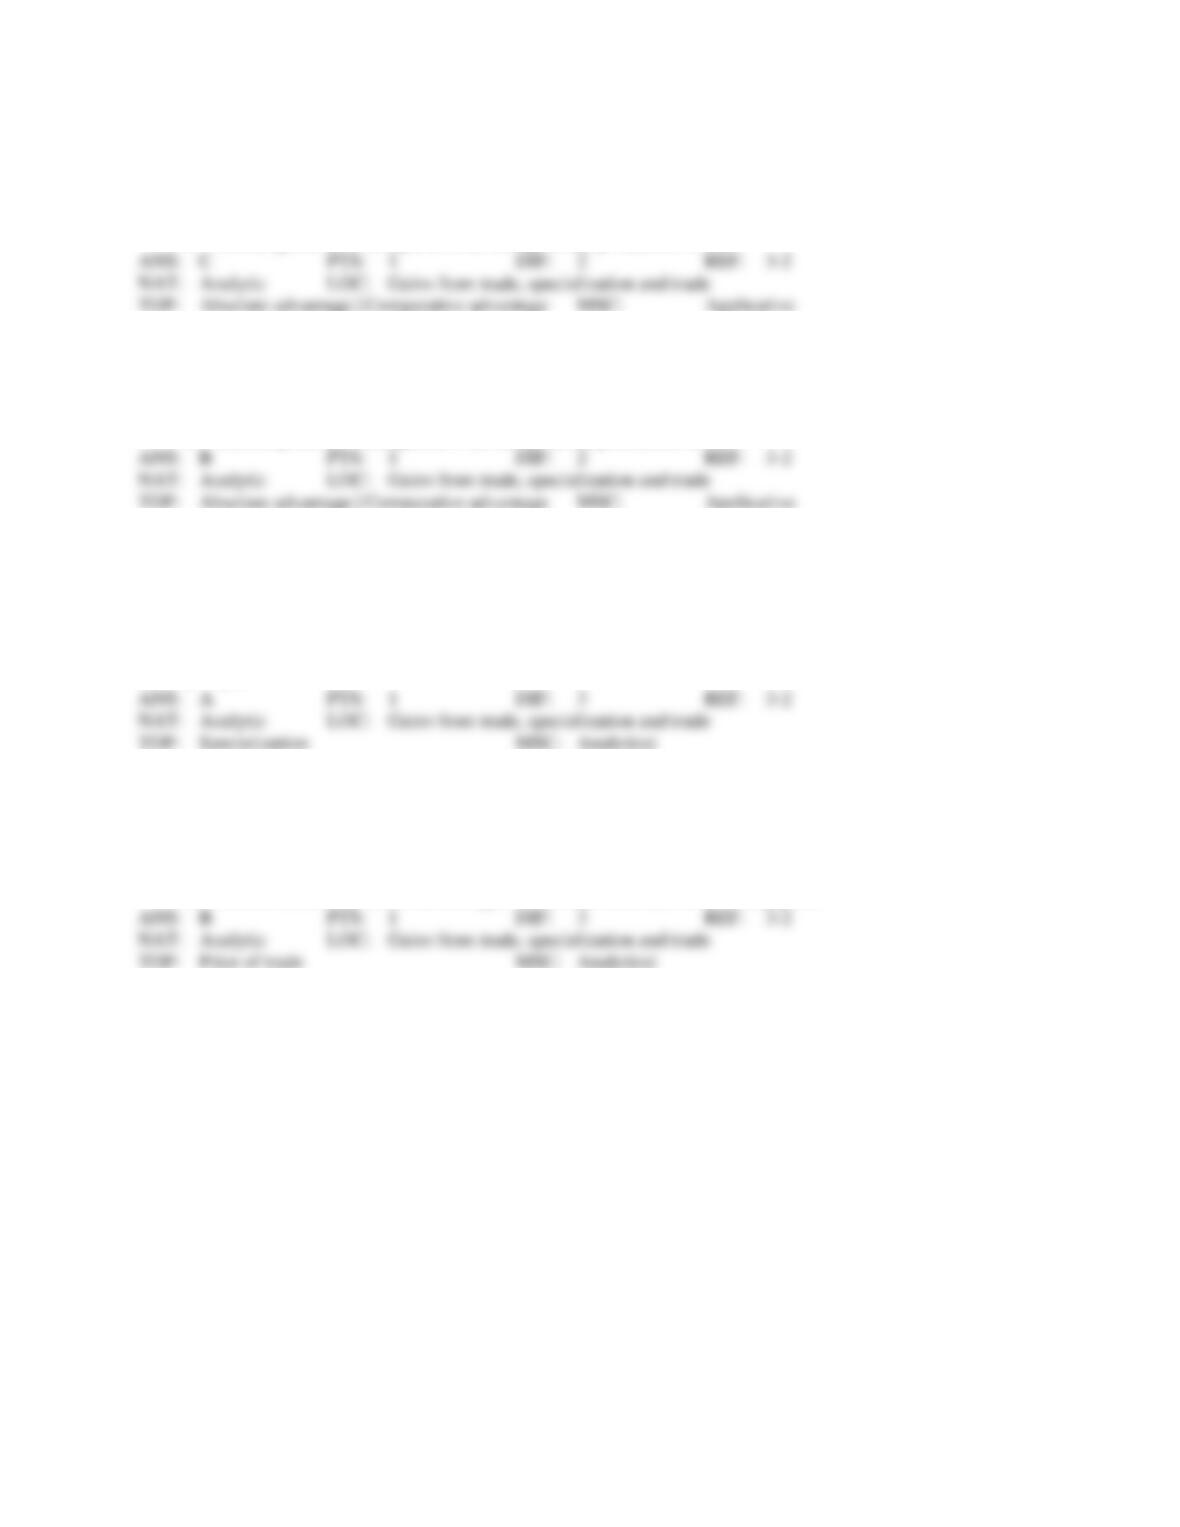
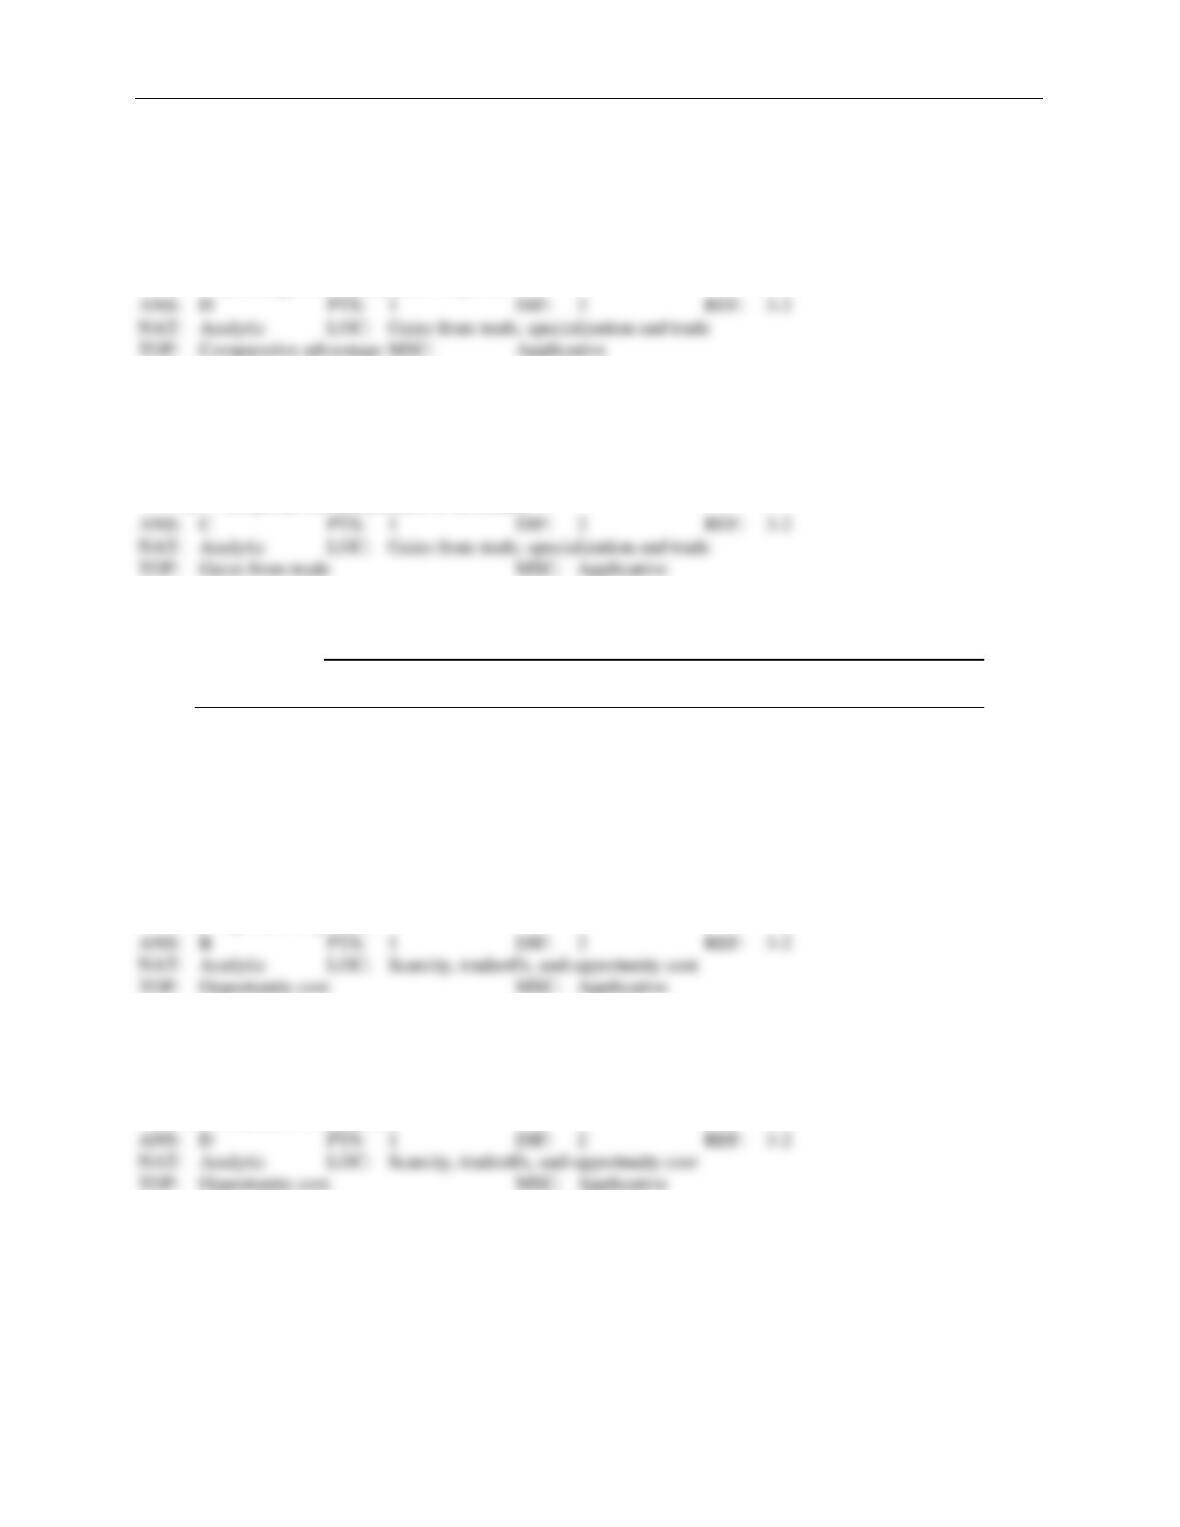
Figure 3-3
Arturo’s Production Possibilities Frontier
Dina’s Production Possibilities Frontier
50 100 150 200 250 300 350 400 tacos
50
100
150
200
250
300
350
400
450
500 burritos
50 100 150 200 250 300 350 400 tacos
50
100
150
200
250
300
350
400
450
500 burritos
139. Refer to Figure 3-3. Arturo’s opportunity cost of one burrito is
a.
3/4 taco and Dina’s opportunity cost of one burrito is 1/2 taco.
b.
3/4 taco and Dina’s opportunity cost of one burrito is 2 tacos.
c.
4/3 tacos and Dina’s opportunity cost of one burrito is 1/2 taco.
d.
4/3 tacos and Dina’s opportunity cost of one burrito is 2 tacos.
Chapter 3/Interdependence and the Gains from Trade ❖ 63
140. Refer to Figure 3-3. Arturo would incur an opportunity cost of 36 burritos if he increased his production of
tacos by
a.
27.
b.
48.
c.
108.
d.
144.
141. Refer to Figure 3-3. Which of the following is not correct?
a.
Arturo and Dina could each consume 100 tacos and 100 burritos without trade.
b.
Neither Arturo nor Dina could each consume 200 tacos and 200 burritos without trade.
c.
Arturo and Dina could each consume 200 tacos and 200 burritos with trade.
d.
Total consumption of burritos could not be 600 either with or without trade.
142. Refer to Figure 3-3. Suppose Arturo is willing to trade 6 burritos to Dina for each 10 tacos that Dina produc-
es and sends to Arturo. Which of the following combinations of tacos and burritos could Dina then consume,
assuming Dina specializes in taco production and Arturo specializes in burrito production?
a.
100 tacos and 200 burritos
b.
200 tacos and 130 burritos
c.
300 tacos and 60 burritos
d.
340 tacos and 40 burritos
143. Refer to Figure 3-3. Arturo has an absolute advantage in the production of
a.
burritos and a comparative advantage in the production of tacos.
b.
burritos and a comparative advantage in the production of burritos.
c.
neither good and a comparative advantage in the production of tacos.
d.
neither good and a comparative advantage in the production of burritos.
144. Refer to Figure 3-3. Dina has an absolute advantage in the production of
a.
burritos and a comparative advantage in the production of tacos.
b.
burritos and a comparative advantage in the production of burritos.
c.
neither good and a comparative advantage in the production of tacos.
d.
neither good and a comparative advantage in the production of burritos.
145. Refer to Figure 3-3. Arturo should specialize in the production of
a.
tacos and Dina should specialize in the production of burritos.
b.
burritos and Dina should specialize in the production of tacos.
c.
both goods and Dina should specialize in the production of neither good.
d.
neither good and Dina should specialize in the production of both goods.
64 ❖ Chapter 3/Interdependence and the Gains from Trade
146. Refer to Figure 3-3. If Arturo and Dina switch from each person dividing their time equally between the
production of tacos and burritos to each person spending all of their time producing the good in which they
have a comparative advantage, then total production of burritos will increase by
a.
50.
b.
100.
c.
150.
d.
300.
147. Refer to Figure 3-3. At which of the following prices would both Arturo and Dina gain from trade with each
other?
a.
12 burritos for 21 tacos
b.
12 burritos for 27 tacos
c.
12 burritos for 36 tacos
d.
Arturo and Dina could not both gain from trade with each other at any price.
148. Refer to Figure 3-3. Arturo and Dina would not be able to gain from trade if Dina’s opportunity cost of one
taco changed to
a.
1/2 burrito.
b.
3/4 burrito.
c.
4/3 burritos.
d.
2 burritos.
149. Refer to Figure 3-3. Without trade, Arturo produced and consumed 240 tacos and 120 burritos and Dina pro-
duced and consumed 100 tacos and 150 burritos. Then, each person agreed to specialize in the production of
the good in which they have a comparative advantage and trade 260 tacos for 156 burritos. As a result, Arturo
gained
a.
20 tacos and 24 burritos and Dina gained 40 tacos and 6 burritos.
b.
20 tacos and 36 burritos and Dina gained 160 tacos and 6 burritos.
c.
260 tacos and 144 burritos and Dina gained 140 tacos and 156 burritos.
d.
260 tacos and 156 burritos and Dina gained 260 tacos and 156 burritos.
Chapter 3/Interdependence and the Gains from Trade ❖ 65
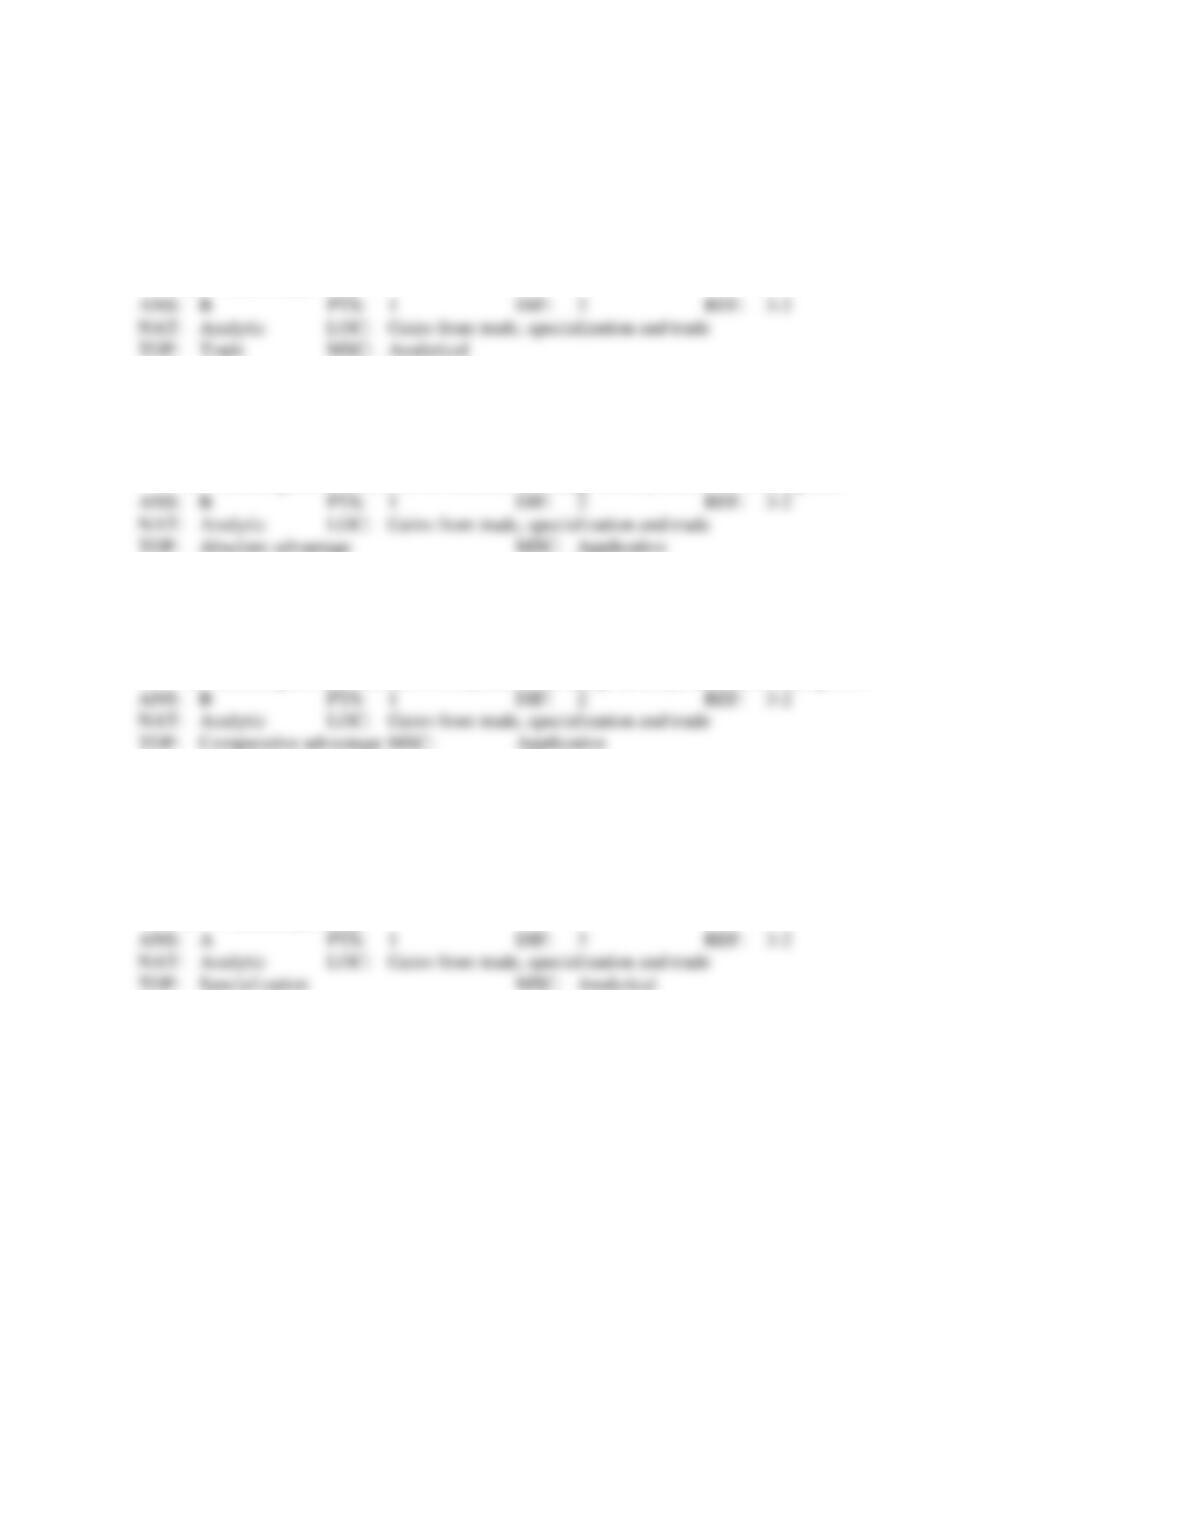
Figure 3-4
Perry’s Production Possibilities Frontier
Jordan’s Production Possibilities Frontier
1 2 3 4 5 6 7 8 novels
2
4
6
8
10
12
14
16
18
20 poems
1 2 3 4 5 6 7 8 novels
2
4
6
8
10
12
14
16
18
20 poems
150. Refer to Figure 3-4. The opportunity cost of 1 novel for Perry is
a.
1/6 poem.
b.
2 poems.
c.
6 poems.
d.
12 poems.
151. Refer to Figure 3-4. The opportunity cost of 1 novel for Jordan is
a.
1/3 poem.
b.
3 poems.
c.
4 poems.
d.
12 poems.
152. Refer to Figure 3-4. The opportunity cost of 1 poem for Perry is
a.
1/12 novel.
b.
1/6 novel.
c.
2 novels.
d.
6 novels.
153. Refer to Figure 3-4. The opportunity cost of 1 poem for Jordan is
a.
1/2 novel.
b.
1/3 novel.
c.
3 novels.
d.
4 novels.
66 ❖ Chapter 3/Interdependence and the Gains from Trade
154. Refer to Figure 3-4. Which of the following is not correct?
a.
Perry and Jordan could each consume 2 novels and 6 poems without trade.
b.
Jordan could consume 2 novels and 6 poems both with and without trade.
c.
Perry and Jordan could each consume 2 novels and 6 poems with trade.
d.
Perry and Jordan could each consume 12 poems without trade.
155. Refer to Figure 3-4. Suppose Perry is willing to trade 4 poems to Jordan for each novel that Jordan writes
and sends to Perry. Which of the following combinations of novels and poems could Jordan then consume,
assuming Jordan specializes in novel production and Perry specializes in poem production?
a.
1 novel and 14 poems
b.
2 novels and 8 poems
c.
3 novels and 6 poems
d.
4 novels and 2 poems
156. Refer to Figure 3-4. Perry has an absolute advantage in the production of
a.
novels and Jordan has an absolute advantage in the production of poems.
b.
poems and Jordan has an absolute advantage in the production of novels.
c.
novels and Jordan has an absolute advantage in the production of neither good.
d.
neither good and Jordan has an absolute advantage in the production of novels.
157. Refer to Figure 3-4. Perry has a comparative advantage in the production of
a.
novels and Jordan has a comparative advantage in the production of poems.
b.
poems and Jordan has a comparative advantage in the production of novels.
c.
novels and Jordan has a comparative advantage in the production of neither good.
d.
neither good and Jordan has a comparative advantage in the production of novels.
158. Refer to Figure 3-4. Perry should specialize in the production of
a.
novels.
b.
poems.
c.
both goods.
d.
neither good.
159. Refer to Figure 3-4. Jordan should specialize in the production of
a.
novels.
b.
poems.
c.
both goods.
d.
neither good.
Chapter 3/Interdependence and the Gains from Trade ❖ 67
160. Refer to Figure 3-4. If Perry and Jordan switch from each person dividing their time equally between the
production of novels and poems to each person spending all of their time producing the good in which they
have a comparative advantage, then total production of novels will increase by
a.
1.
b.
2.
c.
3.
d.
4.
161. Refer to Figure 3-4. If Perry and Jordan each spends all of his/her time producing the good in which s/he has
a comparative advantage and trade takes place at a price of 1 novel for 7 poems, then
a.
Perry and Jordan will both gain from this trade.
b.
Perry will gain from this trade, but Jordan will not.
c.
Jordan will gain from this trade, but Perry will not.
d.
neither Perry nor Jordan will gain from this trade.
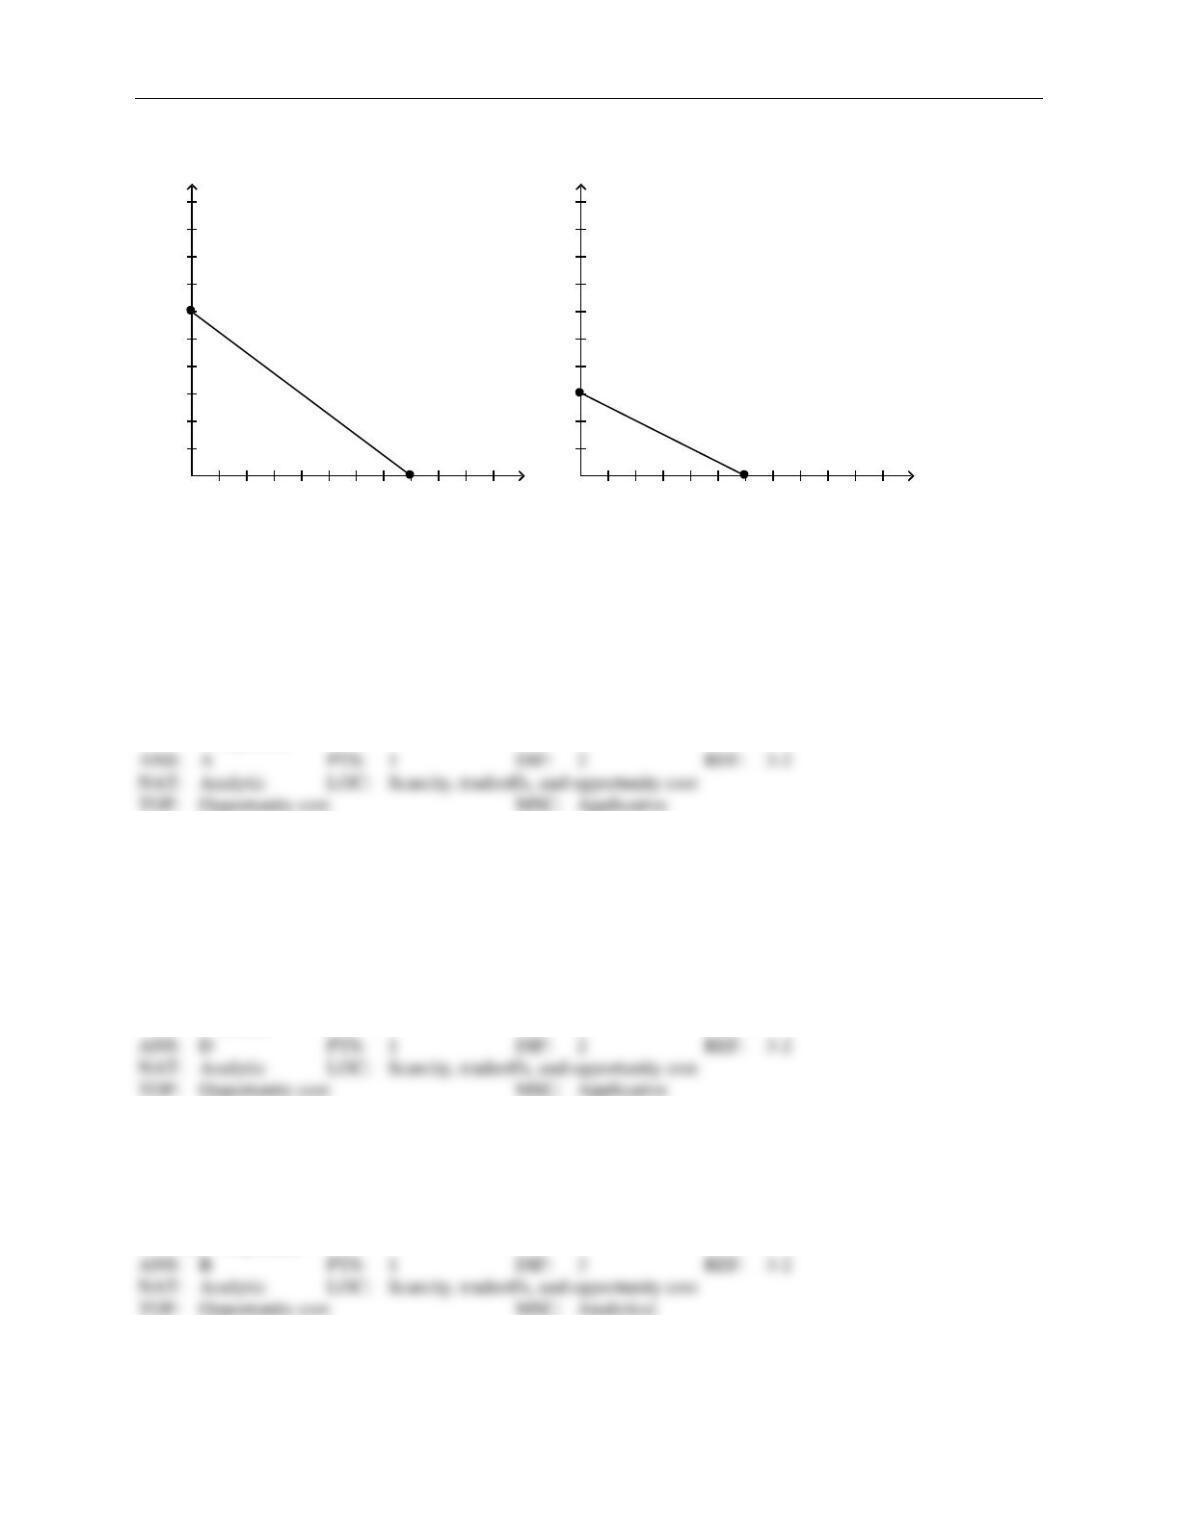
Figure 3-5
Hosne’s Production Possibilities Frontier
Merve’s Production Possibilities Frontier
1 2 3 4 5 6 7 8 9 10 purses
1
2
3
4
5
6
7
8
9
10 wallets
1 2 3 4 5 6 7 8 9 10 purses
1
2
3
4
5
6
7
8
9
10 wallets
162. Refer to Figure 3-5. Hosne’s opportunity cost of one purse is
a.
4/5 wallet and Merve’s opportunity cost of one purse is 2/3 wallet.
b.
4/5 wallet and Merve’s opportunity cost of one purse is 3/2 wallets.
c.
5/4 wallets and Merve’s opportunity cost of one purse is 2/3 wallet.
d.
5/4 wallets and Merve’s opportunity cost of one purse is 3/2 wallets.
163. Refer to Figure 3-5. Hosne’s opportunity cost of one wallet is
a.
4/5 purse and Merve’s opportunity cost of one wallet is 2/3 purse.
b.
4/5 purse and Merve’s opportunity cost of one wallet is 3/2 purses.
c.
5/4 purses and Merve’s opportunity cost of one wallet is 2/3 purse.
d.
5/4 purses and Merve’s opportunity cost of one wallet is 3/2 purses.
68 ❖ Chapter 3/Interdependence and the Gains from Trade
164. Refer to Figure 3-5. Hosne has an absolute advantage in the production of
a.
purses and Merve has an absolute advantage in the production of wallets.
b.
wallets and Merve has an absolute advantage in the production of purses.
c.
both goods and Merve has an absolute advantage in the production of neither good.
d.
neither good and Merve has an absolute advantage in the production of both goods.
165. Refer to Figure 3-5. Hosne has a comparative advantage in the production of
a.
purses and Merve has a comparative advantage in the production of wallets.
b.
wallets and Merve has a comparative advantage in the production of purses.
c.
both goods and Merve has a comparative advantage in the production of neither good.
d.
neither good and Merve has a comparative advantage in the production of both goods.
166. Refer to Figure 3-5. Hosne should specialize in the production of
a.
purses.
b.
wallets.
c.
both goods.
d.
neither good.
167. Refer to Figure 3-5. Merve should specialize in the production of
a.
purses.
b.
wallets.
c.
both goods.
d.
neither good.
168. Refer to Figure 3-5. If Hosne and Merve switch from each person dividing her time equally between the
production of purses and wallets to each person spending all of her time producing the good in which she has a
comparative advantage, then total production of purses will increase by
a.
2.
b.
3.
c.
5.
d.
10.
169. Refer to Figure 3-5. At which of the following prices would both Hosne and Merve gain from trade with
each other?
a.
5 wallets for 1.25 purses
b.
5 wallets for 2.5 purses
c.
5 wallets for 3.75 purses
d.
Hosne and Merve could not both gain from trade with each other at any price.
Chapter 3/Interdependence and the Gains from Trade ❖ 69
Figure 3-6
Maxine’s Production Possibilities Frontier
Daisy’s Production Possibilities Frontier
3 6 9 12 15 18 21 24 27 30 pies
2
4
6
8
10
12
14
16
18
20 tarts
3 6 9 12 15 18 21 24 27 30 pies
2
4
6
8
10
12
14
16
18
20
tarts
170. Refer to Figure 3-6. Suppose Maxine decides to increase her production of tarts by 5. What is the opportuni-
ty cost of this decision?
a.
2/5 pie
b.
2 pies
c.
5/2 pies
d.
10 pies
171. Refer to Figure 3-6. Suppose Daisy decides to increase her production of pies by 6. What is the opportunity
cost of this decision?
a.
8/3 tarts
b.
4.5 tarts
c.
8 tarts
d.
10 tarts
172. Refer to Figure 3-6. Suppose Daisy is willing to trade 3/4 tart to Maxine for each pie that Maxine makes and
sends to Daisy. Which of the following combinations of pies and tarts could Maxine not then consume, as-
suming Maxine specializes in making pies and Daisy specializes in making tarts?
a.
4 pies and 6 tarts
b.
6 pies and 5 tarts
c.
8 pies and 3 tarts
d.
10 pies and 1.5 tarts
70 ❖ Chapter 3/Interdependence and the Gains from Trade
173. Refer to Figure 3-6. Maxine has an absolute advantage in the production of
a.
both goods and a comparative advantage in the production of pies.
b.
both goods and a comparative advantage in the production of tarts.
c.
neither good and a comparative advantage in the production of pies.
d.
neither good and a comparative advantage in the production of tarts.
174. Refer to Figure 3-6. Daisy has an absolute advantage in the production of
a.
both goods and a comparative advantage in the production of pies.
b.
both goods and a comparative advantage in the production of tarts.
c.
neither good and a comparative advantage in the production of pies.
d.
neither good and a comparative advantage in the production of tarts.
175. Refer to Figure 3-6. If Maxine and Daisy switch from each person dividing her time equally between the
production of pies and tarts to each person spending all of her time producing the good in which she has a
comparative advantage, then total production of tarts will increase by
a.
7.
b.
10.
c.
17.
d.
20.
176. Refer to Figure 3-6. At which of the following prices would both Maxine and Daisy gain from trade with
each other?
a.
4 tarts for 2 pies
b.
8 tarts for 12 pies
c.
12 tarts for 28 pies
d.
Maxine and Daisy could not both gain from trade with each other at any price.

Chapter 3/Interdependence and the Gains from Trade ❖ 71
Figure 3-7
Bintu’s Production Possibilities Frontier
Juba’s Production Possibilities Frontier
1 2 3 4 5 6 7 8 bowls
1
2
3
4
5
6
7
8
9
10 cups
1 2 3 4 5 6 7 8 bowls
1
2
3
4
5
6
7
8
9
10 cups
177. Refer to Figure 3-7. The opportunity cost of 1 bowl for Bintu is
a.
1/4 cup.
b.
1/2 cup.
c.
2 cups.
d.
4 cups.
178. Refer to Figure 3-7. The opportunity cost of 1 bowl for Juba is
a.
1/4 cup.
b.
2/3 cup.
c.
3/2 cups.
d.
4 cups.
179. Refer to Figure 3-7. The opportunity cost of 1 cup for Bintu is
a.
1/8 bowl.
b.
1/4 bowl.
c.
4 bowls.
d.
8 bowls.
180. Refer to Figure 3-7. The opportunity cost of 1 cup for Juba is
a.
1/6 bowl.
b.
2/3 bowl.
c.
3/2 bowls.
d.
6 bowls.
72 ❖ Chapter 3/Interdependence and the Gains from Trade
181. Refer to Figure 3-7. Suppose Juba is willing to trade one bowl to Bintu for every two cups that Bintu makes
and sends to Juba. Which of the following combinations of bowls and cups could Bintu then consume, assum-
ing Bintu specializes in making cups and Juba specializes in making bowls?
a.
1 bowl and 7 cups
b.
2 bowls and 4 cups
c.
3 bowls and 3 cups
d.
4 bowls and 1 cup
182. Refer to Figure 3-7. Bintu has an absolute advantage in the production of
a.
bowls and Juba has an absolute advantage in the production of cups.
b.
cups and Juba has an absolute advantage in the production of bowls.
c.
both goods and Juba has an absolute advantage in the production of neither good.
d.
neither good and Juba has an absolute advantage in the production of both goods.
183. Refer to Figure 3-7. Bintu has a comparative advantage in the production of
a.
bowls and Juba has a comparative advantage in the production of cups.
b.
cups and Juba has a comparative advantage in the production of bowls.
c.
both goods and Juba has a comparative advantage in the production of neither good.
d.
neither good and Juba has a comparative advantage in the production of both goods.
184. Refer to Figure 3-7. If Bintu and Juba switch from each person dividing her time equally between the pro-
duction of cups and bowls to each person spending all of her time producing the good in which she has a com-
parative advantage, then total production will increase by
a.
1 bowl and 1 cup.
b.
2 bowls and 4 cups.
c.
3 bowls and 5 cups.
d.
4 bowls and 8 cups.
Chapter 3/Interdependence and the Gains from Trade ❖ 73
Figure 3-8
Chile’s Production Possibilities Frontier
Colombia’s Production Possibilities Frontier
(in pounds)
(in pounds)
2 4 6 8 10 12 14 16 18 20 coffee
2
4
6
8
10
12
14
16
18
20 soybeans
(in pounds)
(in pounds)
2 4 6 8 10 12 14 16 18 20 coffee
2
4
6
8
10
12
14
16
18
20 soybeans
185. Refer to Figure 3-8. Chile’s opportunity cost of one pound of coffee is
a.
3/4 pound of soybeans and Colombia’s opportunity cost of one pound of coffee is 1/2 pound of
soybeans.
b.
3/4 pound of soybeans and Colombia’s opportunity cost of one pound of coffee is 2 pounds of
soybeans.
c.
4/3 pounds of soybeans and Colombia’s opportunity cost of one pound of coffee is 1/2 pound of
soybeans.
d.
4/3 pounds of soybeans and Colombia’s opportunity cost of one pound of coffee is 2 pounds of
soybeans.
186. Refer to Figure 3-8. Chile’s opportunity cost of one pound of soybeans is
a.
3/4 pound of coffee and Colombia’s opportunity cost of one pound of soybeans is 1/2 pound of
coffee.
b.
3/4 pound of coffee and Colombia’s opportunity cost of one pound of soybeans is 2 pounds of
coffee.
c.
4/3 pounds of coffee and Colombia’s opportunity cost of one pound of soybeans is 1/2 pound of
coffee.
d.
4/3 pounds of coffee and Colombia’s opportunity cost of one pound of soybeans is 2 pounds of
coffee.
187. Refer to Figure 3-8. Chile would incur an opportunity cost of 36 pounds of coffee if it increased its produc-
tion of soybeans by
a.
12 pounds.
b.
27 pounds.
c.
30 pounds.
d.
48 pounds.
74 ❖ Chapter 3/Interdependence and the Gains from Trade
188. Refer to Figure 3-8. Colombia would incur an opportunity cost of 24 pounds of coffee if it increased its pro-
duction of soybeans by
a.
12 pounds.
b.
18 pounds.
c.
36 pounds.
d.
48 pounds.
189. Refer to Figure 3-8. Chile has an absolute advantage in the production of
a.
coffee and Colombia has an absolute advantage in the production of soybeans.
b.
soybeans and Colombia has an absolute advantage in the production of coffee.
c.
both goods and Colombia has an absolute advantage in the production of neither good.
d.
neither good and Colombia has an absolute advantage in the production of both goods.
190. Refer to Figure 3-8. Chile has a comparative advantage in the production of
a.
coffee and Colombia has a comparative advantage in the production of soybeans.
b.
soybeans and Colombia has a comparative advantage in the production of coffee.
c.
both goods and Colombia has a comparative advantage in the production of neither good.
d.
neither good and Colombia has a comparative advantage in the production of both goods.
191. Refer to Figure 3-8. If Chile and Colombia switch from each country dividing its time equally between the
production of coffee and soybeans to each country spending all of its time producing the good in which it has
a comparative advantage, then total production of soybeans will increase by
a.
3 pounds.
b.
6 pounds.
c.
9 pounds.
d.
12 pounds.
192. Refer to Figure 3-8. At which of the following prices would both Chile and Colombia gain from trade with
each other?
a.
6 pounds of soybeans for 9 pounds of coffee
b.
8 pounds of soybeans for 20 pounds of coffee
c.
11 pounds of soybeans for 33 pounds of coffee
d.
Chile and Colombia could not both gain from trade with each other at any price.
Chapter 3/Interdependence and the Gains from Trade ❖ 75
193. Refer to Figure 3-8. If Chile and Colombia each spends all of its time producing the good in which it has a
comparative advantage and the countries agree to trade 7 pounds of coffee for 5 pounds of soybeans, then
Chile will consume
a.
7 pounds of coffee and 7 pounds of soybeans and Colombia will consume 5 pounds of coffee and 5
pounds of soybeans.
b.
7 pounds of coffee and 7 pounds of soybeans and Colombia will consume 5 pounds of coffee and
11 pounds of soybeans.
c.
23 pounds of coffee and 7 pounds of soybeans and Colombia will consume 5 pounds of coffee and
5 pounds of soybeans.
d.
23 pounds of coffee and 7 pounds of soybeans and Colombia will consume 5 pounds of coffee and
11 pounds of soybeans.
194. Refer to Figure 3-8. Chile and Colombia would not be able to gain from trade if Colombia’s opportunity cost
of one pound of soybeans changed to
a.
1/2 pound of coffee.
b.
3/4 pound of coffee.
c.
4/3 pounds of coffee.
d.
2 pounds of coffee.
Figure 3-9
Uzbekistan’s Production Possibilities Frontier
Azerbaijan’s Production Possibilities Frontier
510 15 20 25 30 35 40 45 50 bolts
10
20
30
40
50
60
70
80
90
100 nails
510 15 20 25 30 35 40 45 50 bolts
10
20
30
40
50
60
70
80
90
100 nails
195. Refer to Figure 3-9. Azerbaijan’s opportunity cost of one nail is
a.
1/4 bolt and Uzbekistan’s opportunity cost of one nail is 1/2 bolt.
b.
1/4 bolt and Uzbekistan’s opportunity cost of one nail is 2 bolts.
c.
4 bolts and Uzbekistan’s opportunity cost of one nail is 1/2 bolt.
d.
4 bolts and Uzbekistan’s opportunity cost of one nail is 2 bolts.
76 ❖ Chapter 3/Interdependence and the Gains from Trade
196. Refer to Figure 3-9. Azerbaijan’s opportunity cost of one bolt is
a.
1/4 nail and Uzbekistan’s opportunity cost of one bolt is 1/2 nail.
b.
1/4 nail and Uzbekistan’s opportunity cost of one bolt is 2 nails.
c.
4 nails and Uzbekistan’s opportunity cost of one bolt is 1/2 nail.
d.
4 nails and Uzbekistan’s opportunity cost of one bolt is 2 nails.
197. Refer to Figure 3-9. Suppose Uzbekistan decides to increase its production of bolts by 10. What is the op-
portunity cost of this decision?
a.
1/2 nail
b.
2 nails
c.
5 nails
d.
20 nails
198. Refer to Figure 3-9. Suppose Azerbaijan decides to increase its production of nails by 20. What is the op-
portunity cost of this decision?
a.
1/4 bolt
b.
4 bolts
c.
5 bolts
d.
80 bolts
199. Refer to Figure 3-9. Suppose Azerbaijan is willing to trade 3 nails to Uzbekistan for every bolt that Uzbeki-
stan makes and sends to Azerbaijan. Which of the following combinations of bolts and nails could Azerbaijan
then consume, assuming Uzbekistan specializes in making bolts and Azerbaijan specializes in making nails?
a.
8 bolts and 56 nails
b.
14 bolts and 44 nails
c.
18 bolts and 32 nails
d.
20 bolts and 26 nails
200. Refer to Figure 3-9. Suppose Azerbaijan is willing to trade 3 nails to Uzbekistan for every bolt that Uzbeki-
stan makes and sends to Azerbaijan. Which of the following combinations of bolts and nails could Uzbekistan
then consume, assuming Uzbekistan specializes in making bolts and Azerbaijan specializes in making nails?
a.
7 bolts and 70 nails
b.
12 bolts and 56 nails
c.
17 bolts and 40 nails
d.
25 bolts and 15 nails
Chapter 3/Interdependence and the Gains from Trade ❖ 77
201. Refer to Figure 3-9. Azerbaijan has an absolute advantage in the production of
a.
bolts and a comparative advantage in the production of bolts.
b.
bolts and a comparative advantage in the production of nails.
c.
nails and a comparative advantage in the production of bolts.
d.
nails and a comparative advantage in the production of nails.
202. Refer to Figure 3-9. If Uzbekistan and Azerbaijan switch from each country dividing its time equally be-
tween the production of bolts and nails to each country spending all of its time producing the good in which it
has a comparative advantage, then total production will increase by
a.
5 bolts and 10 nails.
b.
15 bolts and 40 nails.
c.
20 bolts and 50 nails.
d.
30 bolts and 80 nails.
203. Refer to Figure 3-9. If Uzbekistan and Azerbaijan each spends all its time producing the good in which it has
a comparative advantage and trade takes place at a price of 12 bolts for 36 nails, then
a.
neither Uzbekistan nor Azerbaijan will gain from this trade.
b.
Uzbekistan will gain from this trade, but Azerbaijan will not.
c.
Azerbaijan will gain from this trade, but Uzbekistan will not.
d.
both Uzbekistan and Azerbaijan will gain from this trade.
204. Refer to Figure 3-9. Without trade, Uzbekistan produced and consumed 12 bolts and 36 nails and Azerbaijan
produced and consumed 14 bolts and 24 nails. Then, each country agreed to specialize in the production of
the good in which it has a comparative advantage and trade 16 bolts for 38 nails. As a result, Uzbekistan
gained
a.
2 bolts and 2 nails and Azerbaijan gained 2 bolts and 18 nails.
b.
4 bolts and 2 nails and Azerbaijan gained 2 bolts and 14 nails.
c.
14 bolts and 38 nails and Azerbaijan gained 16 bolts and 42 nails.
d.
16 bolts and 38 nails and Azerbaijan gained 16 bolts and 38 nails.
78 ❖ Chapter 3/Interdependence and the Gains from Trade
Figure 3-10
Alice and Betty’s Production Possibilities in one 8–hour day.
Alice’s Production Possibilities Frontier
Betty’s Production Possibilities Frontier
A
50 100 150 200 250 300 350 400 pizzas
50
100
150
200
250
300
350
400
450
500 lemonade
B (180,180)
50 100 150 200 250 300 350 400 pizzas
50
100
150
200
250
300
350
400
450
500 lemonade
205. Refer to Figure 3-10. What are Alice and Betty’s opportunity costs of 1 pizza?
a.
Alice’s opportunity cost of 1 pizza is 1/2 of a pitcher of lemonade and Betty’s opportunity cost of 1
pizza is 2/3 of a pitcher of lemonade.
b.
Alice’s opportunity cost of 1 pizza is 1 pitcher of lemonade and Betty’s opportunity cost of 1 pizza
is 3 pitchers of lemonade.
c.
Alice’s opportunity cost of 1 pizza is 2 pitchers of lemonade and Betty’s opportunity cost of 1 pizza
is 1.5 pitchers of lemonade.
d.
Alice’s opportunity cost of 1 pizza is 400 pitchers of lemonade and Betty’s opportunity cost of 1
pizza is 450 pitchers of lemonade.
206. Refer to Figure 3-10. What are Alice and Betty’s opportunity costs of 1 pitcher of lemonade?
a.
Alice’s opportunity cost of 1 pitcher of lemonade is 1/2 of a pizza and Betty’s opportunity cost of 1
pitcher of lemonade is 2/3 of a pizza.
b.
Alice’s opportunity cost of 1 pitcher of lemonade is 2 pizzas and Betty’s opportunity cost of 1
pitcher of lemonade is 1.5 pizzas.
c.
Alice’s opportunity cost of 1 pitcher of lemonade is 10 pizzas and Betty’s opportunity cost of 1
pitcher of lemonade is 10 pizzas.
d.
Alice’s opportunity cost of 1 pitcher of lemonade is 200 pizzas and Betty’s opportunity cost of 1
pitcher of lemonade is 300 pizzas.
207. Refer to Figure 3-10. Which of the following statements is correct regarding absolute advantage?
a.
Alice has an absolute advantage in the production of both lemonade and pizzas.
b.
Betty has an absolute advantage in the production of both lemonade and pizzas.
c.
Alice has an absolute advantage in the production of pizzas while Betty has an absolute advantage
in the production of lemonade.
d.
Alice has an absolute advantage in the production of lemonade while Betty has an absolute
advantage in the production of pizzas.
Chapter 3/Interdependence and the Gains from Trade ❖ 79
208. Refer to Figure 3-10. Which of the following statements is correct regarding comparative advantage?
a.
Alice has a comparative advantage in the production of both lemonade and pizzas.
b.
Betty has a comparative advantage in the production of both lemonade and pizzas.
c.
Alice has a comparative advantage in the production of pizzas while Betty has a comparative
advantage in the production of lemonade.
d.
Alice has a comparative advantage in the production of lemonade while Betty has a comparative
advantage in the production of pizzas.
209. Refer to Figure 3-10. Which of the following prices would result in an mutually advantageous trade for Alice
and Betty?
a.
100 pizzas for 100 pitchers of lemonade
b.
100 pizzas for 125 pitchers of lemonade
c.
100 pizzas for 180 pitchers of lemonade
d.
100 pizzas for 220 pitchers of lemonade
Table 3-12
Labor Hours Needed to
Make 1 Pound of:
Amount
Produced in 40 hours
Meat
Potatoes
Meat
Potatoes
Farmer
8 hours/pound
5 hours/pound
5 pounds
8 pounds
Rancher
4 hours/pound
10 hours/pound
10 pounds
4 pounds
210. Refer to Table 3-12. For the farmer, the opportunity cost of 1 pound of meat is
a.
0.625 pound of potatoes.
b.
1.6 pounds of potatoes.
c.
5 pounds of potatoes.
d.
8 pounds of potatoes.
211. Refer to Table 3-1. For the farmer, the opportunity cost of 15 pounds of meat is
a.
12 pounds of potatoes.
b.
16 pounds of potatoes.
c.
20 pounds of potatoes.
d.
24 pounds of potatoes.
80 ❖ Chapter 3/Interdependence and the Gains from Trade
212. Refer to Table 3-1. For the rancher, the opportunity cost of 1 pound of meat is
a.
0.4 pound of potatoes.
b.
2.5 pounds of potatoes.
c.
4 pounds of potatoes.
d.
10 pounds of potatoes.
213. Refer to Table 3-1. For the rancher, the opportunity cost of 16 pounds of meat is
a.
4.0 pounds of potatoes.
b.
5.2 pounds of potatoes.
c.
6.4 pounds of potatoes.
d.
9.6 pounds of potatoes.
214. Refer to Table 3-1. For the farmer, the opportunity cost of 1 pound of potatoes is
a.
0.625 pound of meat.
b.
1.0 pounds of meat.
c.
1.6 pounds of meat.
d.
3.2 pounds of meat.
215. Refer to Table 3-1. For the farmer, 12.8 pounds of
a.
meat is the opportunity cost of 10.6 pounds of potatoes.
b.
meat is the opportunity cost of 16.0 pounds of potatoes.
c.
potatoes is the opportunity cost of 6.8 pounds of meat.
d.
potatoes is the opportunity cost of 8.0 pounds of meat.
216. Refer to Table 3-1. In 10 hours,
a.
the rancher could produce 2.5 pounds of meat and 1.0 pound of potatoes.
b.
the rancher could produce 1.0 pound of meat and 1.0 pound of potatoes.
c.
the farmer could produce 0.25 pounds of meat and 1.6 pounds of potatoes.
d.
the farmer could produce 0.75 pounds of meat and 1.25 pounds of potatoes.
217. Refer to Table 3-1. Relative to the farmer, the rancher has an absolute advantage in the production of
a.
meat, but not in the production of potatoes.
b.
potatoes, but not in the production of meat.
c.
both meat and potatoes.
d.
neither meat nor potatoes.