205. Multiple Choice: Which of the following will result in...
Question Which of the following will result in an increased price of milk?
Answer a shift to the right of the supply curve for milk
206. Multiple Choice: Figure: Four Markets for DVDs Referen...
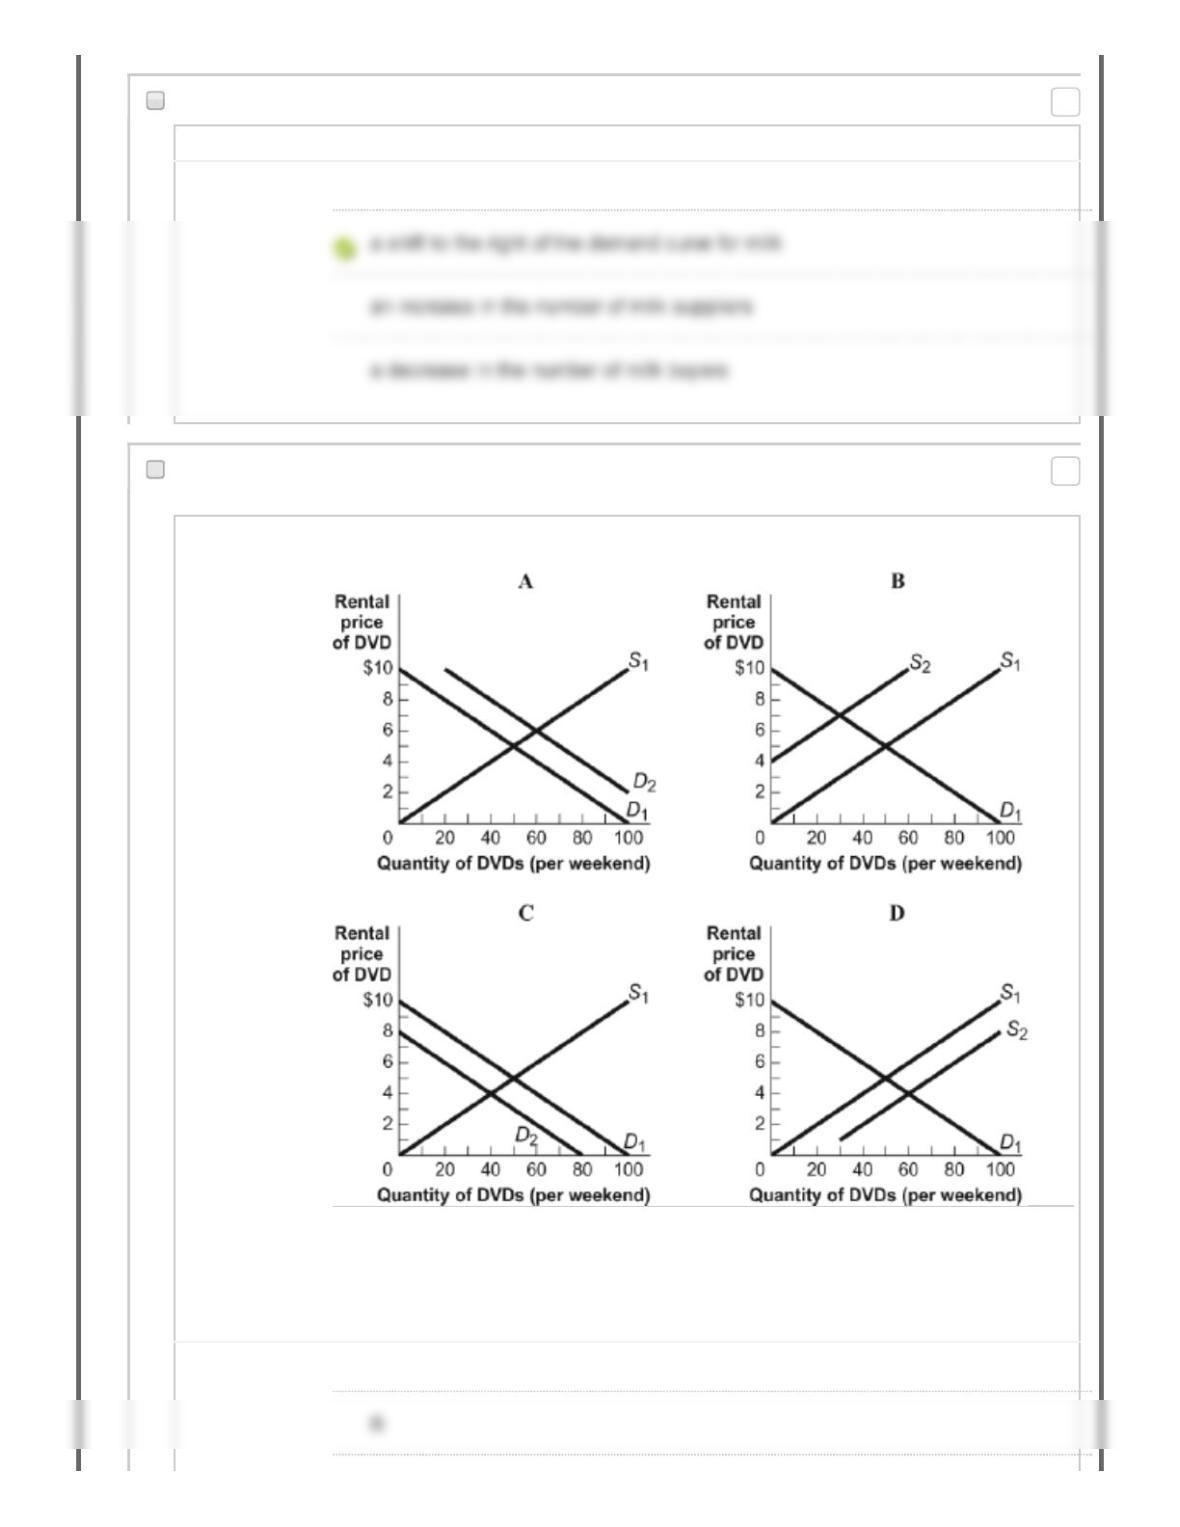
Question Figure: Four Markets for DVDs
Reference: Ref 3-12
(Figure: Four Markets for DVDs) Look at the figure Four Markets for DVDs. If D1 or
S1 is the original curve and D2 or S2 is the new curve, which of the graphs shows a
change that results in an increase in the quantity demanded of DVDs?
Answer A
Points: 0
Points: 0
207. Multiple Choice: Figure: Four Markets for DVDs Referen...
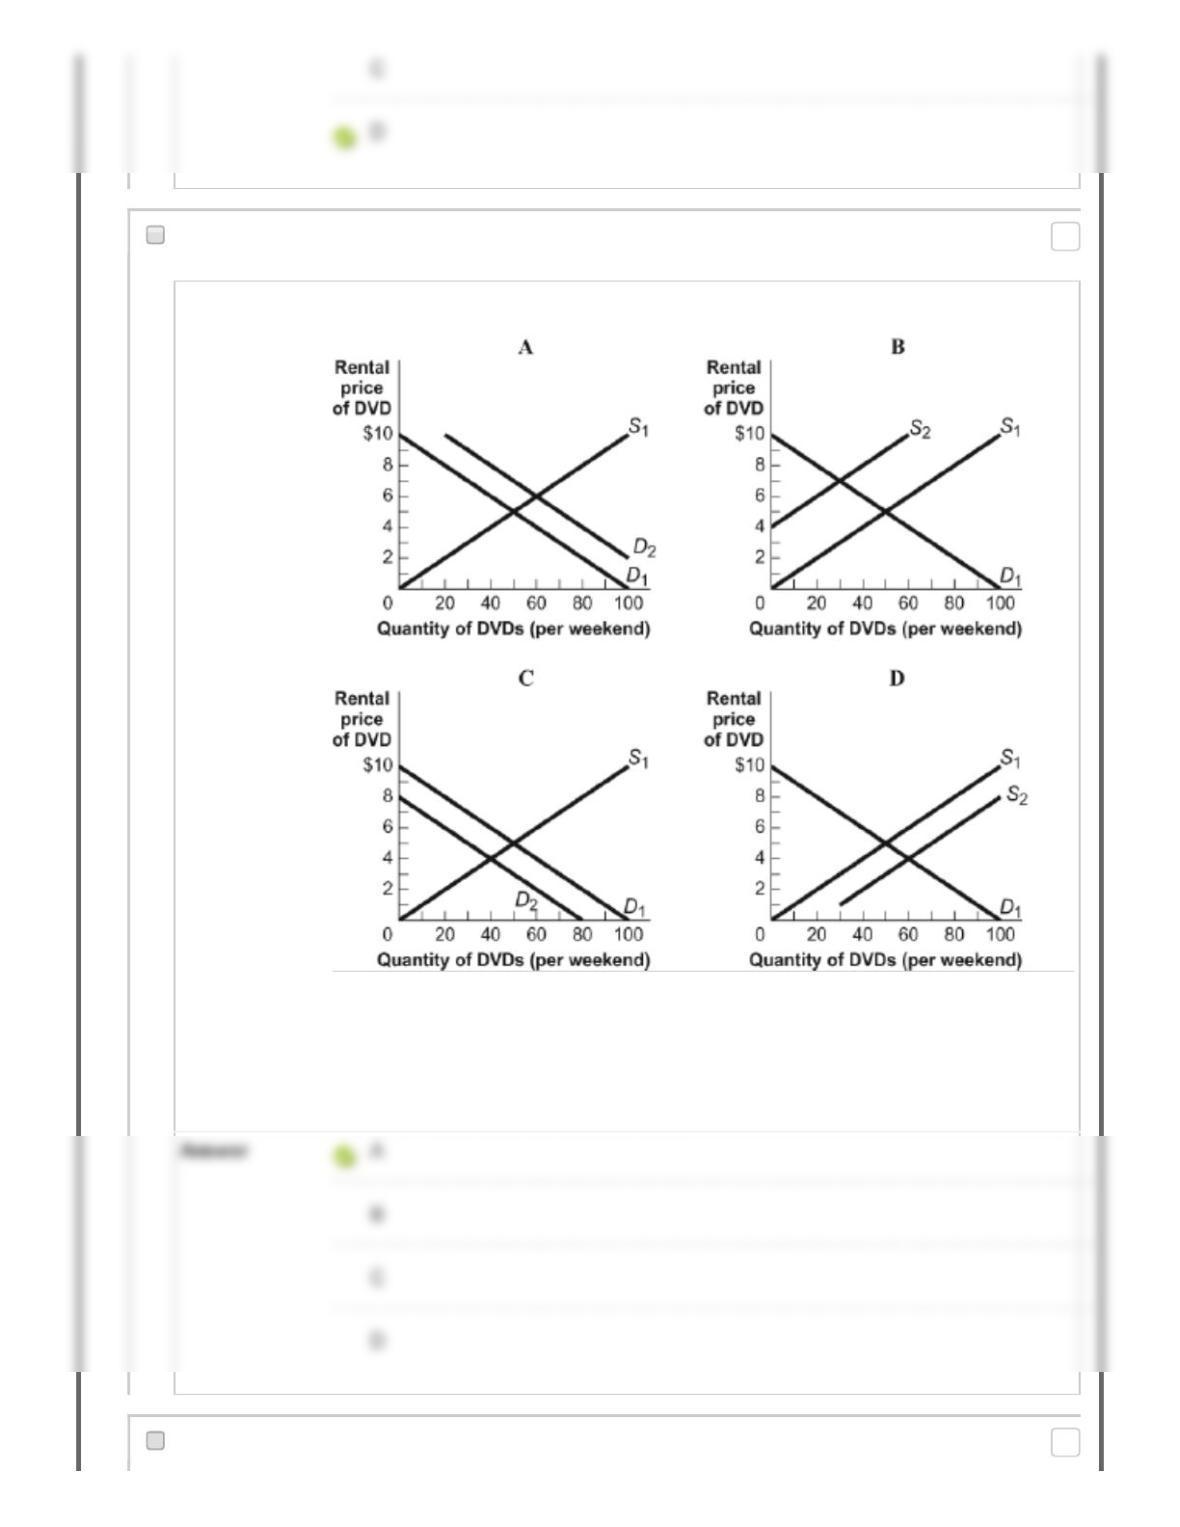
Question Figure: Four Markets for DVDs
Reference: Ref 3-12
(Figure: Four Markets for DVDs) Look at the figure Four Markets for DVDs. If D1 or
S1 is the original curve and D2 or S2 is the new curve, which of the graphs
illustrates what may happen in the market for DVDs if there is an increase in the
cost of a movie ticket at the local theater?
208. Multiple Choice: Figure: Four Markets for DVDs Referen...
Points: 0
Points: 0
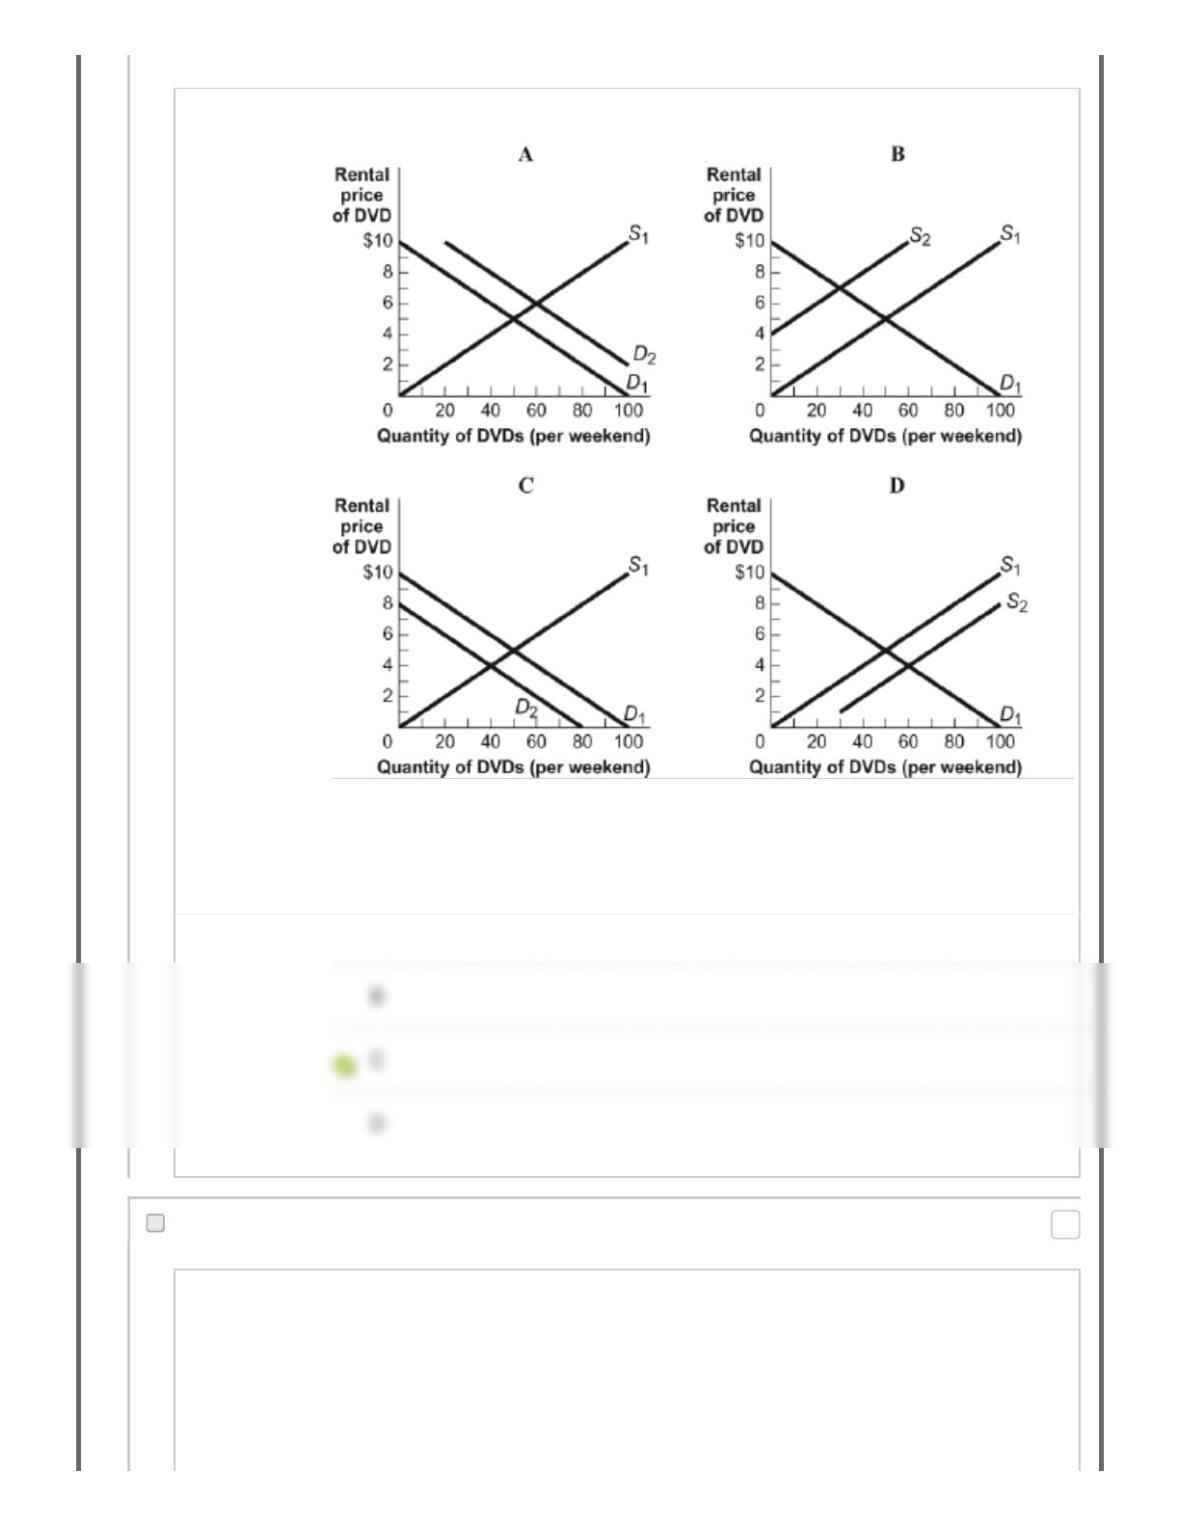
Question Figure: Four Markets for DVDs
Reference: Ref 3-12
(Figure: Four Markets for DVDs) Look at the figure Four Markets for DVDs. If D1 or
S1 is the original curve and D2 or S2 is the new curve, which of the graphs shows a
change that results in a decrease in the quantity of DVDs supplied?
Answer A
209. Multiple Choice: Figure: Four Markets for DVDs Referen...
Question
Points: 0
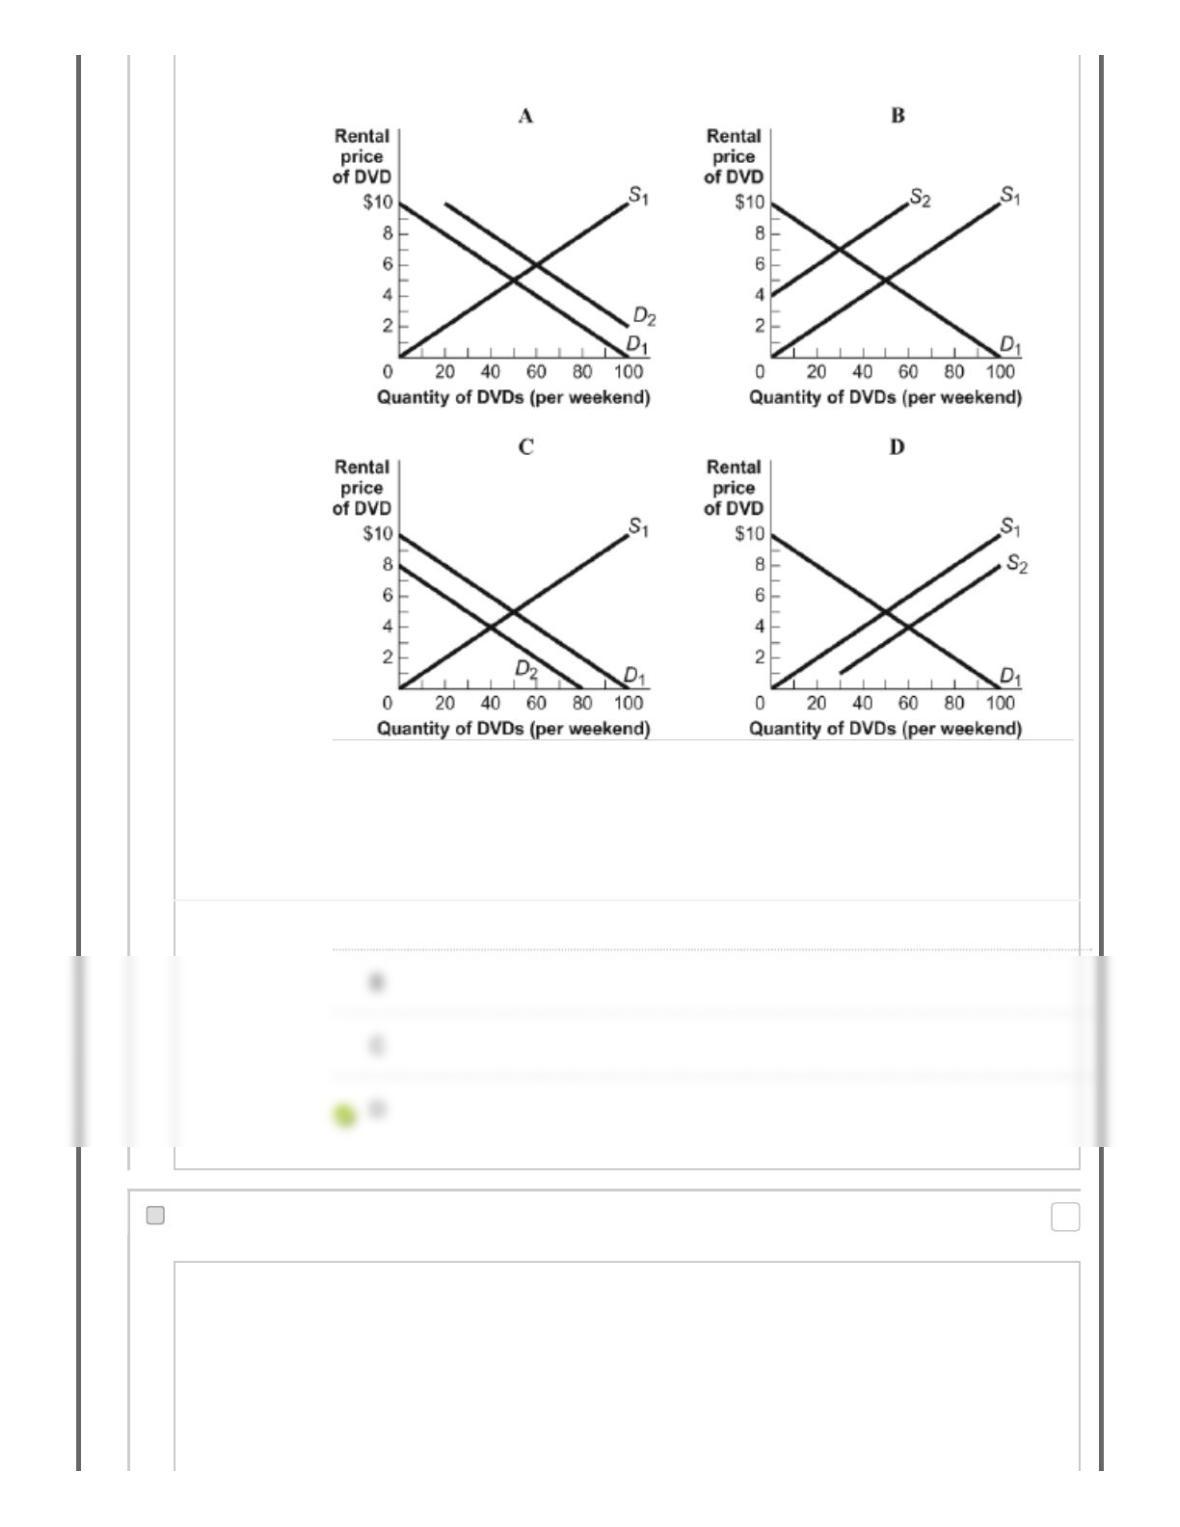
Figure: Four Markets for DVDs
Reference: Ref 3-12
(Figure: Four Markets for DVDs) Look at the figure Four Markets for DVDs. If D1 or
S1 is the original curve and D2 or S2 is the new curve,, which of the graphs
illustrates what may happen in the market for DVDs if the cost of producing DVDs
falls?
Answer A
210. Multiple Choice: Figure: Four Markets for DVDs Referen...
Question
Points: 0

Figure: Four Markets for DVDs
Reference: Ref 3-12
(Figure: Four Markets for DVDs) Look at the figure Four Markets for DVDs. If D1 or
S1 is the original curve and D2 or S2 is the new curve, which of the graphs shows
what may happen in the market for DVDs if the cost of producing DVD players
increases?
Answer A
211. Multiple Choice: Figure: Four Markets for DVDs Referen...
Question
Points: 0
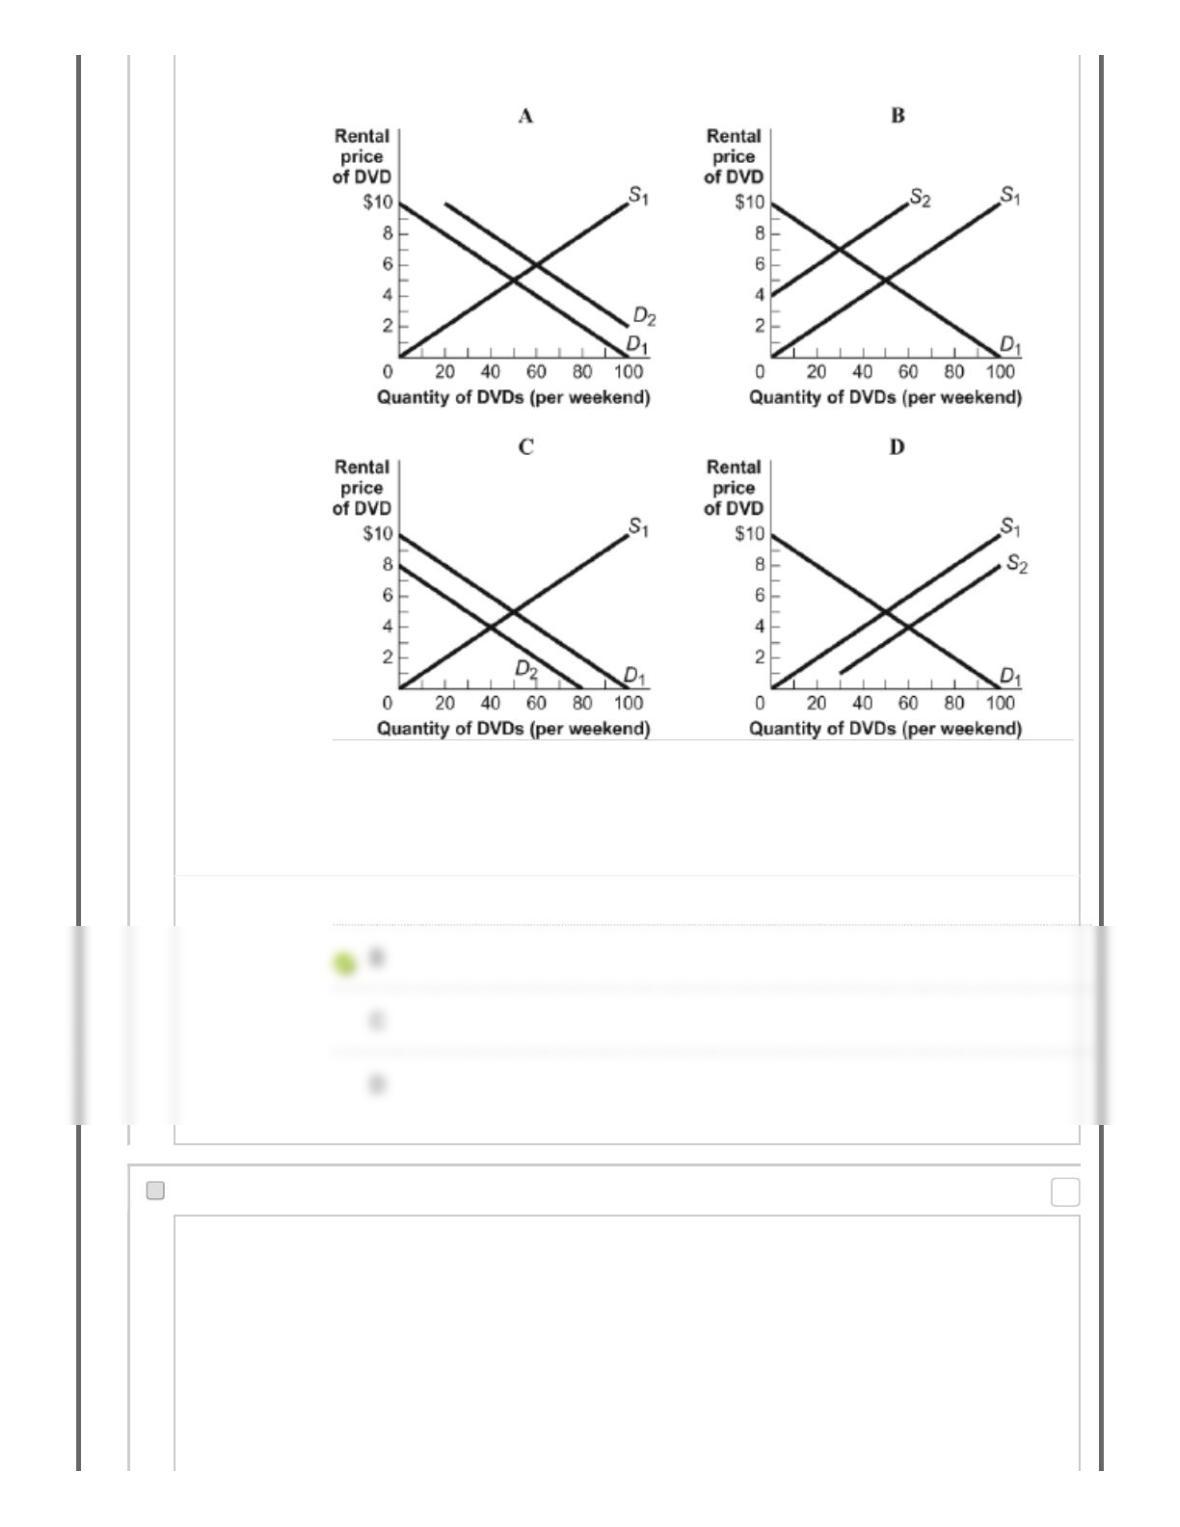
Figure: Four Markets for DVDs
Reference: Ref 3-12
(Figure: Four Markets for DVDs) Look at the figure Four Markets for DVDs. If D1 or
S1 is the original curve and D2 or S2 is the new curve, which of the graphs shows
what may happen if some of the stores that rent DVDs close?
Answer A
212. Multiple Choice: Figure: Shifts in Demand and Supply R…
Question
Points: 0

Figure: Shifts in Demand and Supply
Reference: Ref 3-13
(Figure: Shifts in Demand and Supply) Look at the figure Shifts in Demand and
Supply. The figure shows how supply and demand might shift in response to
specific events. Suppose consumer incomes increase. Which panel best describes
how this will affect the market for used furniture, an inferior good?
Answer panel A
213. Multiple Choice: Figure: Shifts in Demand and Supply R…
Question
Points: 0

Figure: Shifts in Demand and Supply
Reference: Ref 3-13
(Figure: Shifts in Demand and Supply) Look at the figure Shifts in Demand and
Supply. The figure shows how supply and demand might shift in response to
specific events. Suppose scientists discover that eating a tomato a day prevents
aging. Which panel best describes how this will affect the market for tomatoes?
Answer panel A
214. Multiple Choice: Figure: Shifts in Demand and Supply R…
Question
Points: 0

Figure: Shifts in Demand and Supply
Reference: Ref 3-13
(Figure: Shifts in Demand and Supply) Look at the figure Shifts in Demand and
Supply. The figure shows how supply and demand might shift in response to
specific events. Suppose a fall frost destroys one-third of the nation’s orange crop.
Which panel best describes how this will affect the market for oranges?
Answer panel A
215. Multiple Choice: Figure: Shifts in Demand and Supply R…
Question
Points: 0

Figure: Shifts in Demand and Supply
Reference: Ref 3-13
(Figure: Shifts in Demand and Supply) Look at the figure Shifts in Demand and
Supply. The figure shows how supply and demand might shift in response to
specific events. Suppose a fall frost destroys one-third of the nation’s orange crop.
Which panel best describes how this will affect the market for vitamin C tablets,
which are a substitute for oranges?
Answer panel A
216. Multiple Choice: Figure: Shifts in Demand and Supply R…
Question
Points: 0

Figure: Shifts in Demand and Supply
Reference: Ref 3-13
(Figure: Shifts in Demand and Supply) Look at the figure Shifts in Demand and
Supply. The figure shows how supply and demand might shift in response to
specific events. Suppose the population increases. Which panel best describes
how this will affect the market for apples?
Answer panel A
217. Multiple Choice: Figure: Shifts in Demand and Supply R…
Question
Points: 0

Figure: Shifts in Demand and Supply
Reference: Ref 3-13
(Figure: Shifts in Demand and Supply) Look at the figure Shifts in Demand and
Supply. The graph shows how supply and demand might shift in response to
specific events. Suppose a new machine is developed that allows restaurants and
fast-food outlets to produce french fries at a lower cost. Which panel best
describes how this will affect the market for french fries?
panel D
218. Multiple Choice: Figure: Shifts in Demand and Supply I...
Question
Points: 0

Figure: Shifts in Demand and Supply II
Reference: Ref 3-14
(Figure: Shifts in Demand and Supply II) Look at the figure Shifts in Demand and
Supply II. The graph shows how supply and demand might shift in response to
specific events. Suppose consumer incomes decrease. Which panel best
describes how this will affect the market for used clothing, an inferior good?
219. Multiple Choice: Figure: Shifts in Demand and Supply I...
Question
Points: 0

Figure: Shifts in Demand and Supply II
Reference: Ref 3-14
(Figure: Shifts in Demand and Supply II) Look at the figure Shifts in Demand and
Supply II. The graph shows how supply and demand might shift in response to
specific events. Suppose scientists discover that eating pomegranates causes
aging. Which panel best describes how this will affect the market for
pomegranates?
Answer panel A
220. Multiple Choice: Figure: Shifts in Demand and Supply I...
Question
Points: 0

Figure: Shifts in Demand and Supply II
Reference: Ref 3-14
(Figure: Shifts in Demand and Supply II) Look at the figure Shifts in Demand and
Supply II. The graph shows how supply and demand might shift in response to
specific events. Suppose a drought destroys one-third of the nation‘s peanut crop.
Which panel best describes how this will affect the market for peanuts?
Answer panel A
221. Multiple Choice: Figure: Shifts in Demand and Supply I...
Question
Points: 0

Figure: Shifts in Demand and Supply II
Reference: Ref 3-14
(Figure: Shifts in Demand and Supply II) Look at the figure Shifts in Demand and
Supply II. The graph shows how supply and demand might shift in response to
specific events. Suppose a fall frost destroys one-third of the nation’s grapefruit
crop. Which panel best describes how this will affect the market for vitamin B12
tablets, which are a substitute for grapefruit?
222. Multiple Choice: Figure: Shifts in Demand and Supply I...
Question
Points: 0

Figure: Shifts in Demand and Supply II
Reference: Ref 3-14
(Figure: Shifts in Demand and Supply II) Look at the figure Shifts in Demand and
Supply II. The figure shows how supply and demand might shift in response to
specific events. Suppose the birth rate (the number of babies per woman of
childbearing age) decreases. Which panel best describes how this will affect the
market for diapers?
Answer panel A
223. Multiple Choice: Figure: Shifts in Demand and Supply I...
Question
Points: 0

Figure: Shifts in Demand and Supply II
Reference: Ref 3-14
(Figure: Shifts in Demand and Supply II) Look at the figure Shifts in Demand and
Supply II. The figure shows how supply and demand might shift in response to
specific events. Suppose that vast new oilfields are discovered offshore of
California, and thus gasoline prices fall. Which panel best describes how this will
affect the market for sport utility vehicles, a complement to gasoline?
224. Multiple Choice: Figure: Shifts in Demand and Supply I...
Question
Points: 0

Figure: Shifts in Demand and Supply II
Reference: Ref 3-14
(Figure: Shifts in Demand and Supply II) Look at the figure Shifts in Demand and
Supply II. The figure shows how supply and demand might shift in response to
specific events. Suppose the technology for producing ethanol fuel improves.
Which panel best describes how this will affect the market for ethanol?
Answer panel A
225. Multiple Choice: Figure: Shifts in Demand and Supply I...
Question
Points: 0

Figure: Shifts in Demand and Supply III
Reference: Ref 3-15
(Figure: Shifts in Demand and Supply III) Look at the figure Shifts in Demand and
Supply III. The figure shows how supply and demand might shift in response to
specific events. Suppose consumer incomes increase. Which panel best describes
how this will affect the market for designer boots, a normal good?
226. Multiple Choice: Figure: Shifts in Demand and Supply I...
Question
Points: 0