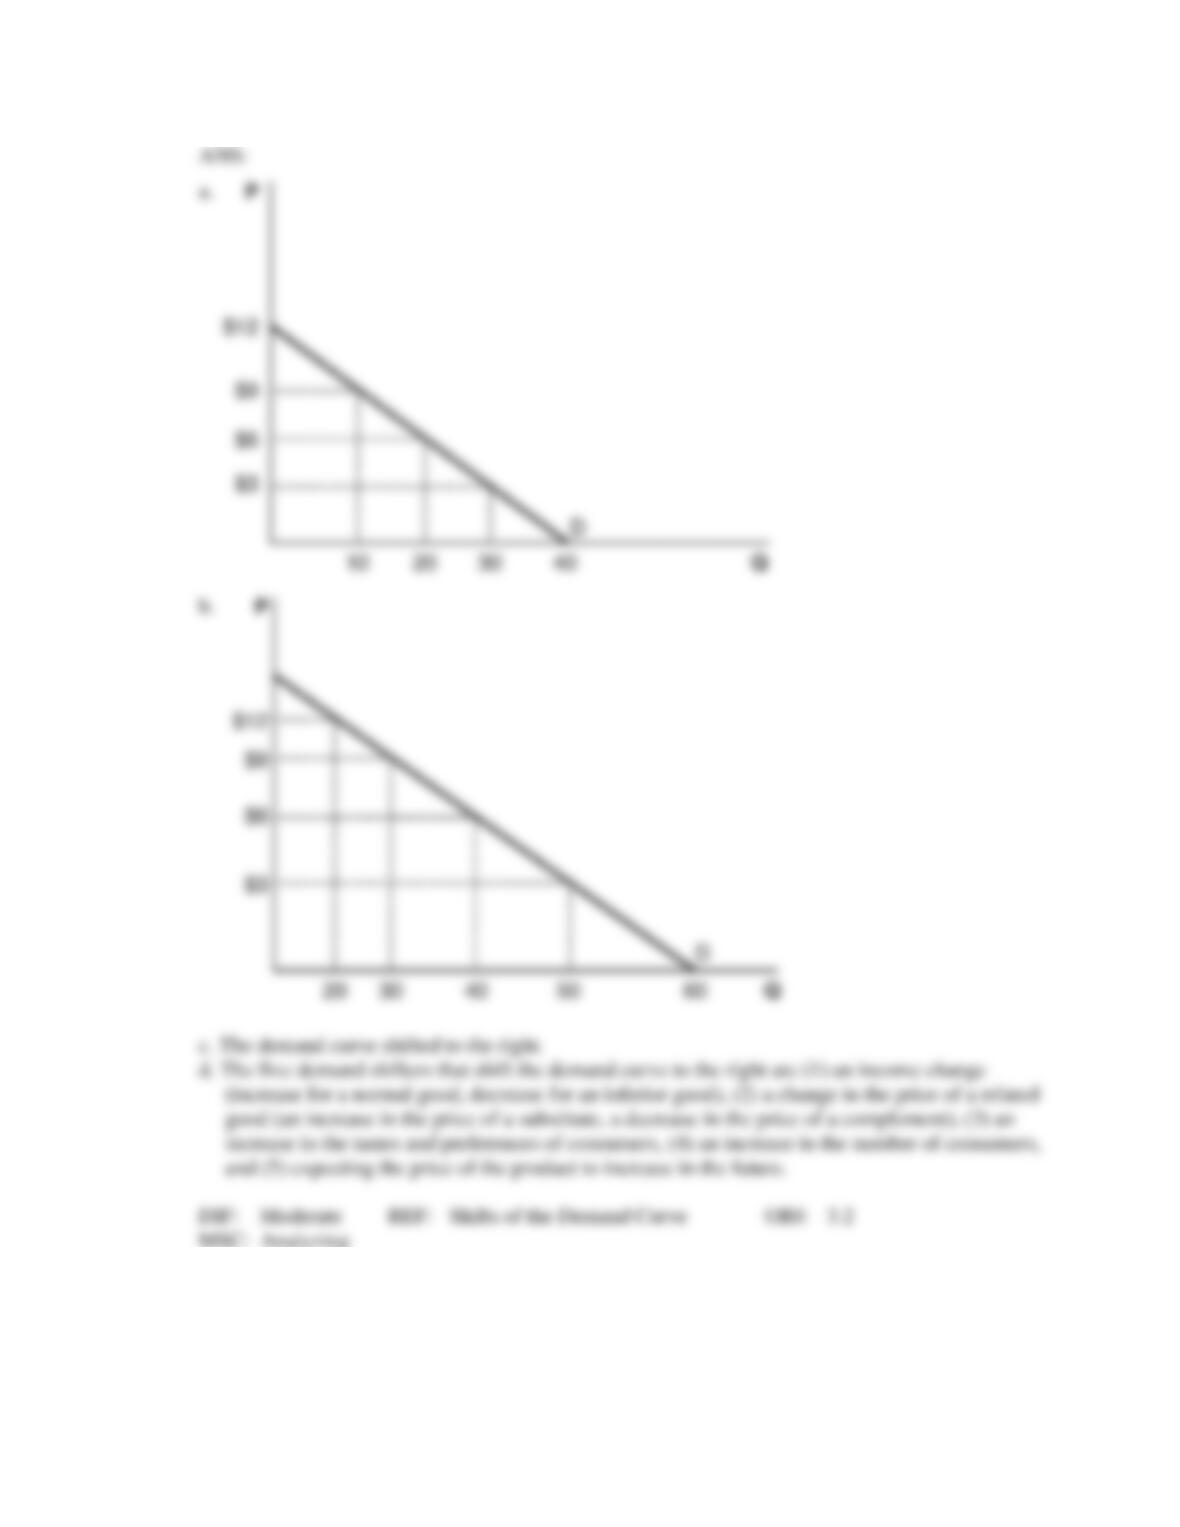
c. What happened to the demand curve?
d. List five things that could make the demand curve reflect your answer in part c.
5. During a national recession, we see the income in the economy decrease and the majority of stock
prices decline (stock prices reflect the value of a company and are directly related to its profits). A
few stock prices actually increase during a recessionary time. Using the information regarding
supply and demand, explain why some stock prices rise during a recession.
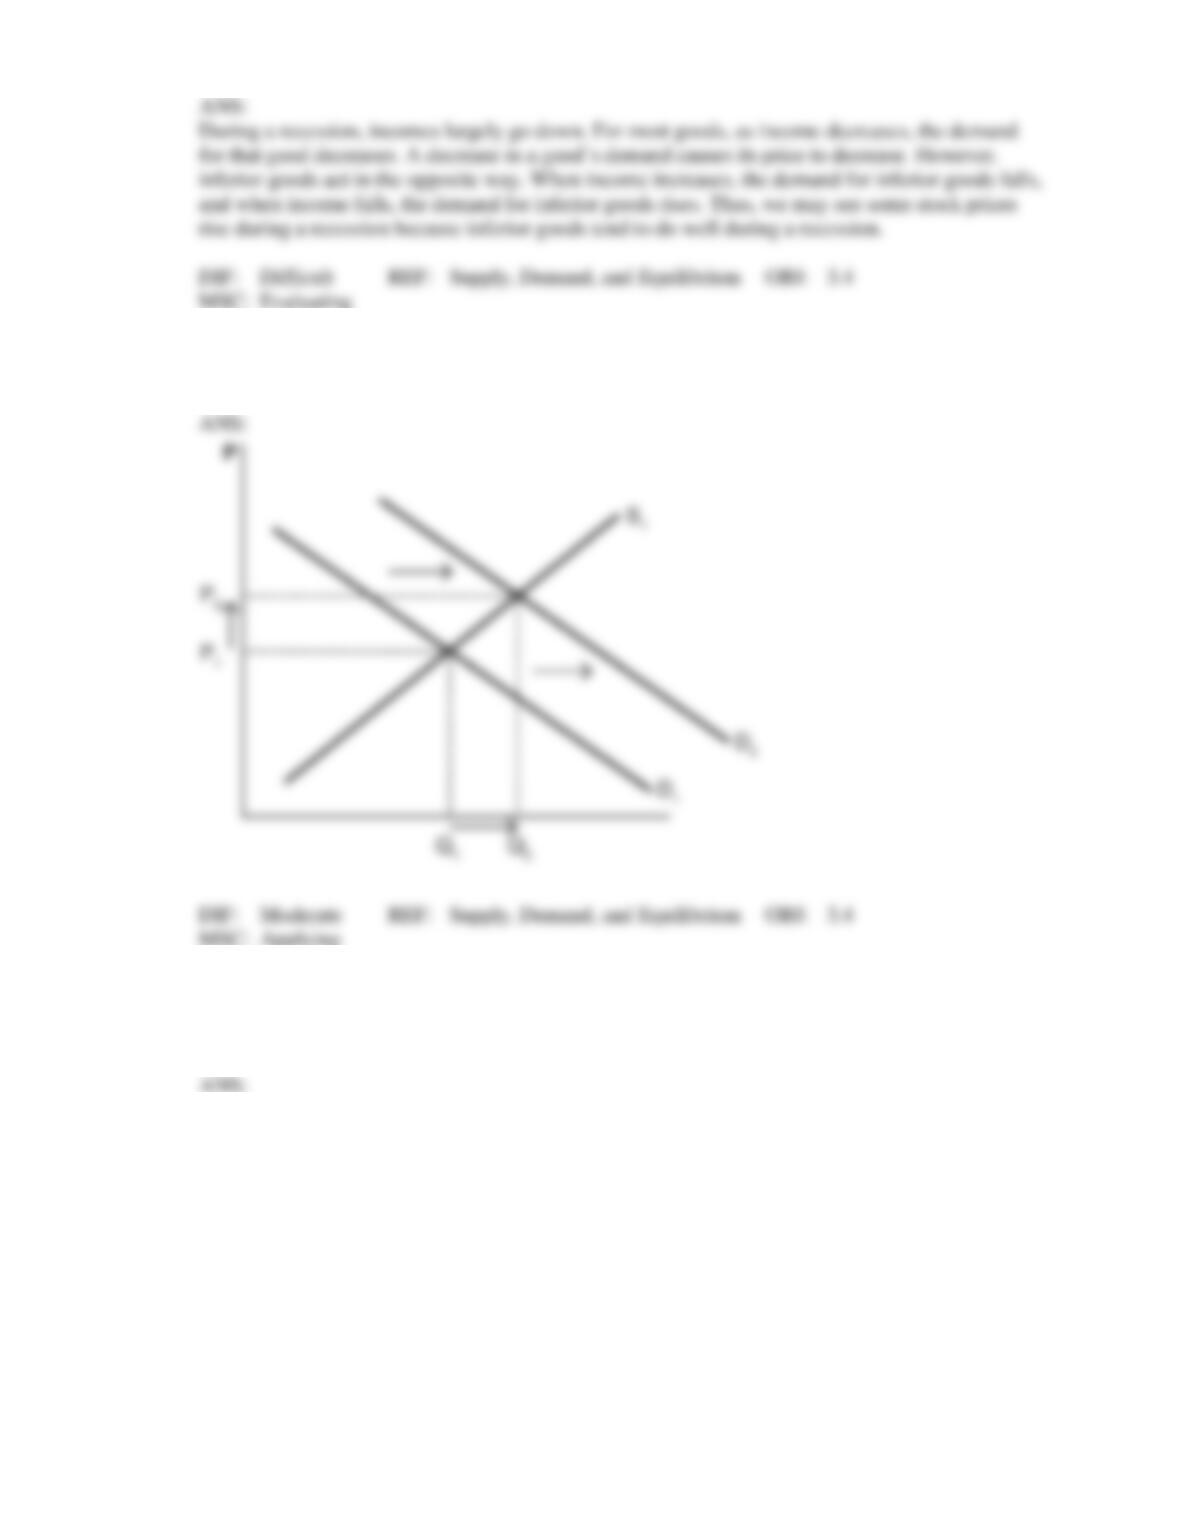
6. Using a supply and demand model, show what happens to the equilibrium price and equilibrium
quantity in the market for bagels if, holding all else constant, the price of cream cheese decreases.
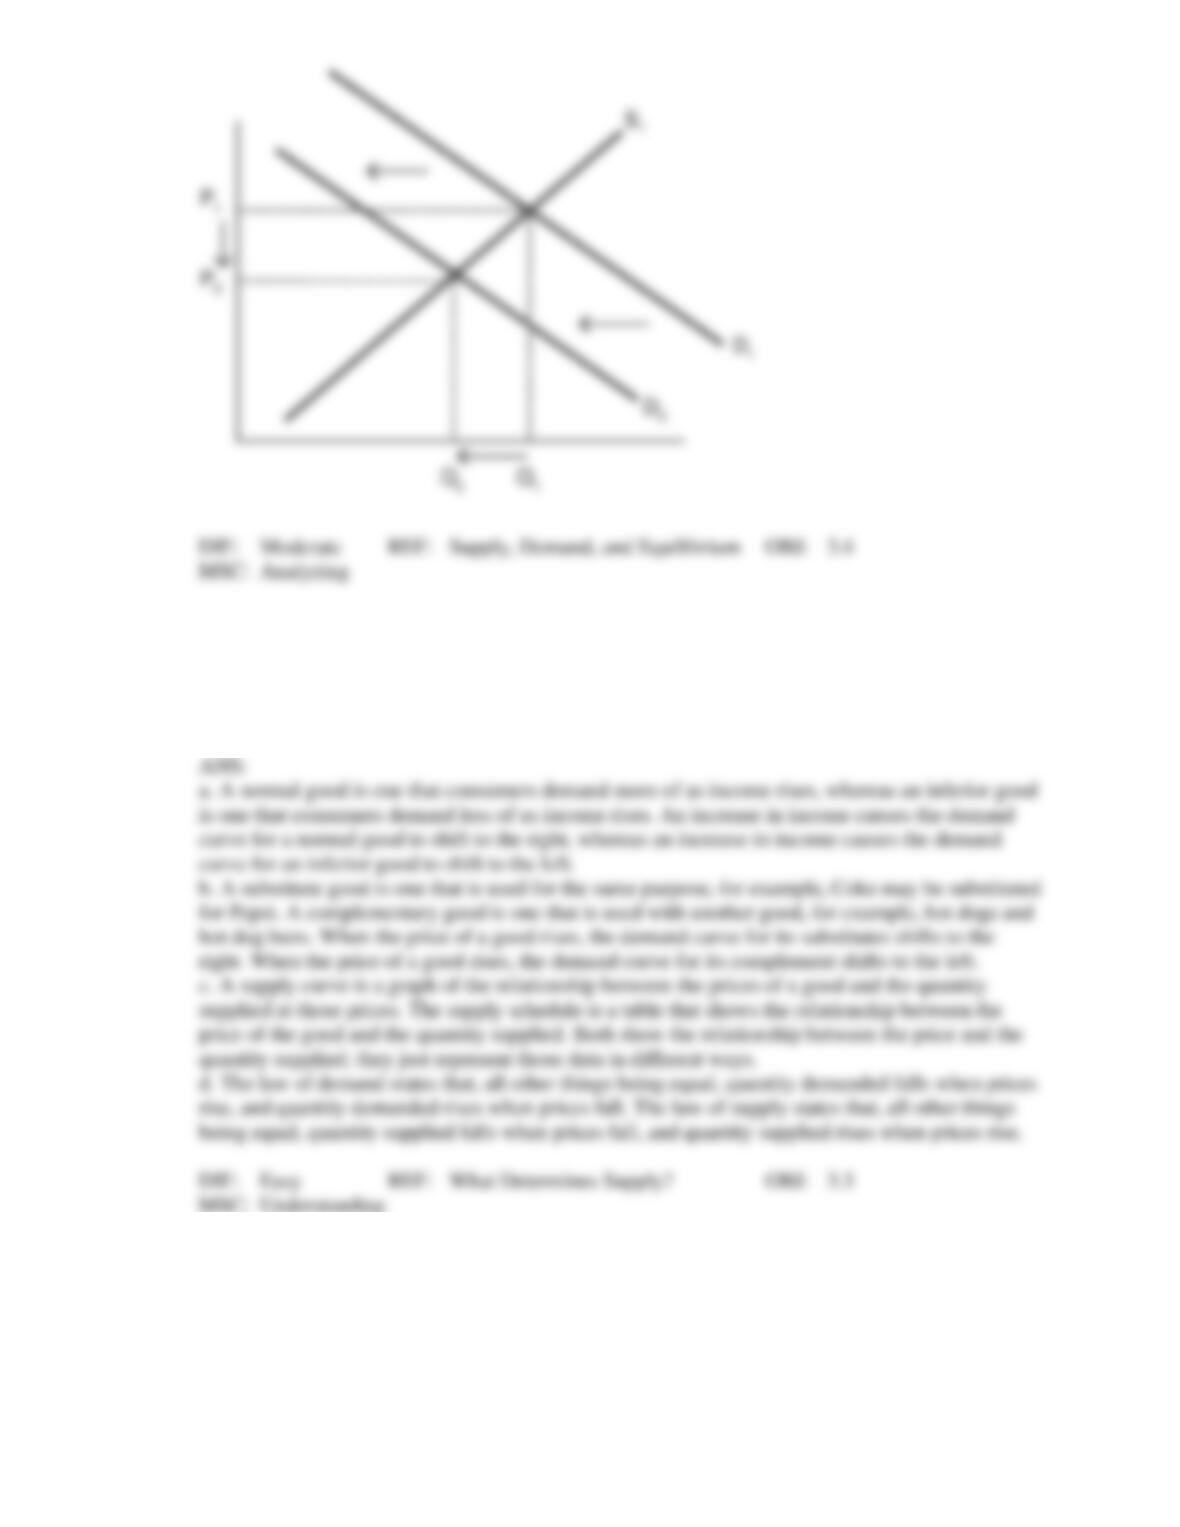
7. Using a supply and demand model, show what happens to the equilibrium price and equilibrium
quantity in the market for bananas if, holding all else constant, a study comes out that says eating
bananas causes cardiac problems.
8. Compare and contrast the following sets of words:
a. normal good versus inferior good
b. substitute good versus complementary good
c. a supply curve versus a supply schedule
d. the law of demand versus the law of supply
9. We are given the following supply schedule:
Price Quantity Demanded
$0 0
$4 15
$8 30
$12 45
$16 60
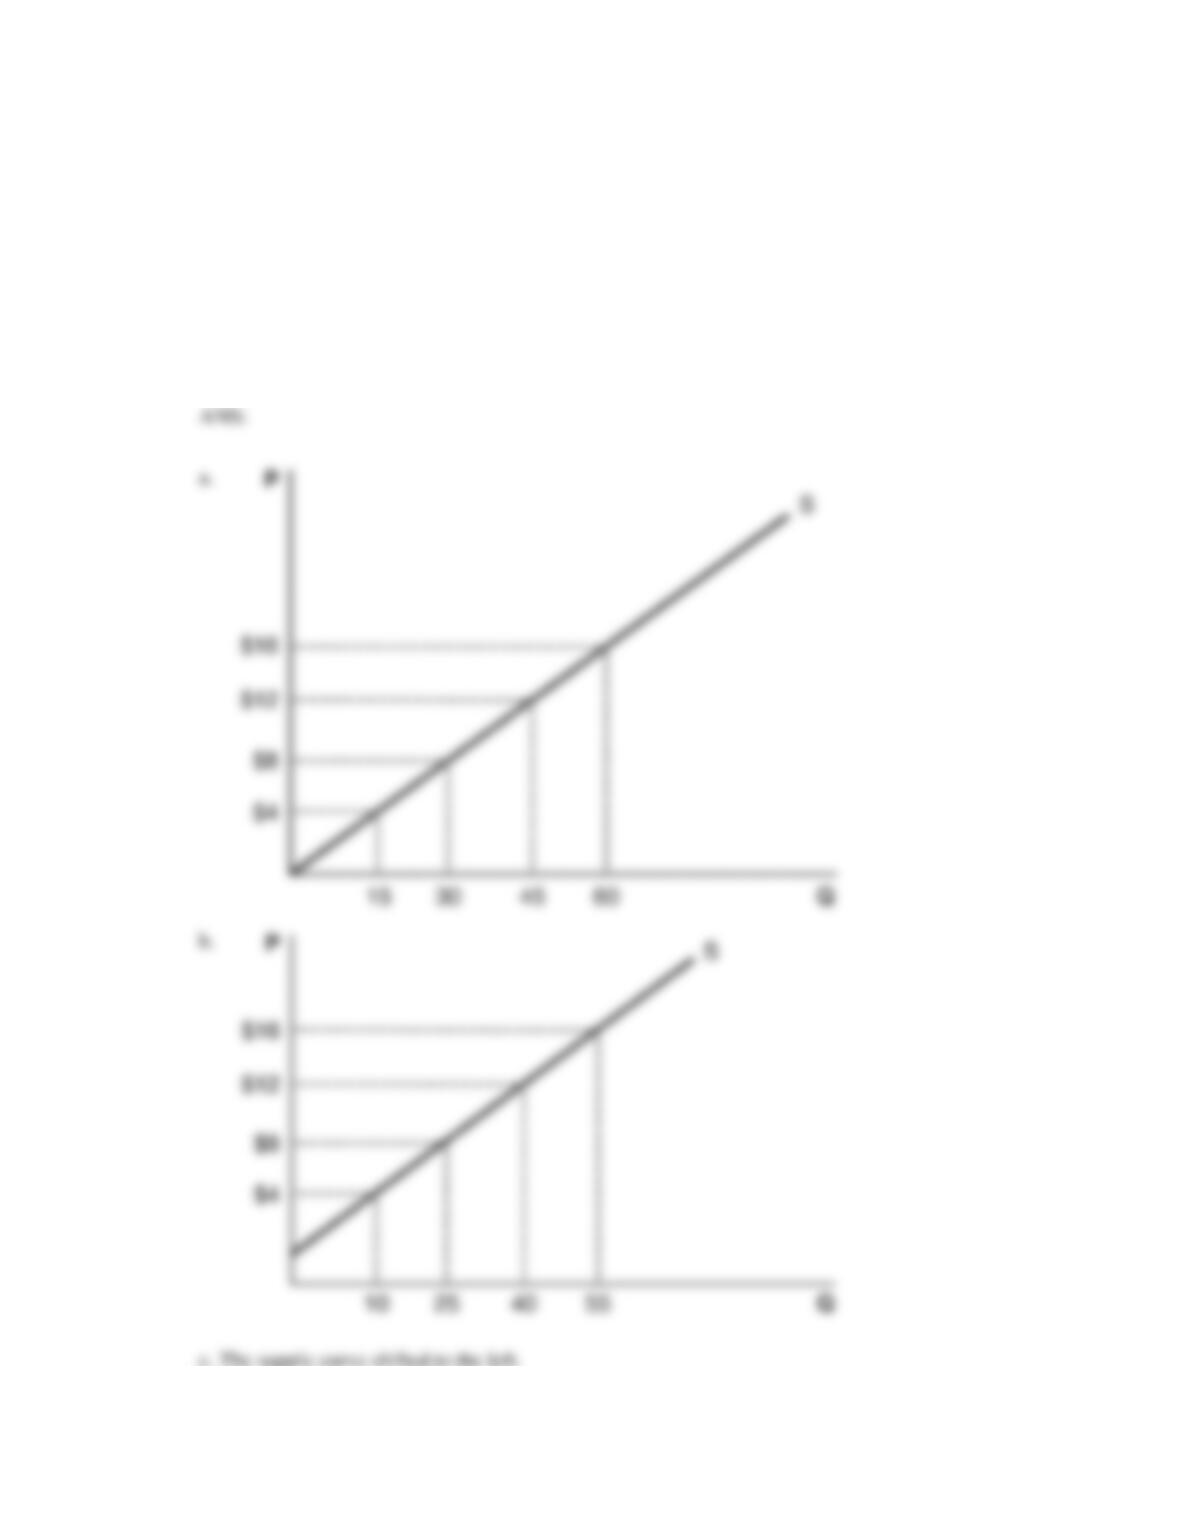
a. Graph the information from the supply schedule. Be sure to label everything.
b. Now graph the following supply schedule:
Price Quantity Demanded
$0 0
$4 10
$8 25
$12 40
$16 55
c. What happened to the supply curve?
d. List five things that could make the supply curve reflect your answer in part c.
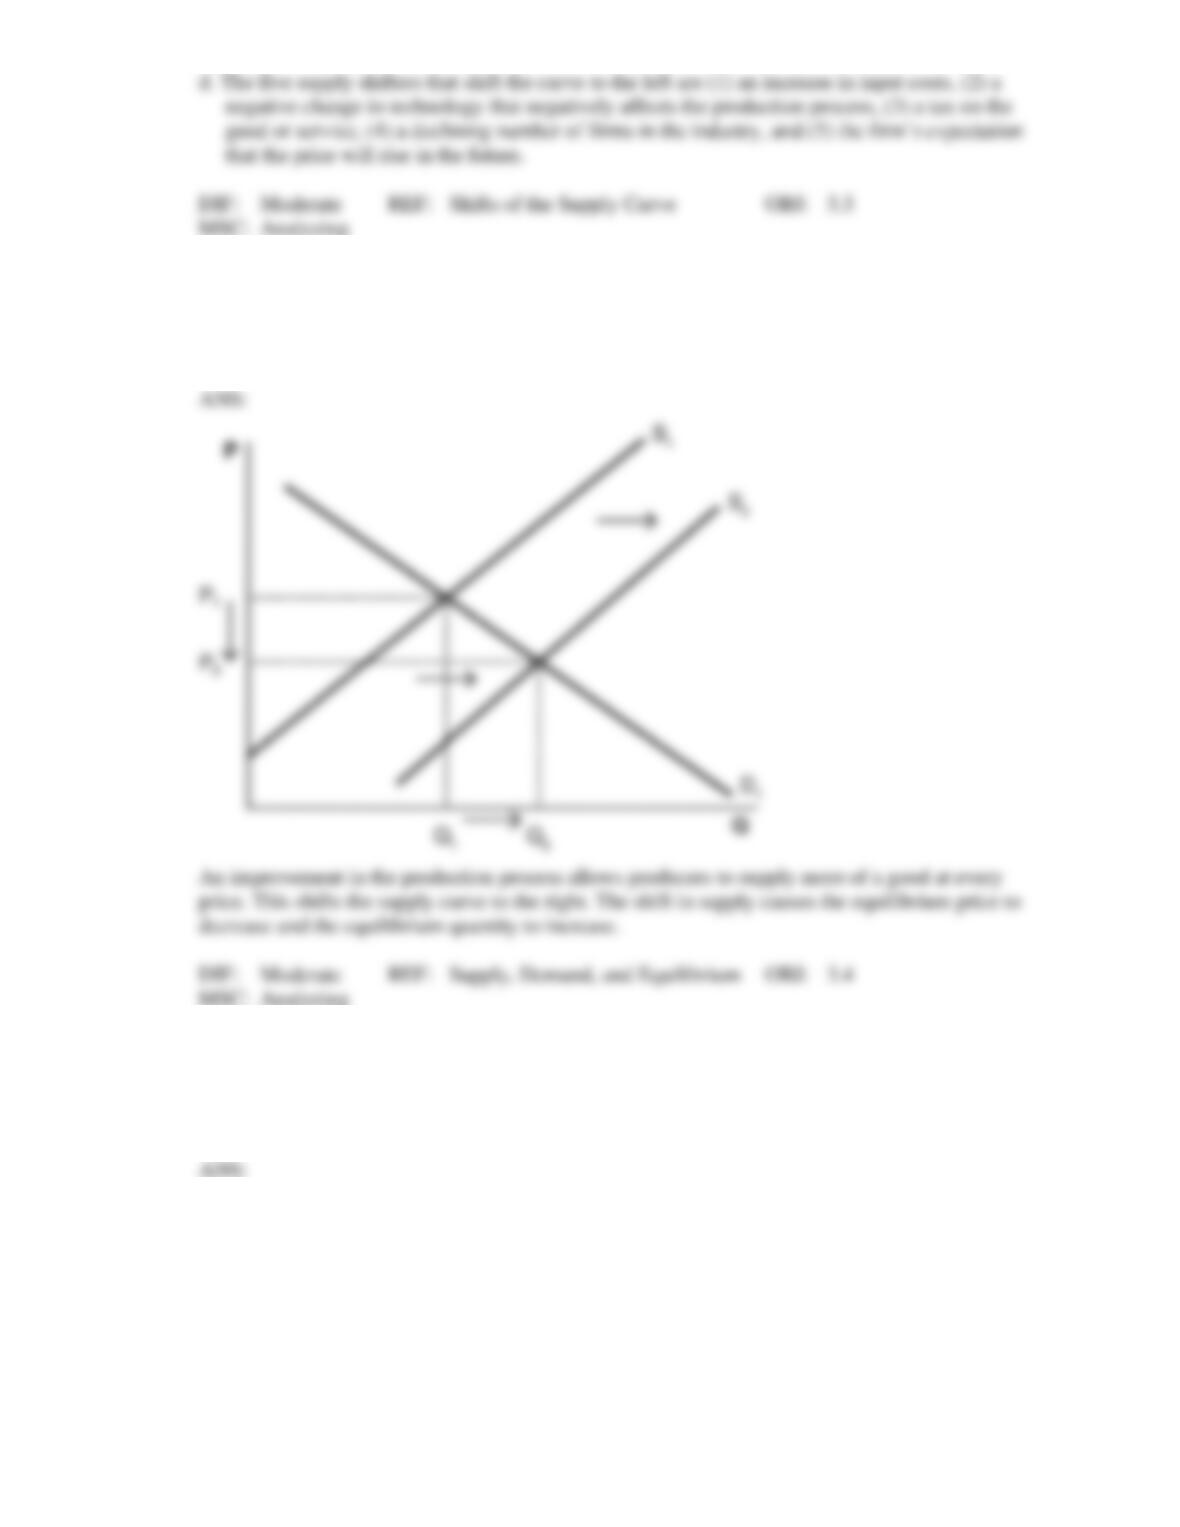
10. After the invention of the cotton gin in 1793, shirt production became more efficient. If everything
else remained constant and this production efficiency was the only change that affected the supply
and demand for shirts, what would we expect to happen to the equilibrium price and equilibrium
quantity? Use a supply and demand graph to supplement your explanation.
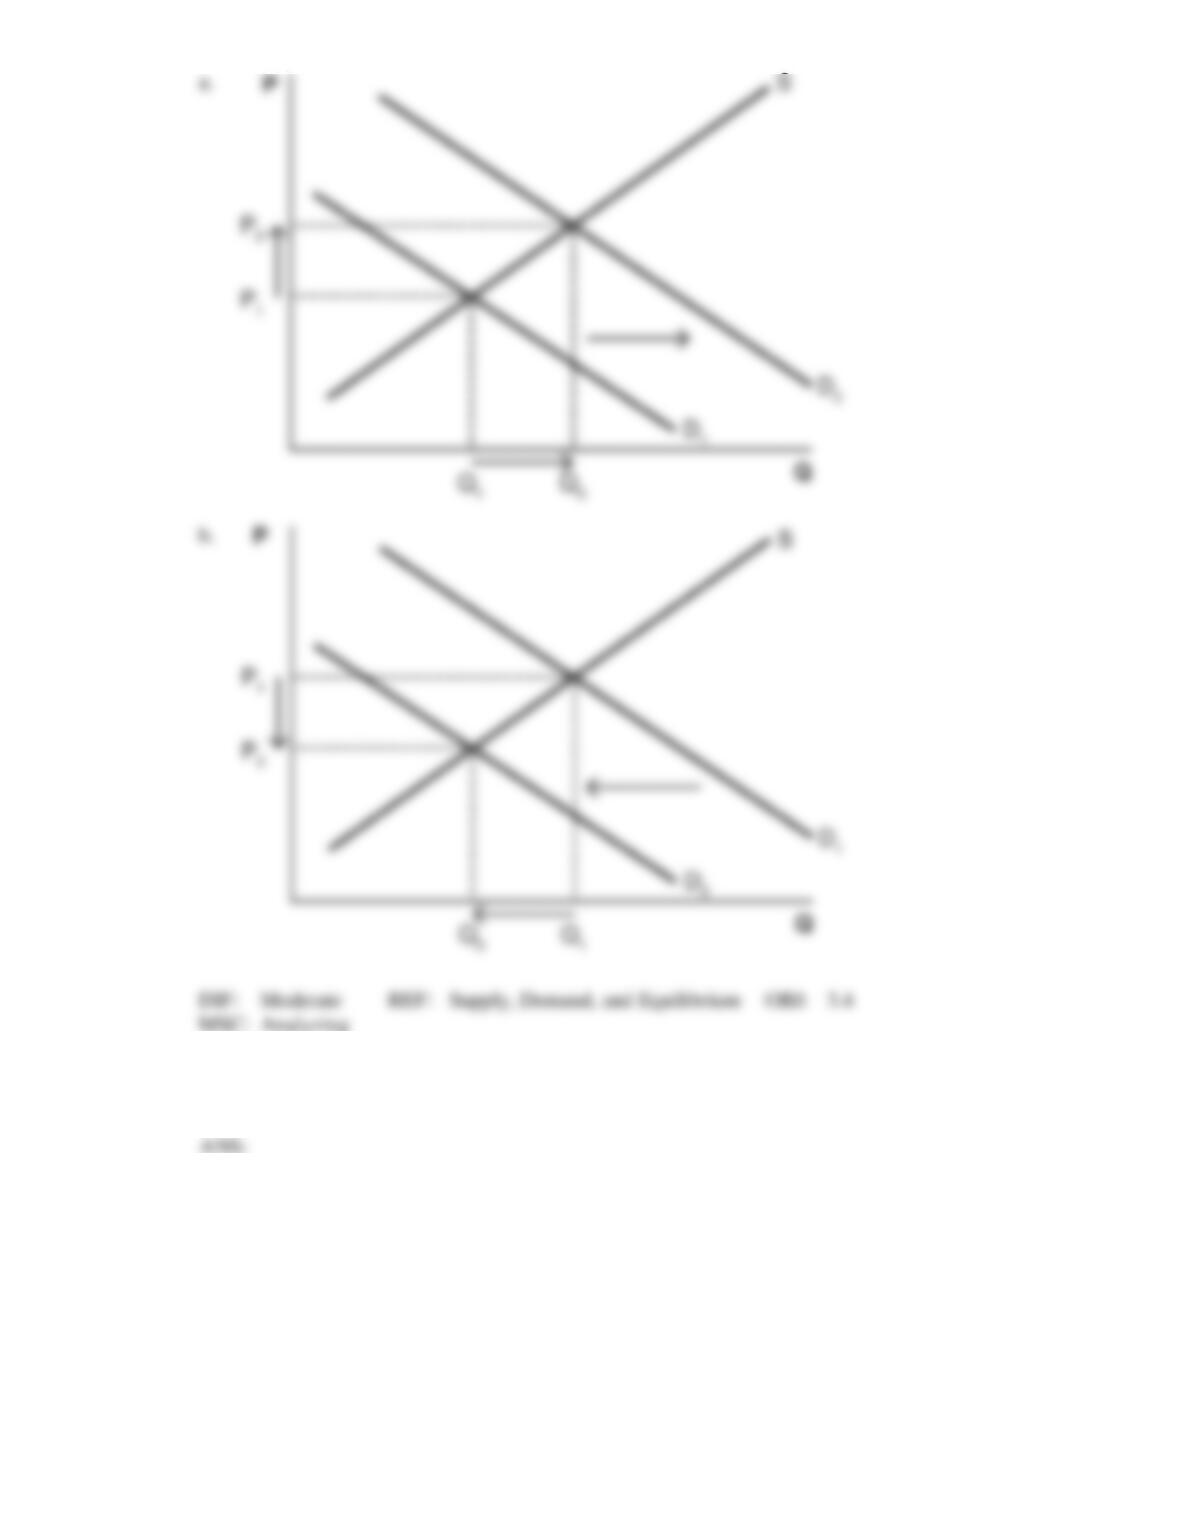
11. Using a supply and demand graph, show what happens to the equilibrium price and quantity for the
following goods if, holding all else constant, income increases.
a. a normal good
b. an inferior good
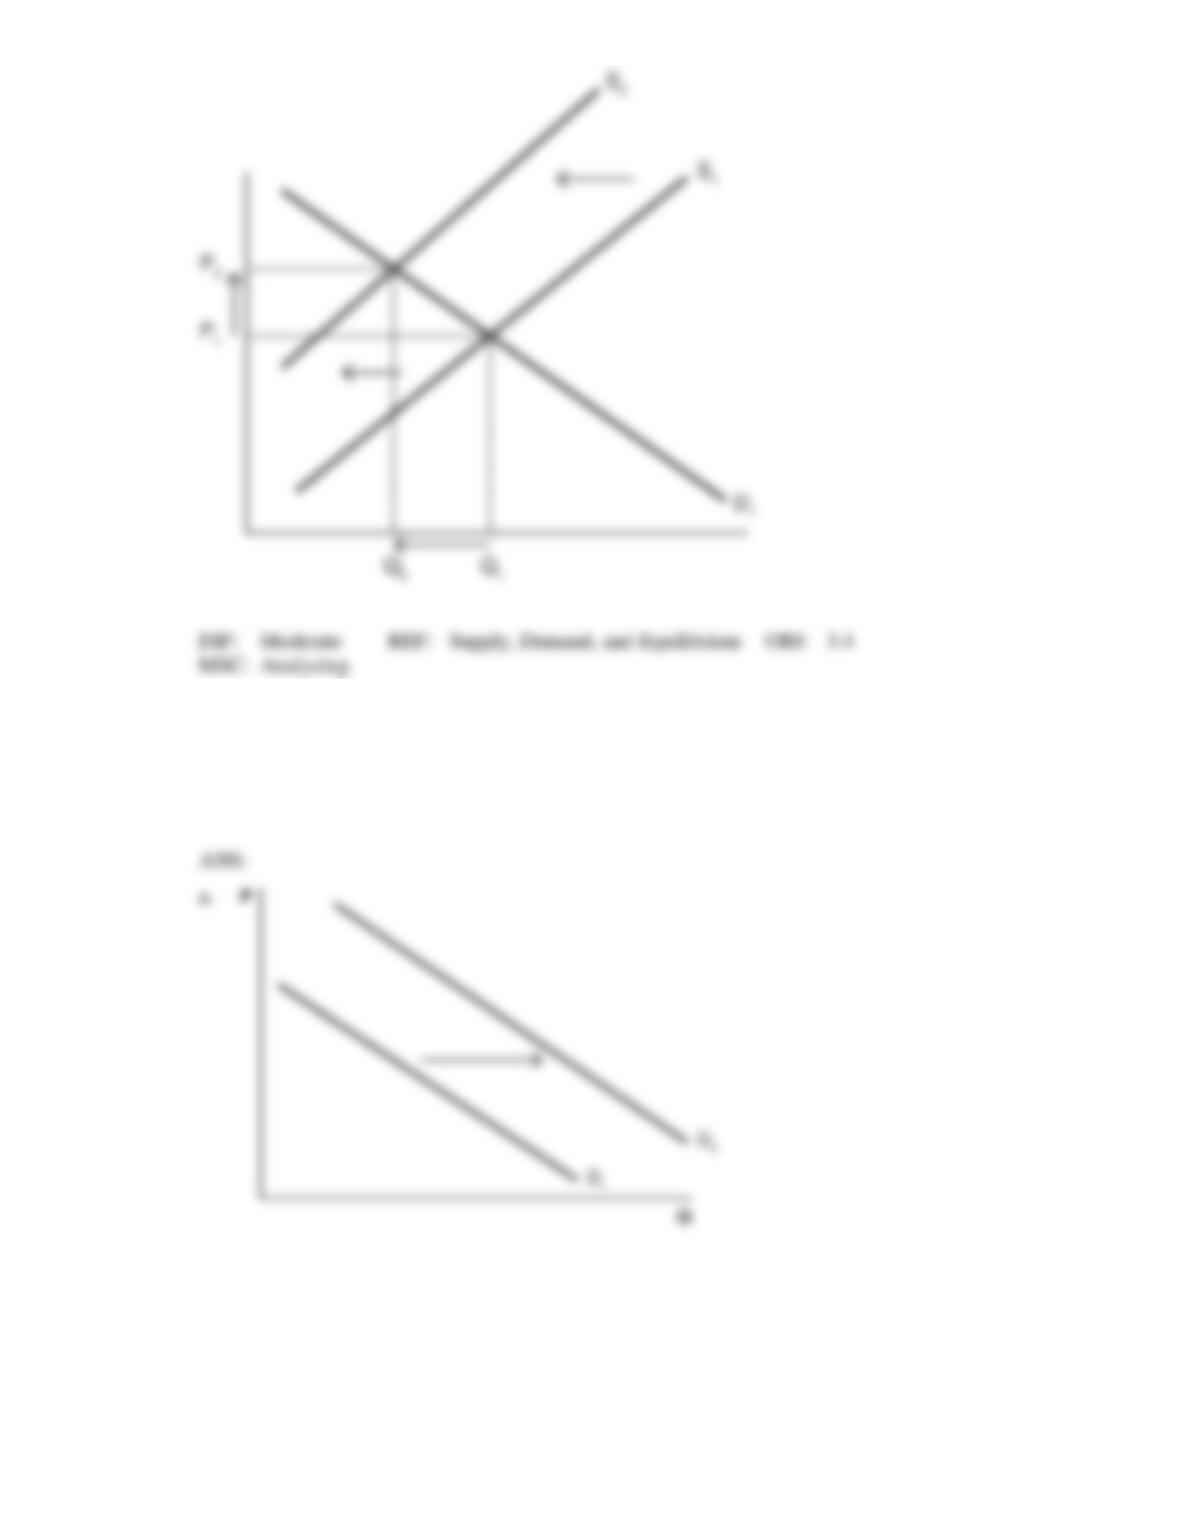
12. Using a supply and demand model, show what happens to the equilibrium price and equilibrium
quantity in the market for cigarettes when the government imposes a tax on their production.
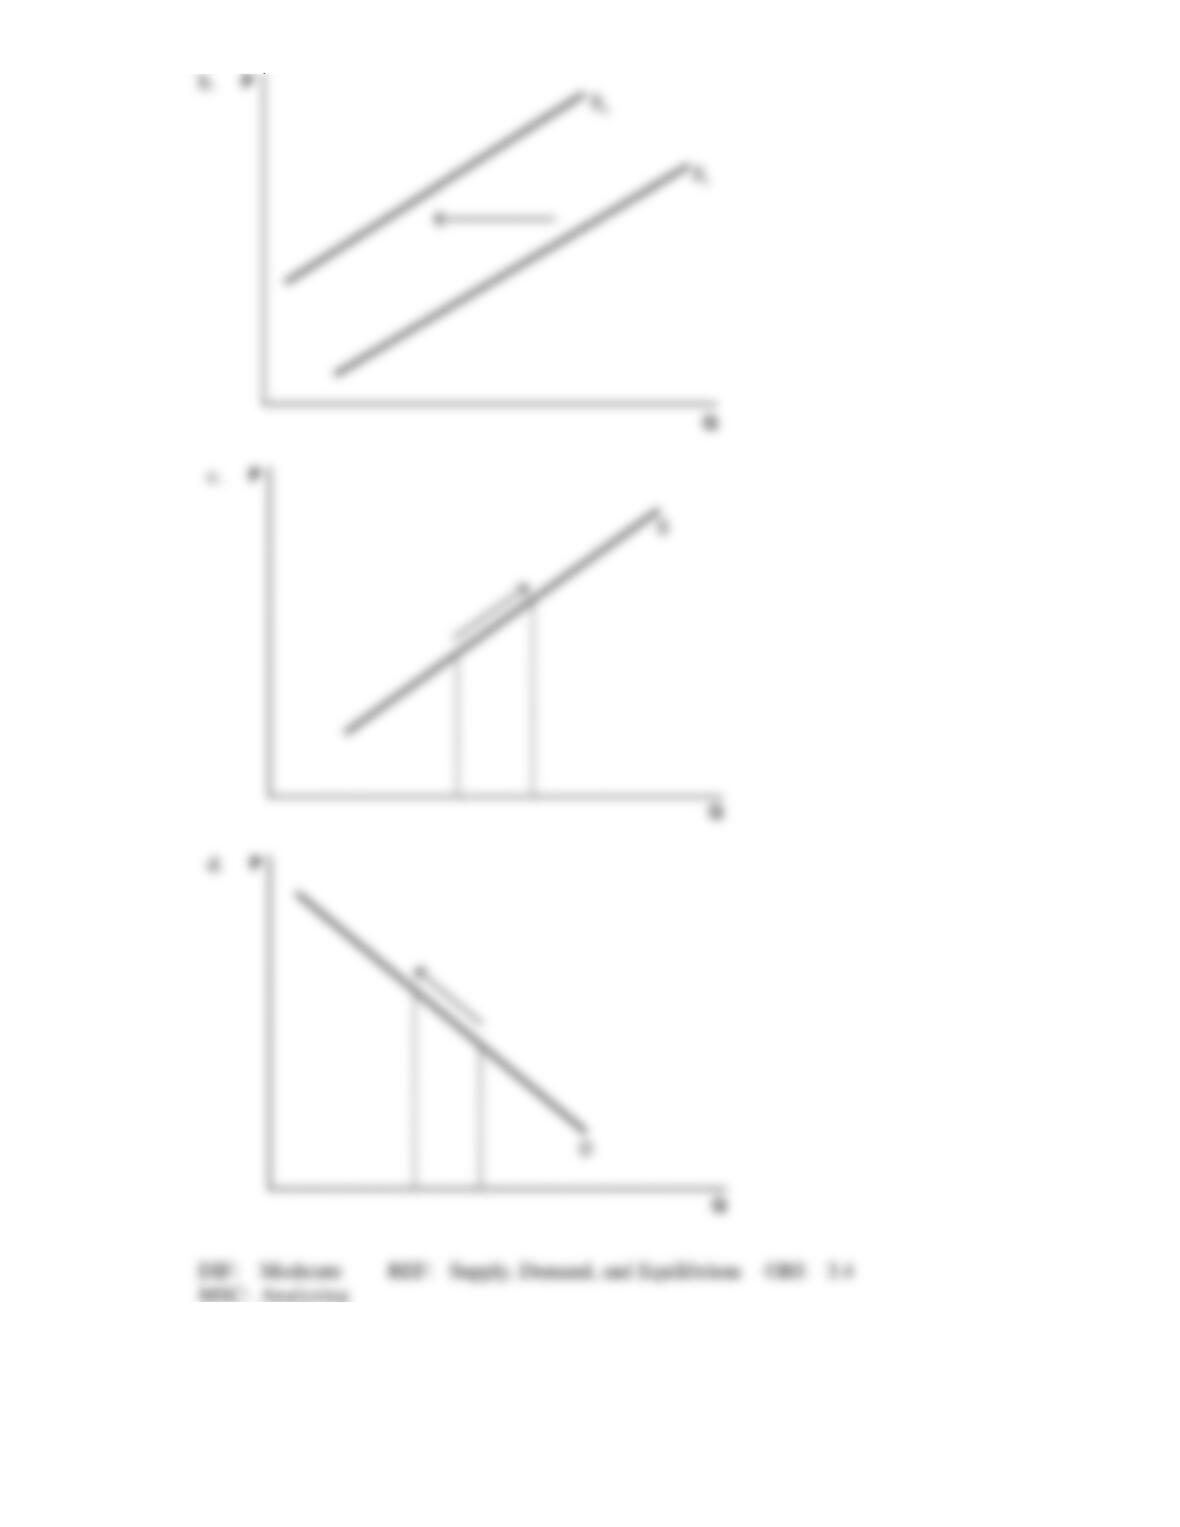
13. Draw a graph showing the following:
a. a positive change in demand.
b. a negative (or adverse) change in supply.
c. a positive change in quantity supplied.
d. a negative (or adverse) change in quantity demanded.
14. Use the accompanying graph to answer the questions.
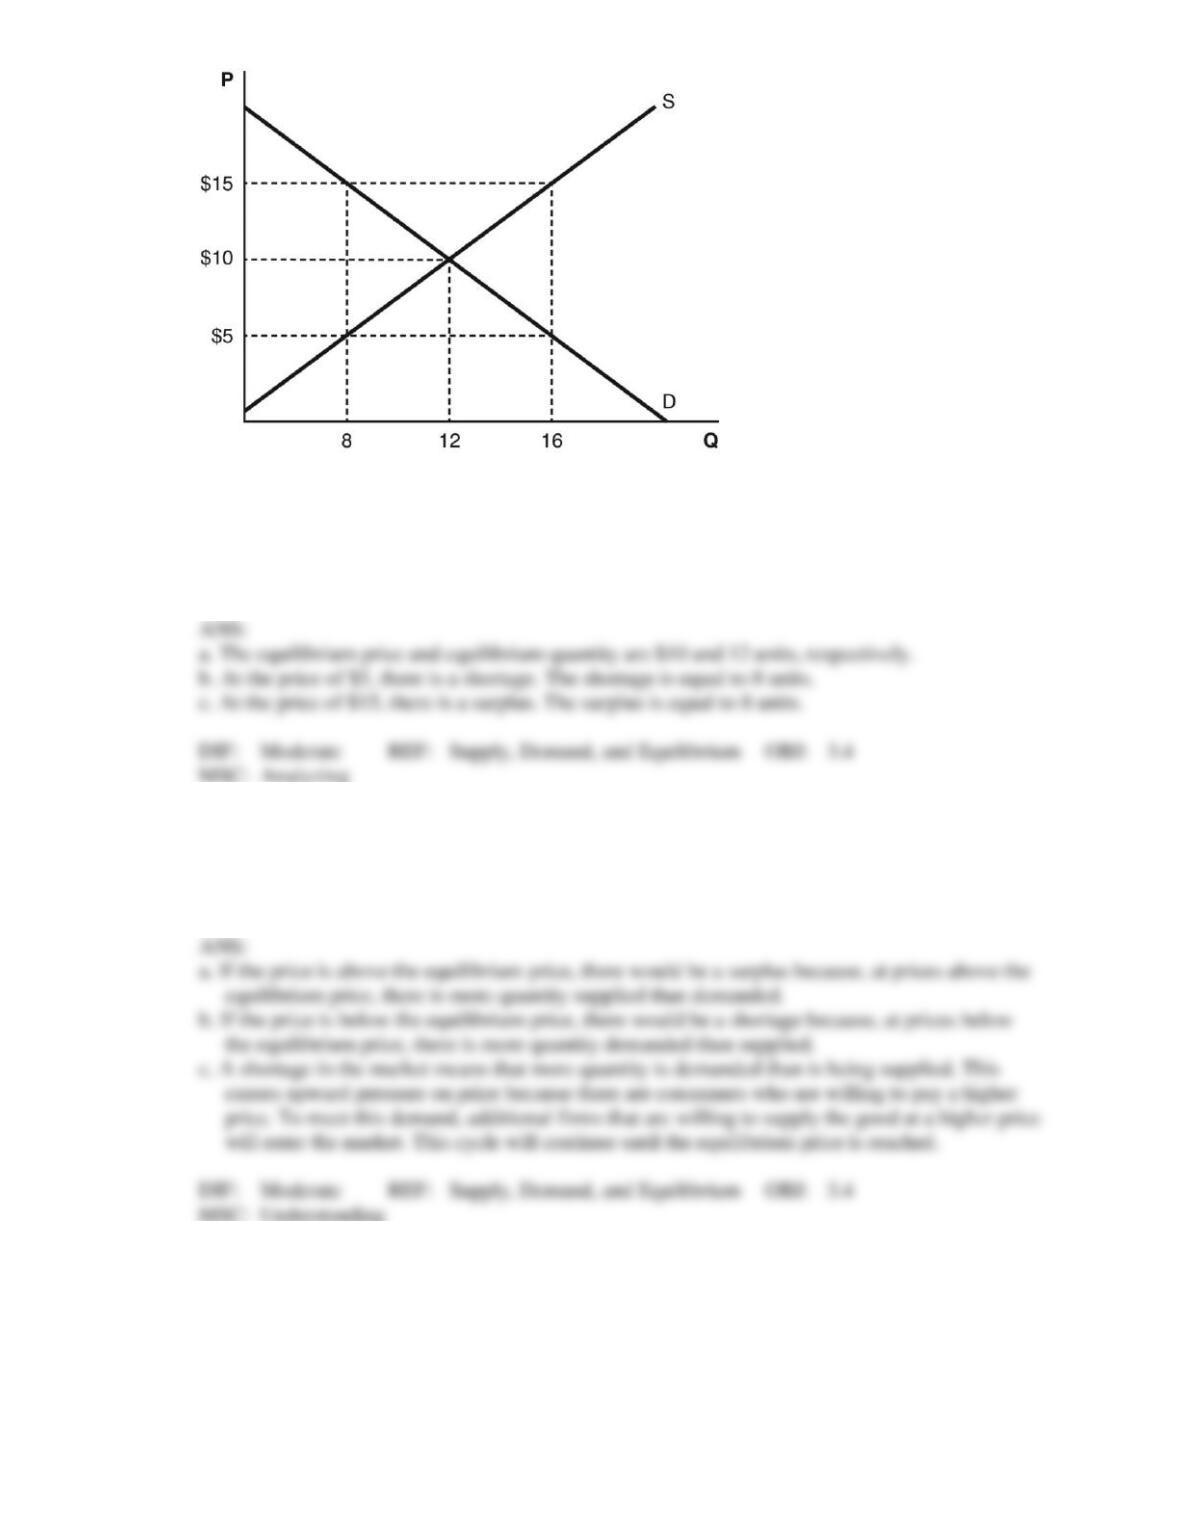
a. What is the equilibrium price and equilibrium quantity?
b. At the price of $5, is there a shortage or a surplus? What is the amount of this shortage or
surplus?
c. At the price of $15, is there a shortage or a surplus? What is the amount of this shortage or
surplus?
15. Answer the following questions about a market that is perfectly competitive:
a. If the price is above the equilibrium price, would there be a shortage or a surplus?
b. What will happen if the price is below the equilibrium price?
c. During a shortage, how does the market respond until it once again reaches equilibrium?
16. Please use the following supply and demand schedules to answer the questions below:
Price Quantity Demanded Quantity Supplied
$0 25 0
$5 15 5
$10 10 10
$15 5 20
$20 0 30
a. At what prices will we see a shortage?
b. At what prices will we see a surplus?
c. What is the equilibrium price and quantity for this market?
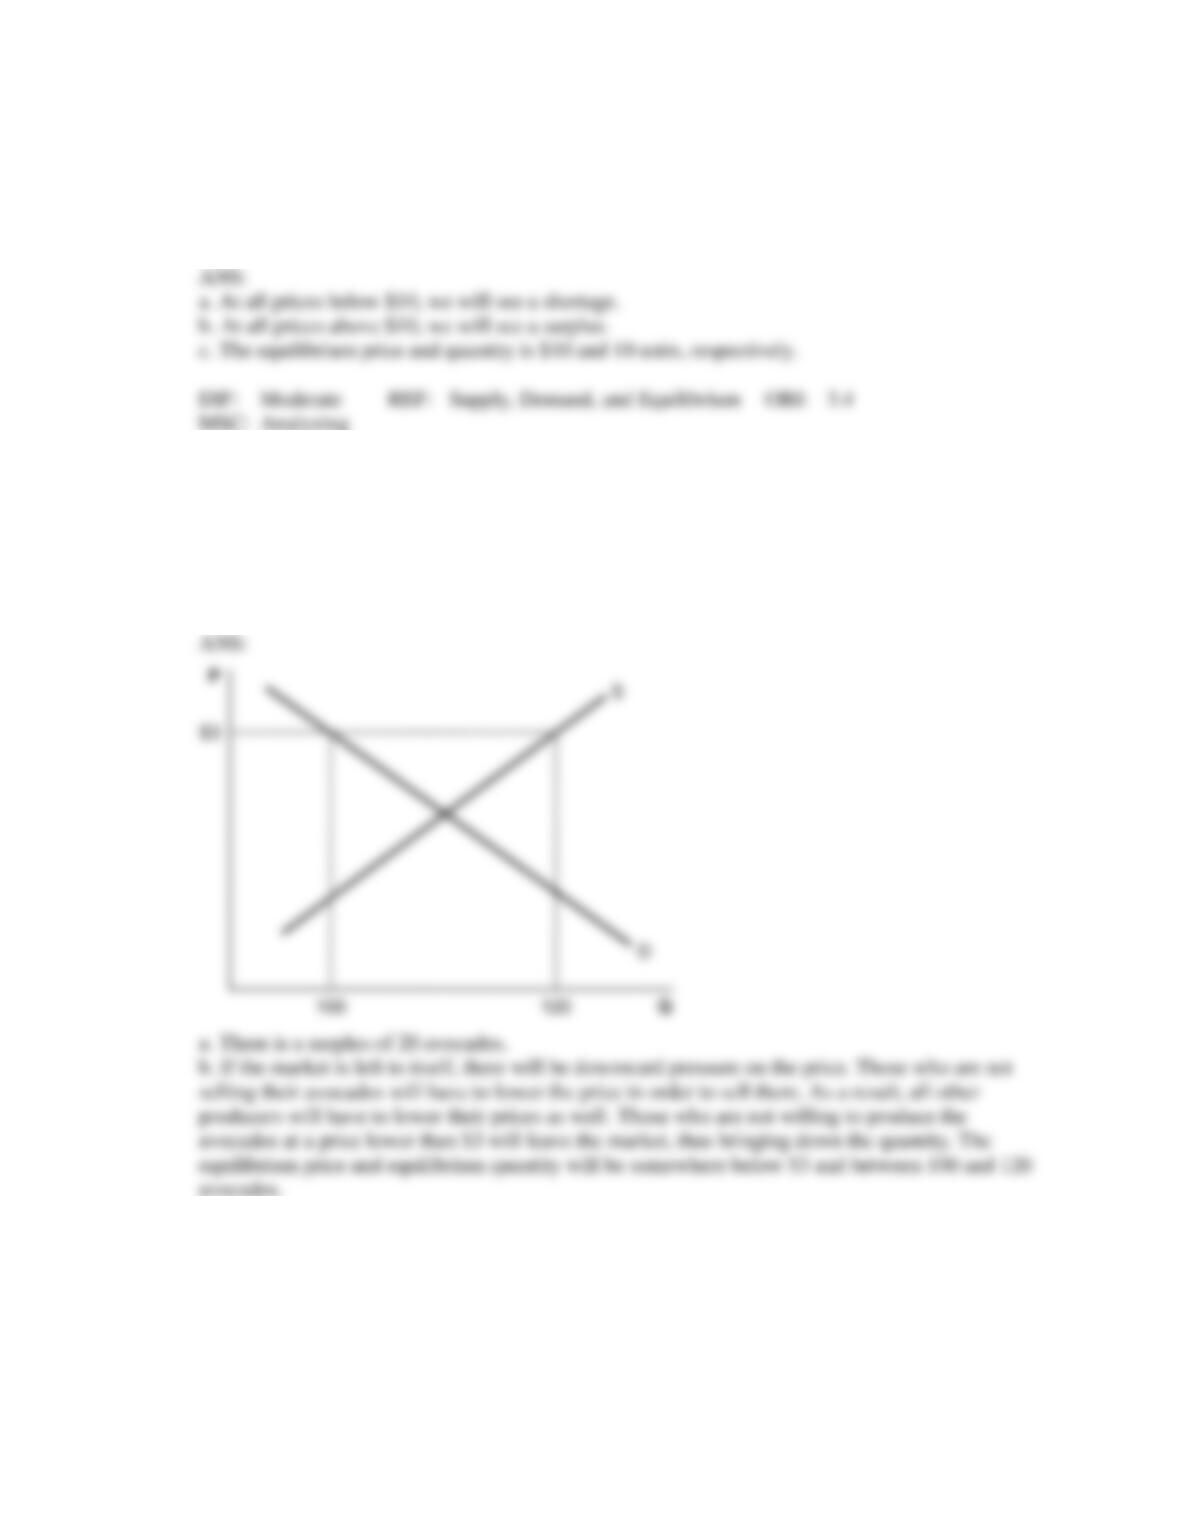
17. At the farmer’s market in Irvine, California, the price of avocados is set at $3 each. At that price,
120 avocados are supplied but only 100 are purchased. Represent this on a supply and demand
graph and answer the following questions:
a. Is there a shortage or surplus of avocados? How much is the shortage or surplus?
b. Without any government intervention, what will happen to the price and quantity of avocados?
c. Represent part b on a graph.
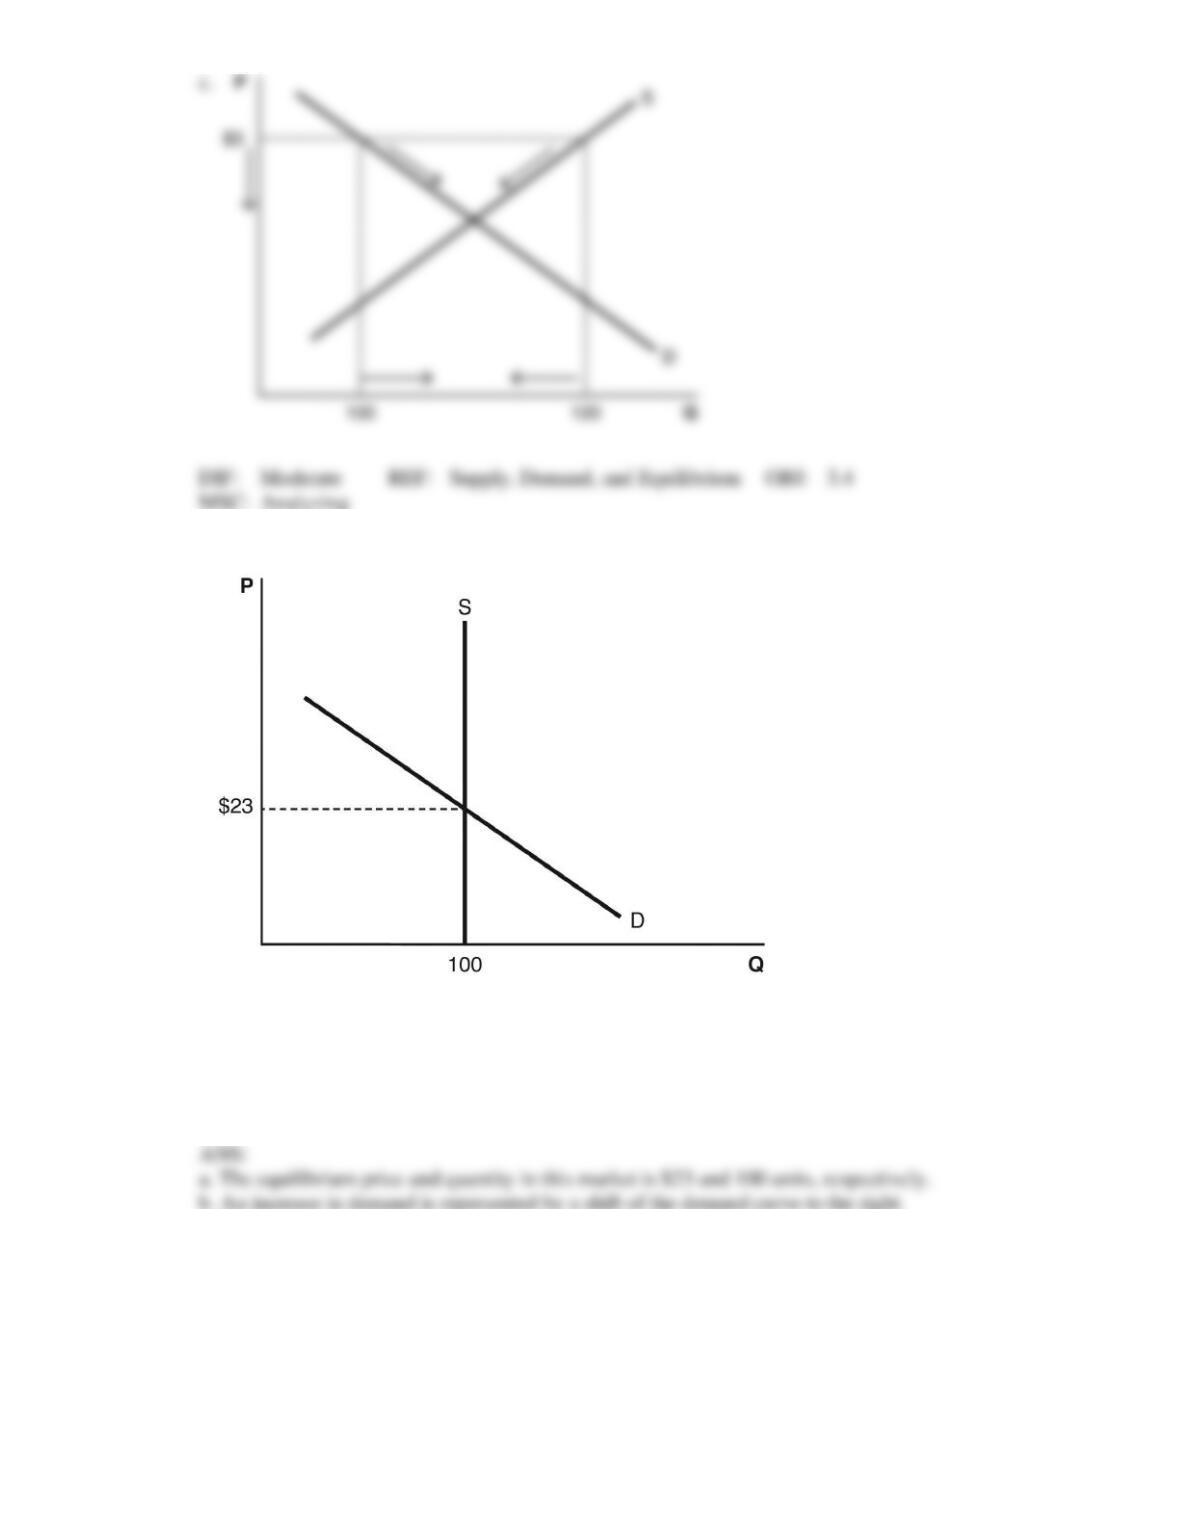
18. Use the accompanying graph to answer the following questions.
a. What is the equilibrium price and equilibrium quantity in this market?
b. Draw an increase in demand and explain what happens to the equilibrium price and equilibrium
quantity.
c. This is a special type of supply curve that we call an inelastic supply curve. What special
property does it have?
19. Selena is running for political office and she has just stated an unpopular opinion that free trade
makes products cheaper. How could this be explained in words to a meeting of economists who
obviously know about supply and demand?
20. We are given the following supply and demand equations: QD = 100 − 2P QS = 10 + P
a. What will be the quantity demanded at a price of $40?
b. What will be the quantity supplied at the price of $30?
c. What is the equilibrium price and equilibrium quantity?
21. We are given the following equations where P is price and Q is quantity:
Equation 1: P = 300 − 10Q Equation 2: P = 5Q
a. Which equation represents the demand curve? Why?
b. What is the equilibrium price and equilibrium quantity?
c. At a price of $150, is there a shortage, surplus, or neither? If there is a shortage or surplus, what
is the amount of that shortage or surplus?
22. In 1985, International Data Corp. (IDC) estimated that 3.7 million desktop computers had been
sold at an average price of $1,054. In 2000, the number sold in the United States had risen to 132
million, with the average price decreasing to $700. The change in individuals’ tastes and
preferences has increased their demand for computers. Explain how the price of computers
dropped over the 15-year period from 1985 to 2000.
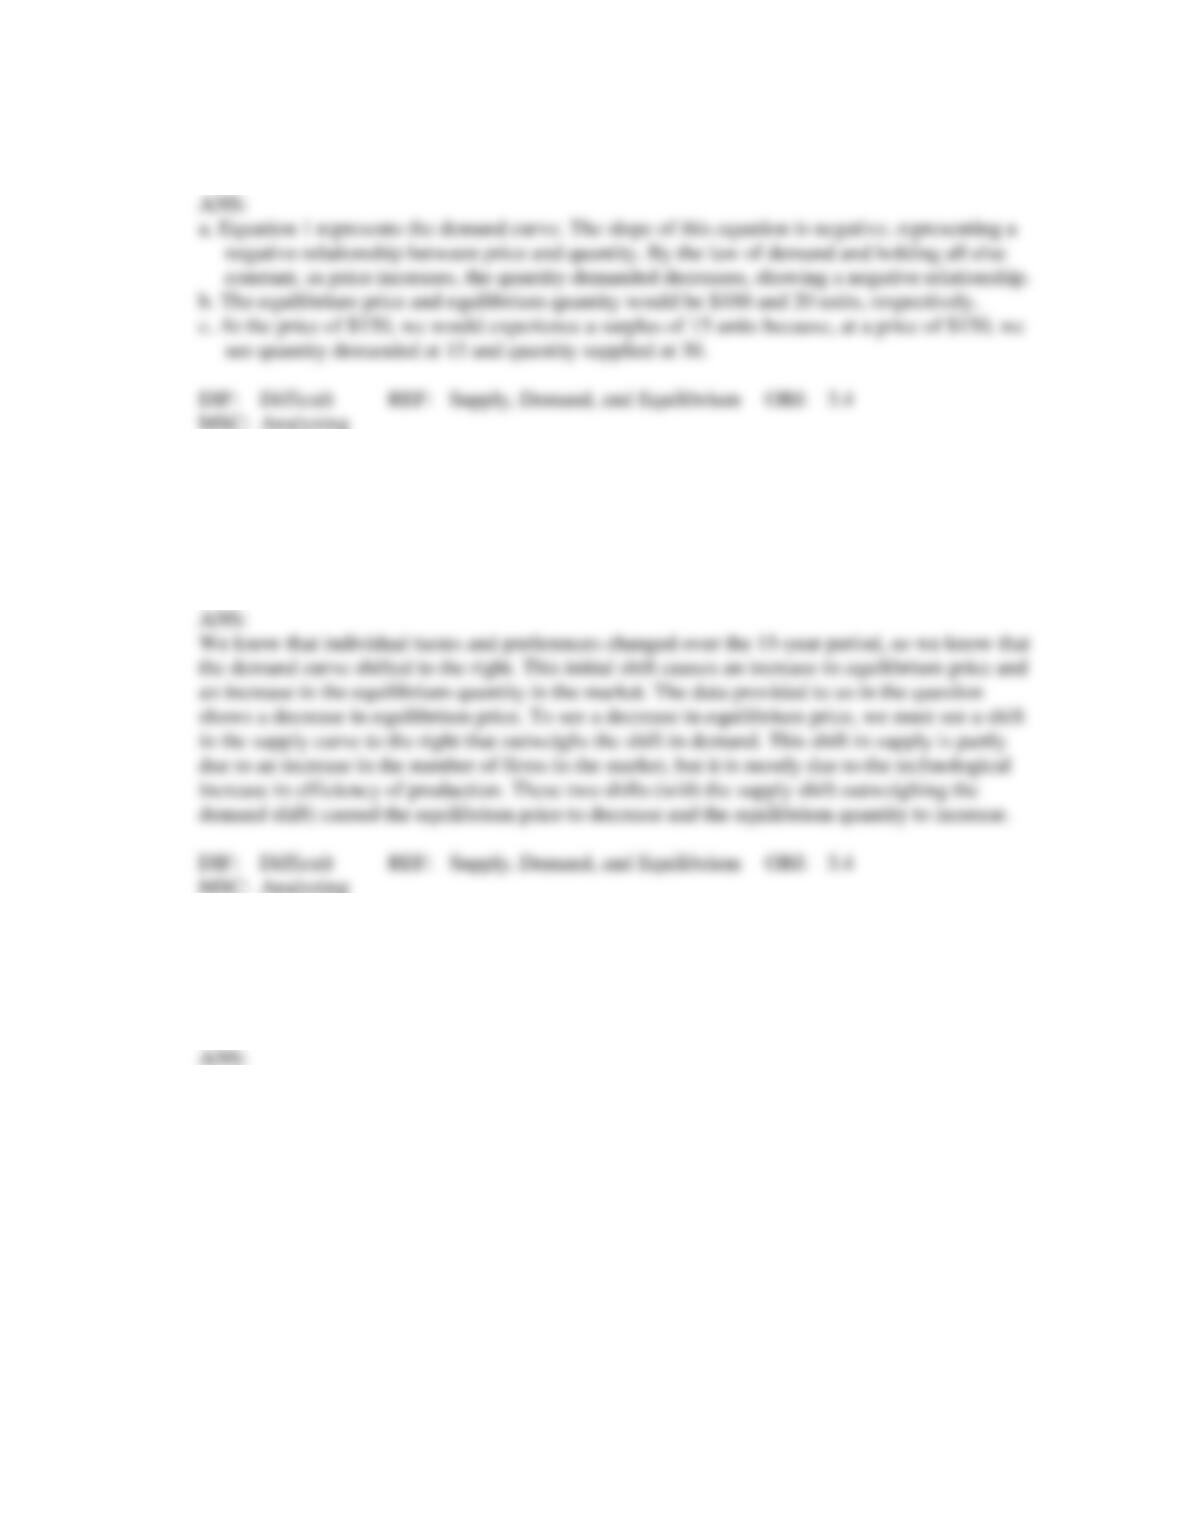
23. During the hot summer months, more people want lemonade because it is refreshing. Accordingly,
more lemonade stands pop up during the summer months. What happens to the equilibrium price
and equilibrium quantity in the lemonade market during the summer? Provide a short explanation
and create a supply and demand model to illustrate your points.
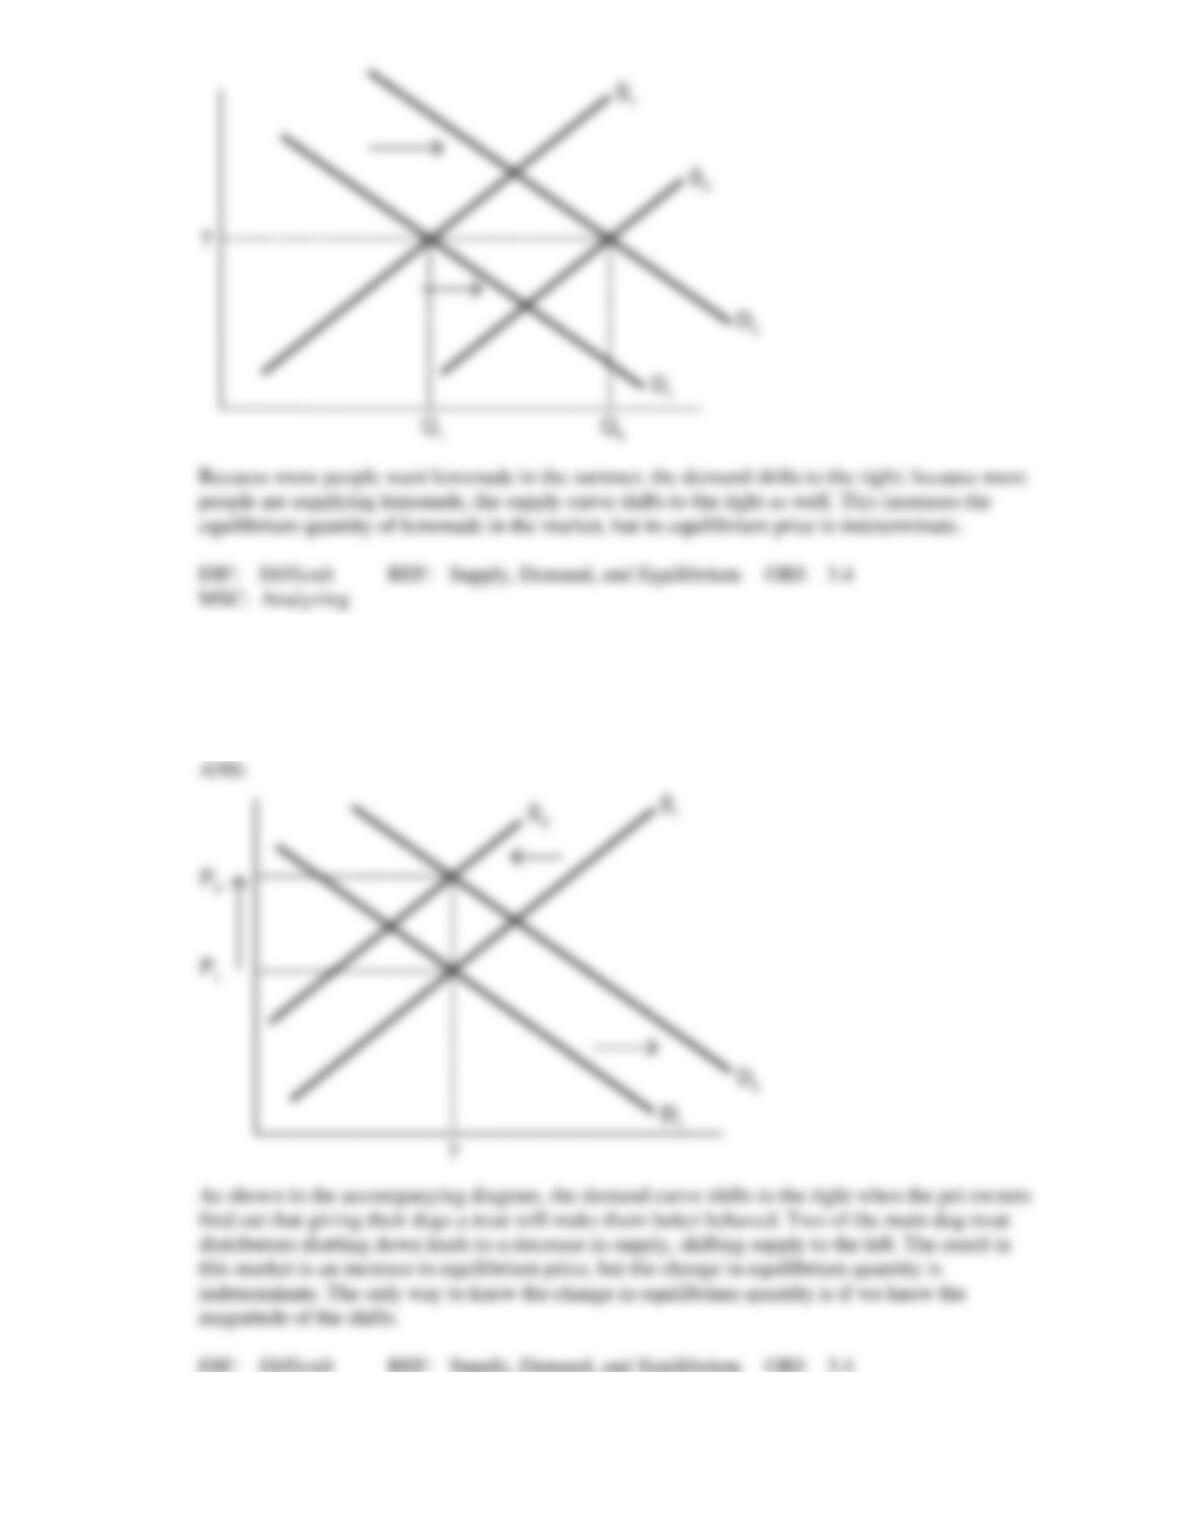
24. There is a competitive market for dog treats in Earltown. What would happen to the equilibrium
price and quantity of dog treats if a study showing that treats improve dogs’ behavior is published
at the same time that two of the main dog-treat distributors shut down? Use a supply and demand
graph in your analysis.
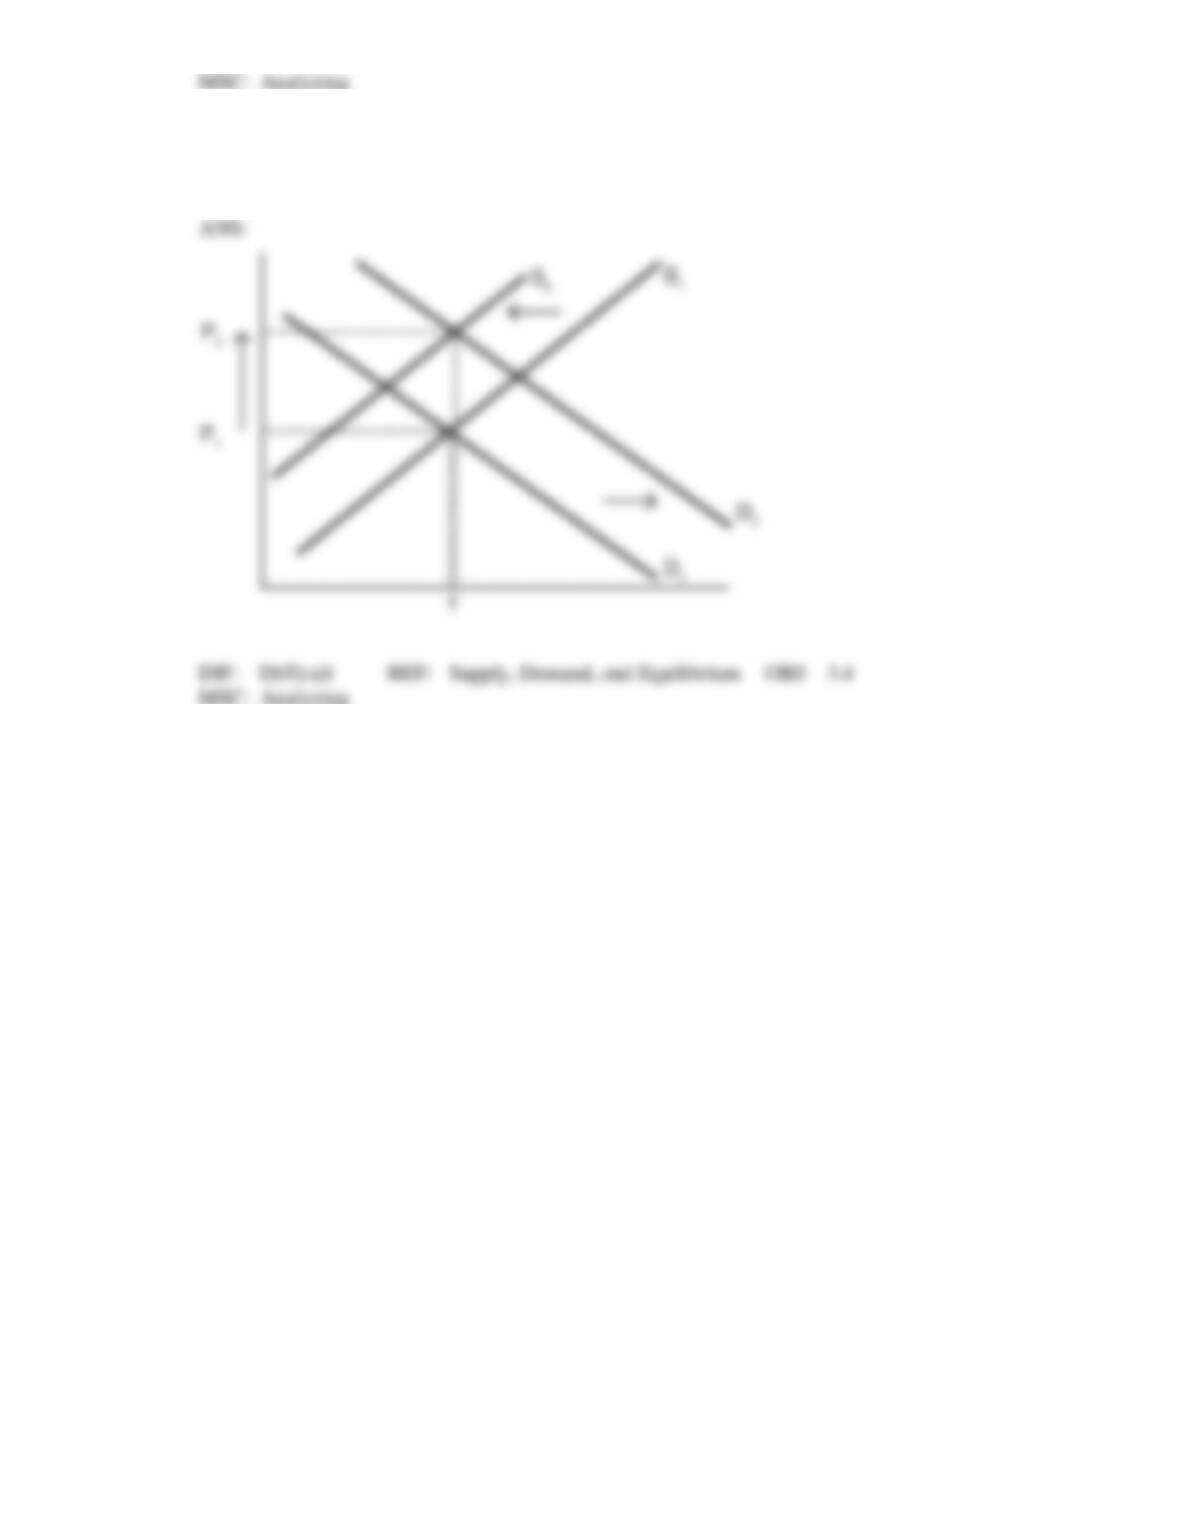
25. Macroeconomists often say, “The reason we have inflation is that everyone expects inflation.”
Using the supply and demand model, show what happens to price when both consumers and
producers expect the price of a particular good to increase in the future.