3-34
141. Consider the market for ride-on lawn mowers and the recent increases in the price of oil. The recent
increase in the price of oil makes it more expensive to manufacture ride-on lawn mowers. An increase in
the price of oil also makes it more expensive to run a ride-on mower. If the price of oil increases, the
demand for ride-on mowers will ______ and the supply will _______.
142. Consider the market for ride-on lawn mowers and the recent increases in the price of oil. The recent
increase in the price of oil makes it more expensive to manufacture ride-on lawn mowers. An increase in
the price of oil also makes it more expensive to run a ride-on mower. What factors of demand and/or
supply are affected by the changing price of oil?
143. Consider the market for ride-on lawn mowers and the recent increases in the price of oil. The recent
increase in the price of oil makes it more expensive to manufacture ride-on lawn mowers. An increase in
the price of oil also makes it more expensive to run a ride-on mower. What is likely to happen to
equilibrium price and quantity of lawn mowers as a result in the changing price of oil? Supply and demand
will both:
144. This table shows the demand and supply schedule of a good.
Price of Good
QDemand
Qsupply
$0.00
50
25
$0.50
40
26
$1.00
35
28
$1.50
31
31
$2.00
28
35
$2.50
27
40
According to the table shown, the equilibrium in this market will occur at:
145. This table shows the demand and supply schedule of a good.
Price of Good
QDemand
Qsupply
$0.00
50
25
$0.50
40
26
$1.00
35
28
$1.50
31
31
$2.00
28
35
$2.50
27
40
According to the table shown, at a price of $1.00:
146. This table shows the demand and supply schedule of a good.
Price of Good
QDemand
Qsupply
$0.00
50
25
$0.50
40
26
$1.00
35
28
$1.50
31
31
$2.00
28
35
$2.50
27
40
According to the table shown, at a price of $2.00 quantity demanded:
147. This table shows the demand and supply schedule of a good.
Price of Good
QDemand
Qsupply
$0.00
50
25
$0.50
40
26
$1.00
35
28
$1.50
31
31
$2.00
28
35
$2.50
27
40
According to the table shown, at a price of $0.50 quantity demanded:
148.
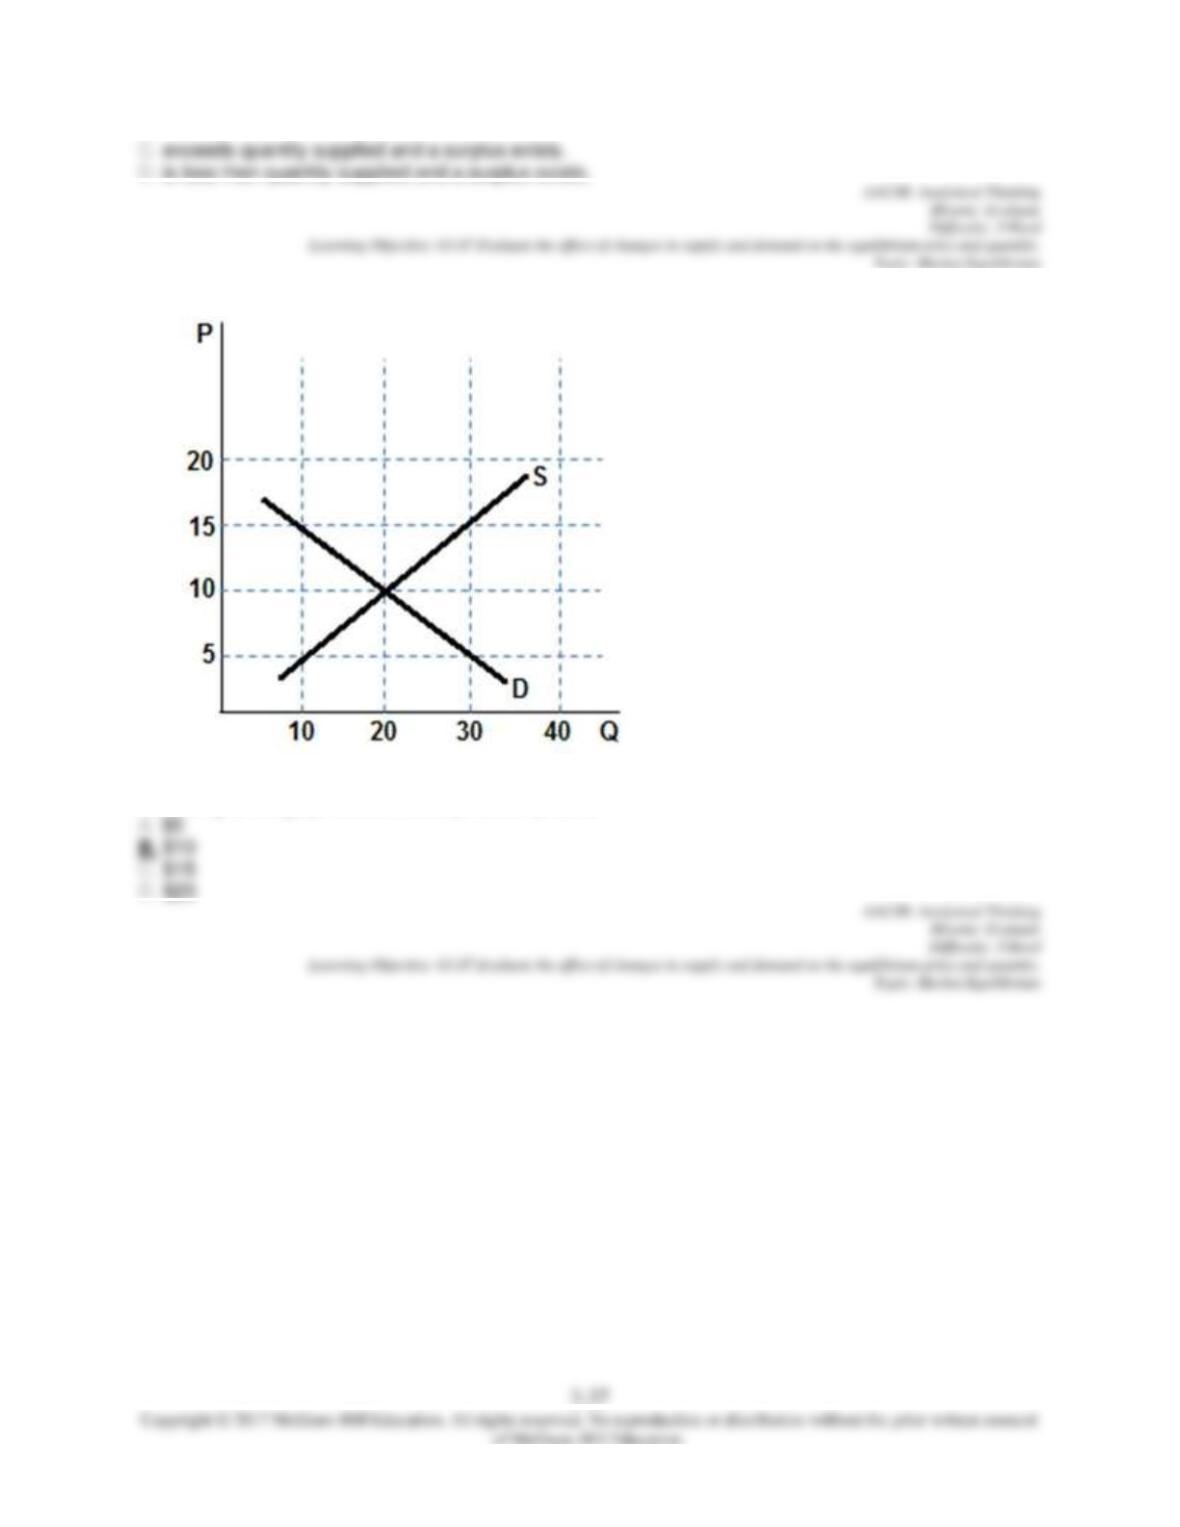
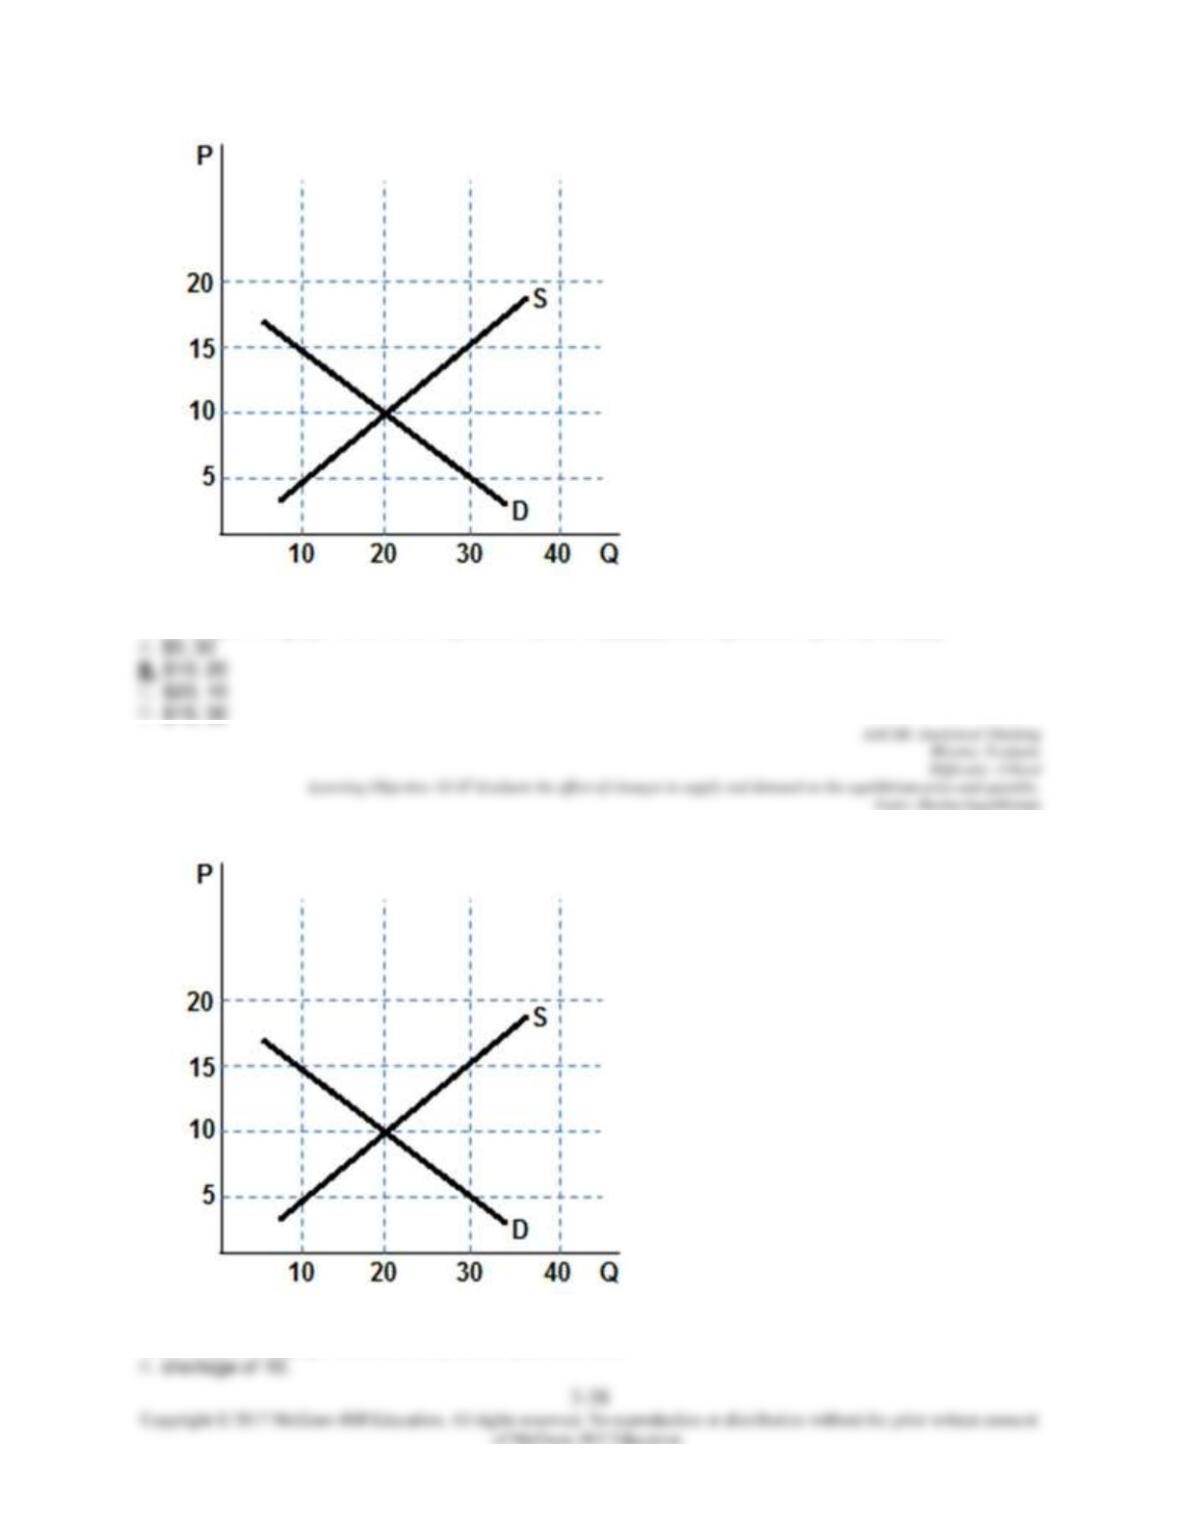
According to the graph shown, the equilibrium price is:
149.
According to the graph shown, the equilibrium price is ______ and equilibrium quantity is ____.
150.
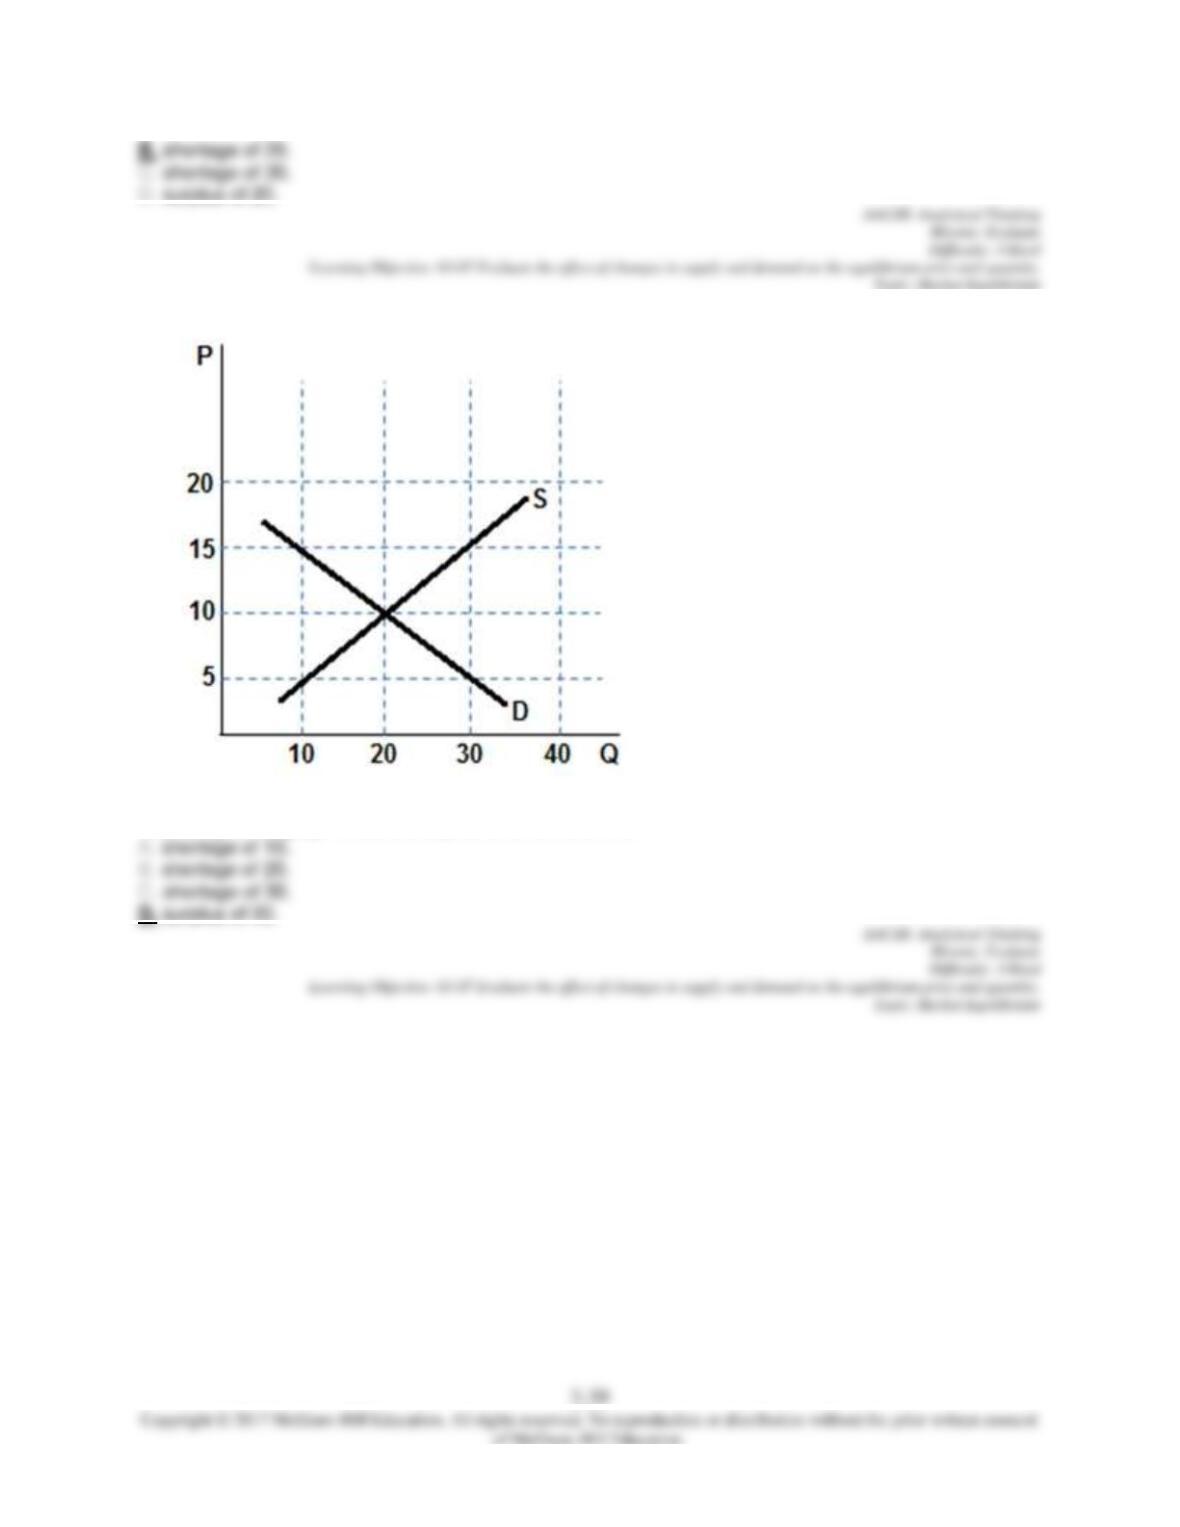
According to the graph shown, at a price of $5, there is a:
151.
According to the graph shown, at a price of $15, there is a:
152.
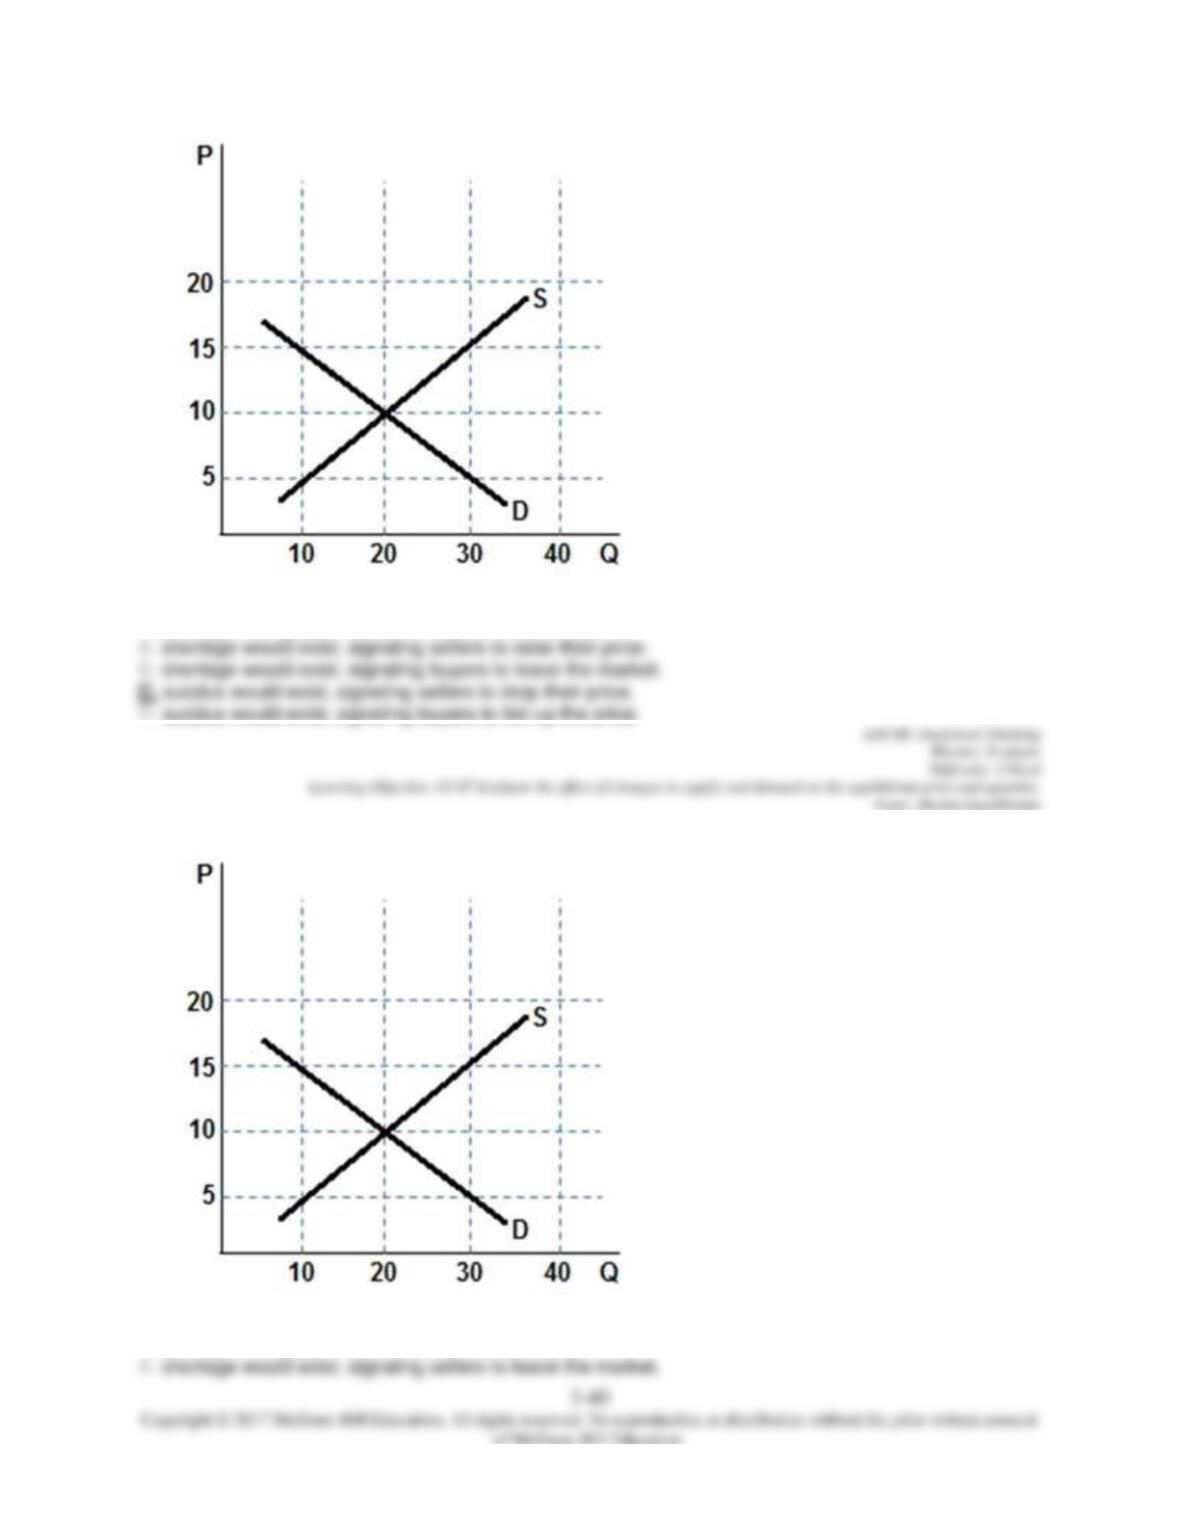
According to the graph shown, if the price were $15, a:
153.
According to the graph shown, if the price were $5 a:
154.
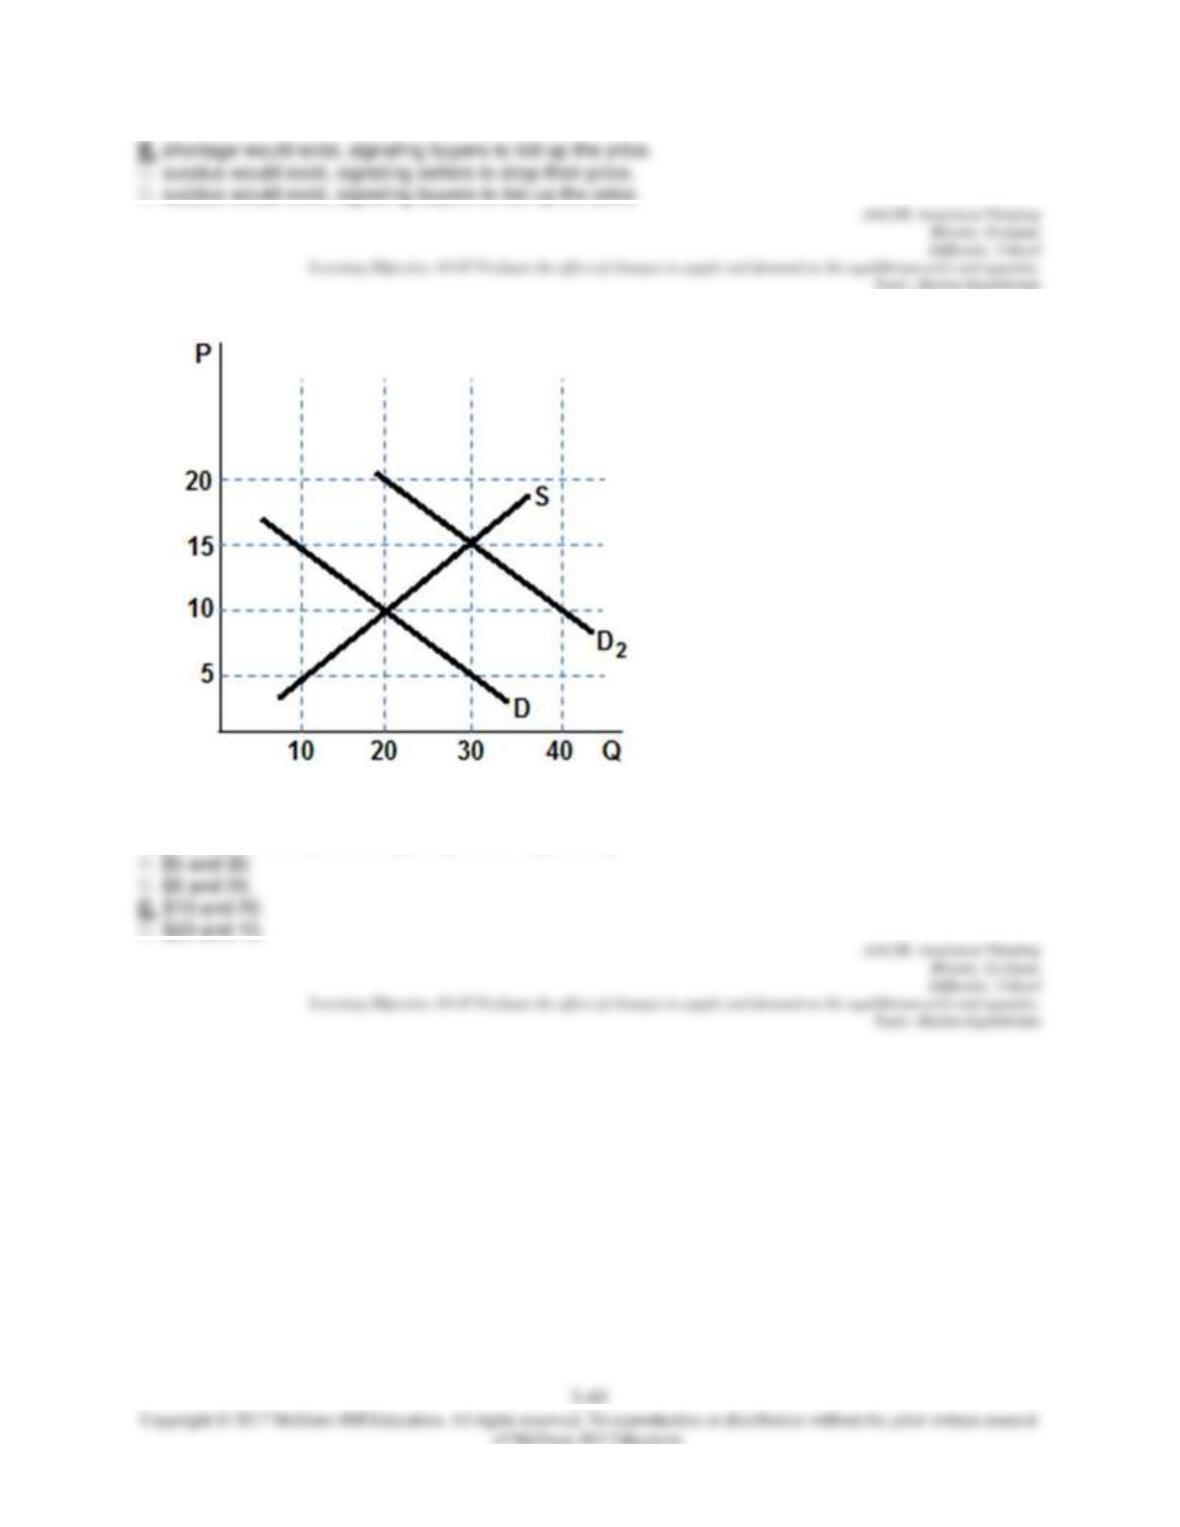
Assume the market in the graph shown was originally at an equilibrium with demand D and supply S. The
original equilibrium price and quantity were, respectively:
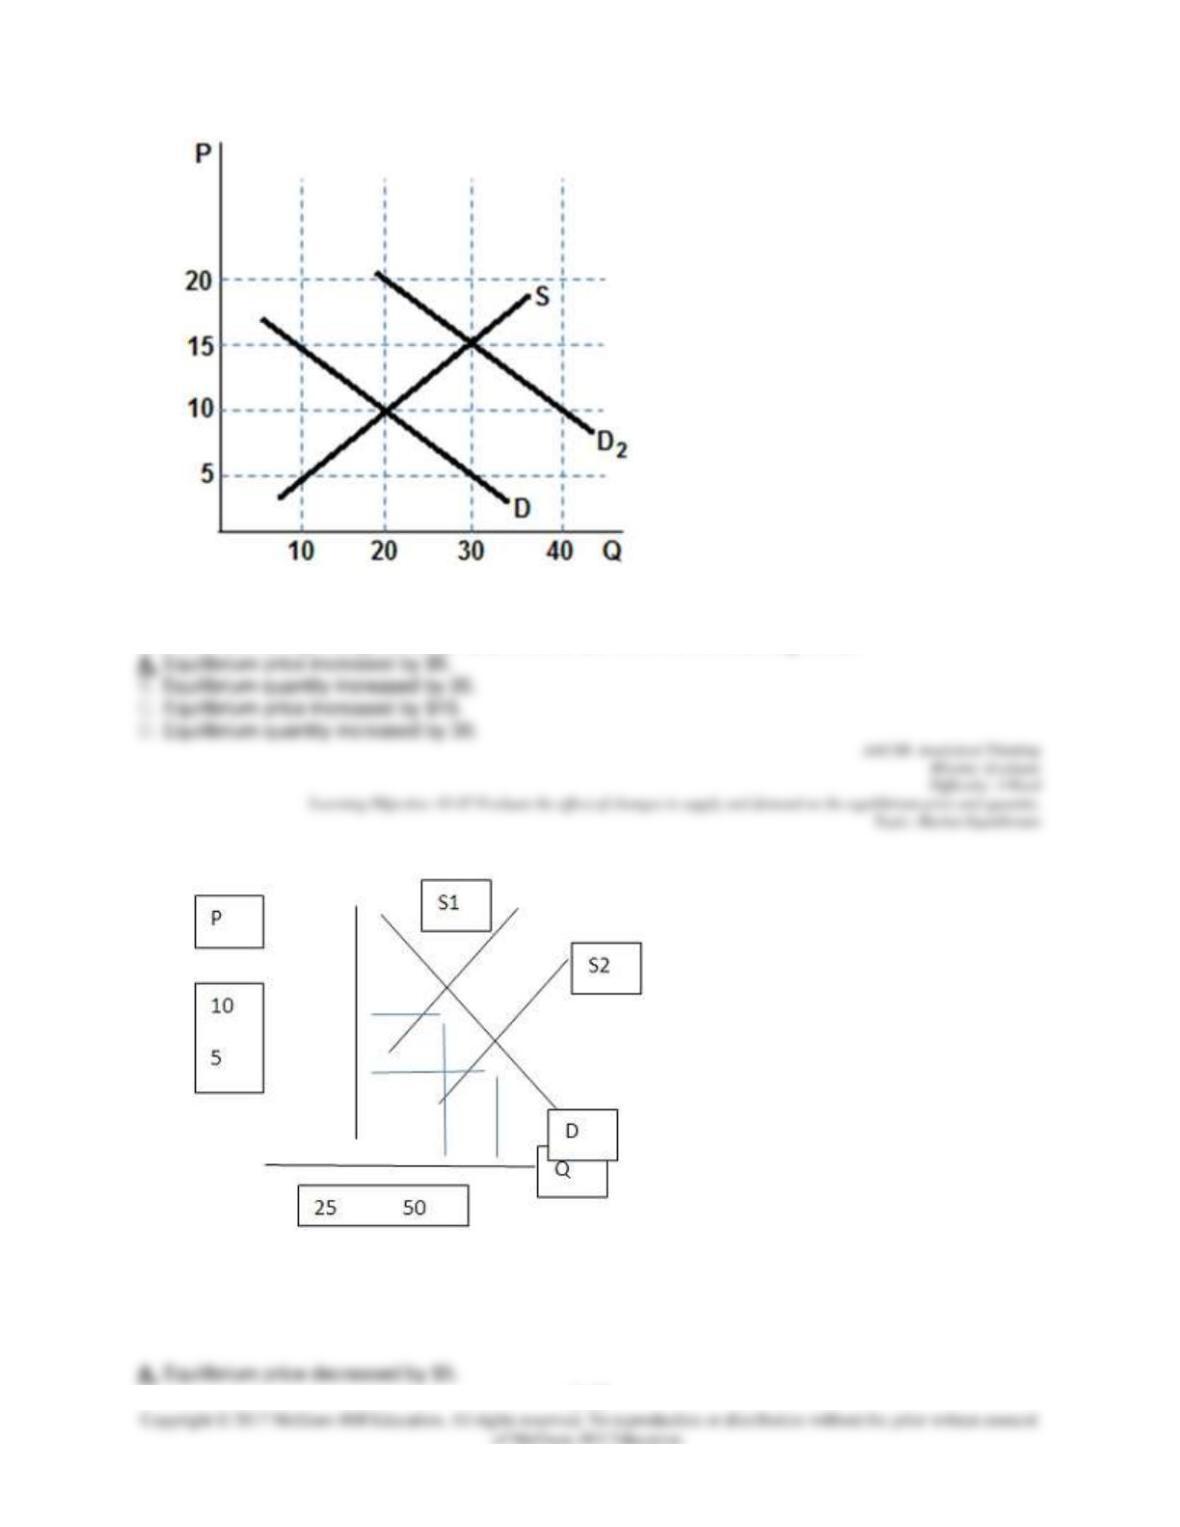
3-42
155.
Assume the graph shown represents the market for bottles of wine and was originally in equilibrium with
D and S. Something changes and demand shifts to D2. Which of the following is true?
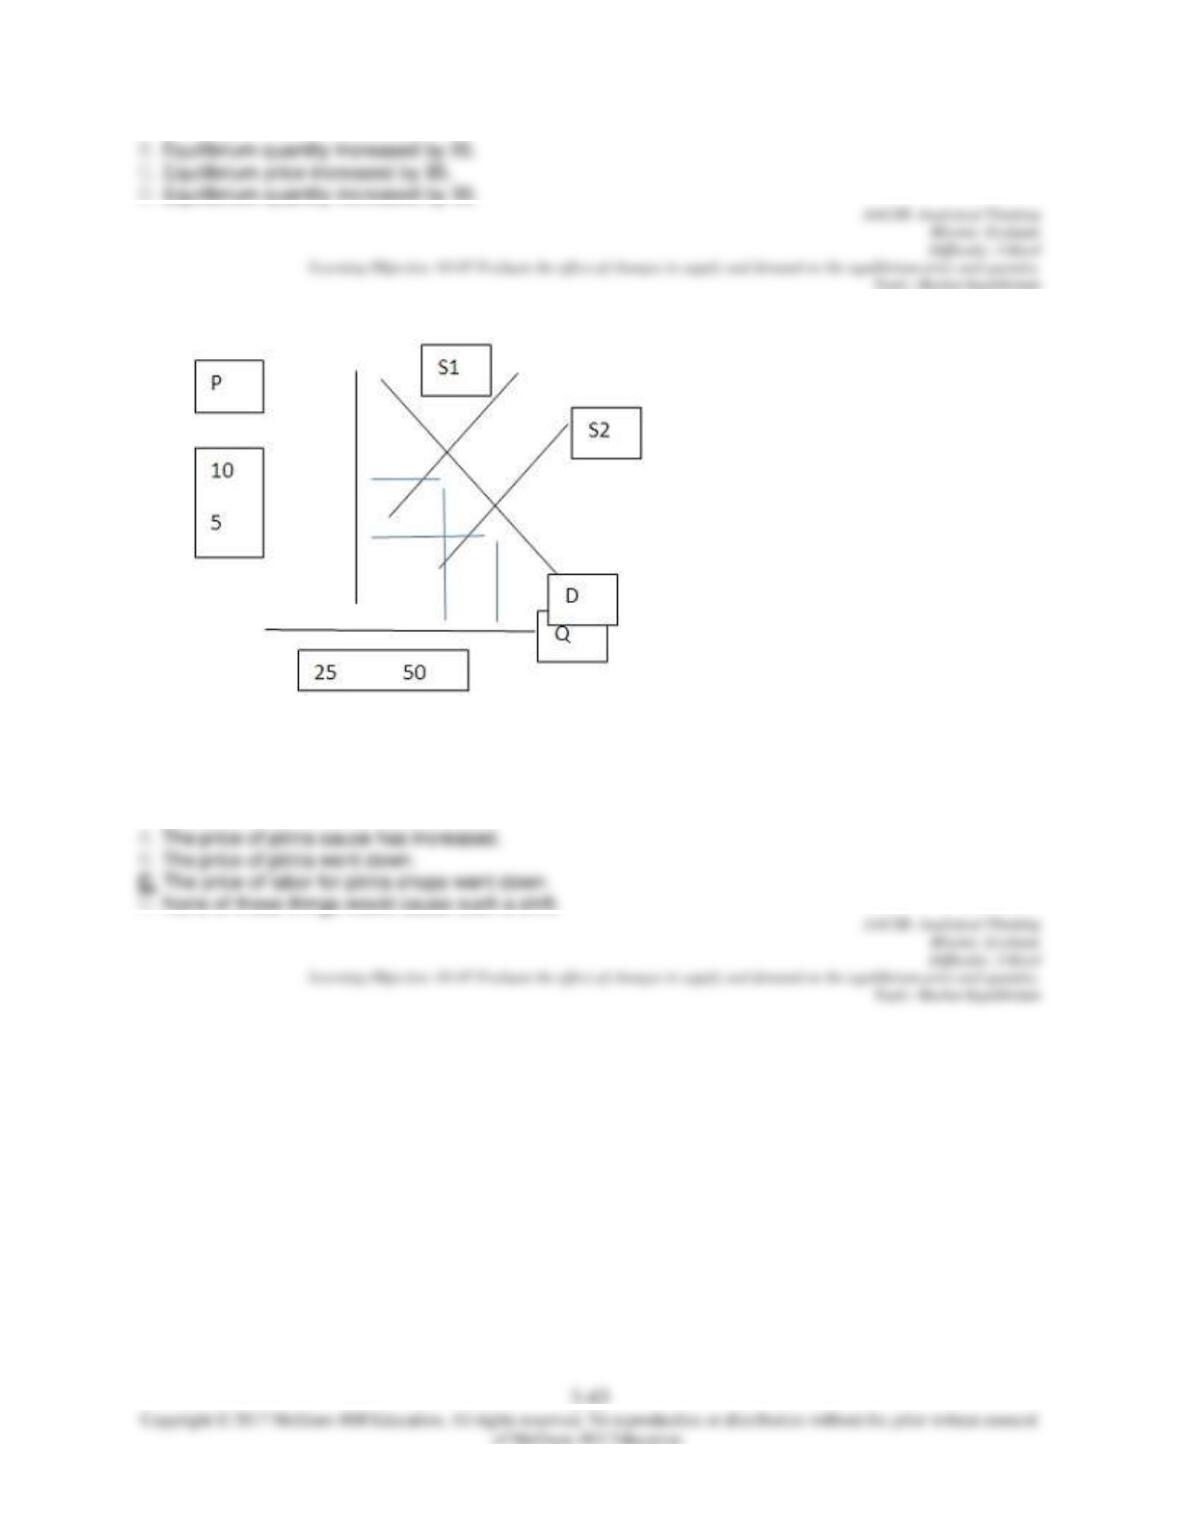
156.
Assume the graph shown represents the market for pizzas sold in an hour. If the original equilibrium was
D and S1. Which of the following is true when S1 shifted to S2?
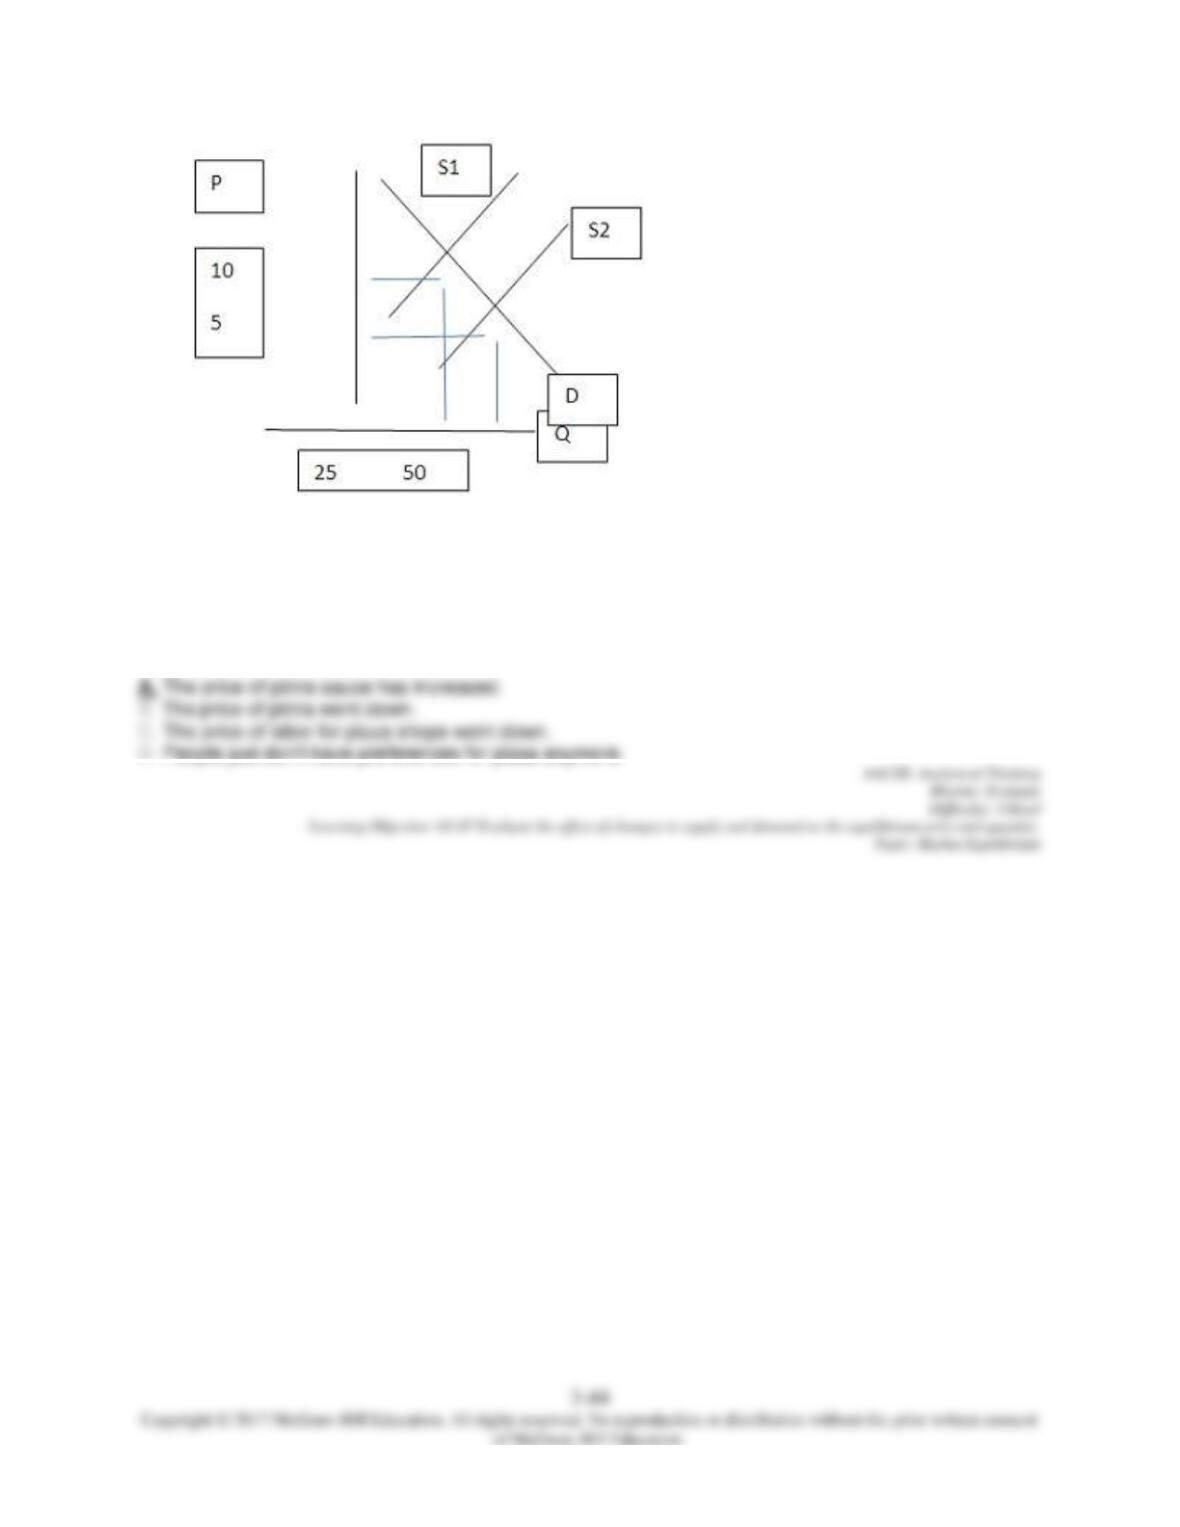
157.
Assume the graph shown represents the market for pizzas sold in an hour. If the original equilibrium was
D and S1. Which of the following could be a reason S1 shifted to S2?
158.
Assume the graph shown represents the market for pizzas sold in an hour. Which of the following could
be a reason S2 to S1?

3-45
Chapter 03 Test Bank Summary
Category
# of Questio
ns
AACSB: Analytical Thinking
67
AACSB: Reflective Thinking
91
Accessibility: Keyboard Navigation
132
Blooms: Analyze
38
Blooms: Evaluate
29
Blooms: Remember
18
Blooms: Understand
73
Difficulty: 1 Easy
16
Difficulty: 2 Medium
74
Difficulty: 3 Hard
67
Learning Objective: 03-
01 Identify the defining characteristics of a competitive market.
16
Learning Objective: 03-
02 Draw a demand curve and describe the external factors that determine demand.
42
Learning Objective: 03-
03 Distinguish between a shift in and a movement along the demand curve.
28
Learning Objective: 03-
04 Draw a supply curve and describe the external factors that determine supply.
19
Learning Objective: 03-
05 Distinguish between a shift in and a movement along the supply curve.
10
Learning Objective: 03-
06 Explain how supply and demand interact to drive markets to equilibrium.
14
Learning Objective: 03-
07 Evaluate the effect of changes in supply and demand on the equilibrium price and
quantity.
29
Topic: Change in Demand
1
Topic: Change in Quantity Demanded
2
Topic: Competitive Markets
3
Topic: Complement Goods
1
Topic: Demand
20
Topic: Demand Shift
1
Topic: Determinant of Supply
10
Topic: Determinants of Demand
23
Topic: Equilibrium
12
Topic: Market Adjustment
8
Topic: Market Economy
7
Topic: Market Equilibrium
15

3-46
Topic: Movements Along Vs Shifts in Demand
2
Topic: Price Taker
2
Topic: Shift in Supply
4
Topic: Shifts in Demand
20
Topic: Shortage
4
Topic: Standardized Good
1
Topic: Substitute Goods
2
Topic: Supply Curve
13
Topic: Surplus
4
Topic: Transactions Costs
3