
1. The cost associated with foregoing the opportunity to employ a resource in its best
alternative use is called:
A. a sunk cost.
2. Total benefits minus total cost equals:
A. gross benefit.
3. Suppose that adding a new disc drive to your computer increases its value by $100. The
disc drive costs $75 and takes you 2 hours to install. If you value your time at $6 per hour then the
net benefit of installing the disc drive is:
D. $88.
4. “If the cost of college tuition goes up, then fewer people will go to college.” This
statement:
D. ignores the opportunity costs of attending college.
5. An economic explanation as to why individuals such as Bill Gates and LeBron James don’t
finish college is that:
D. the decision not to finish college is irrational.
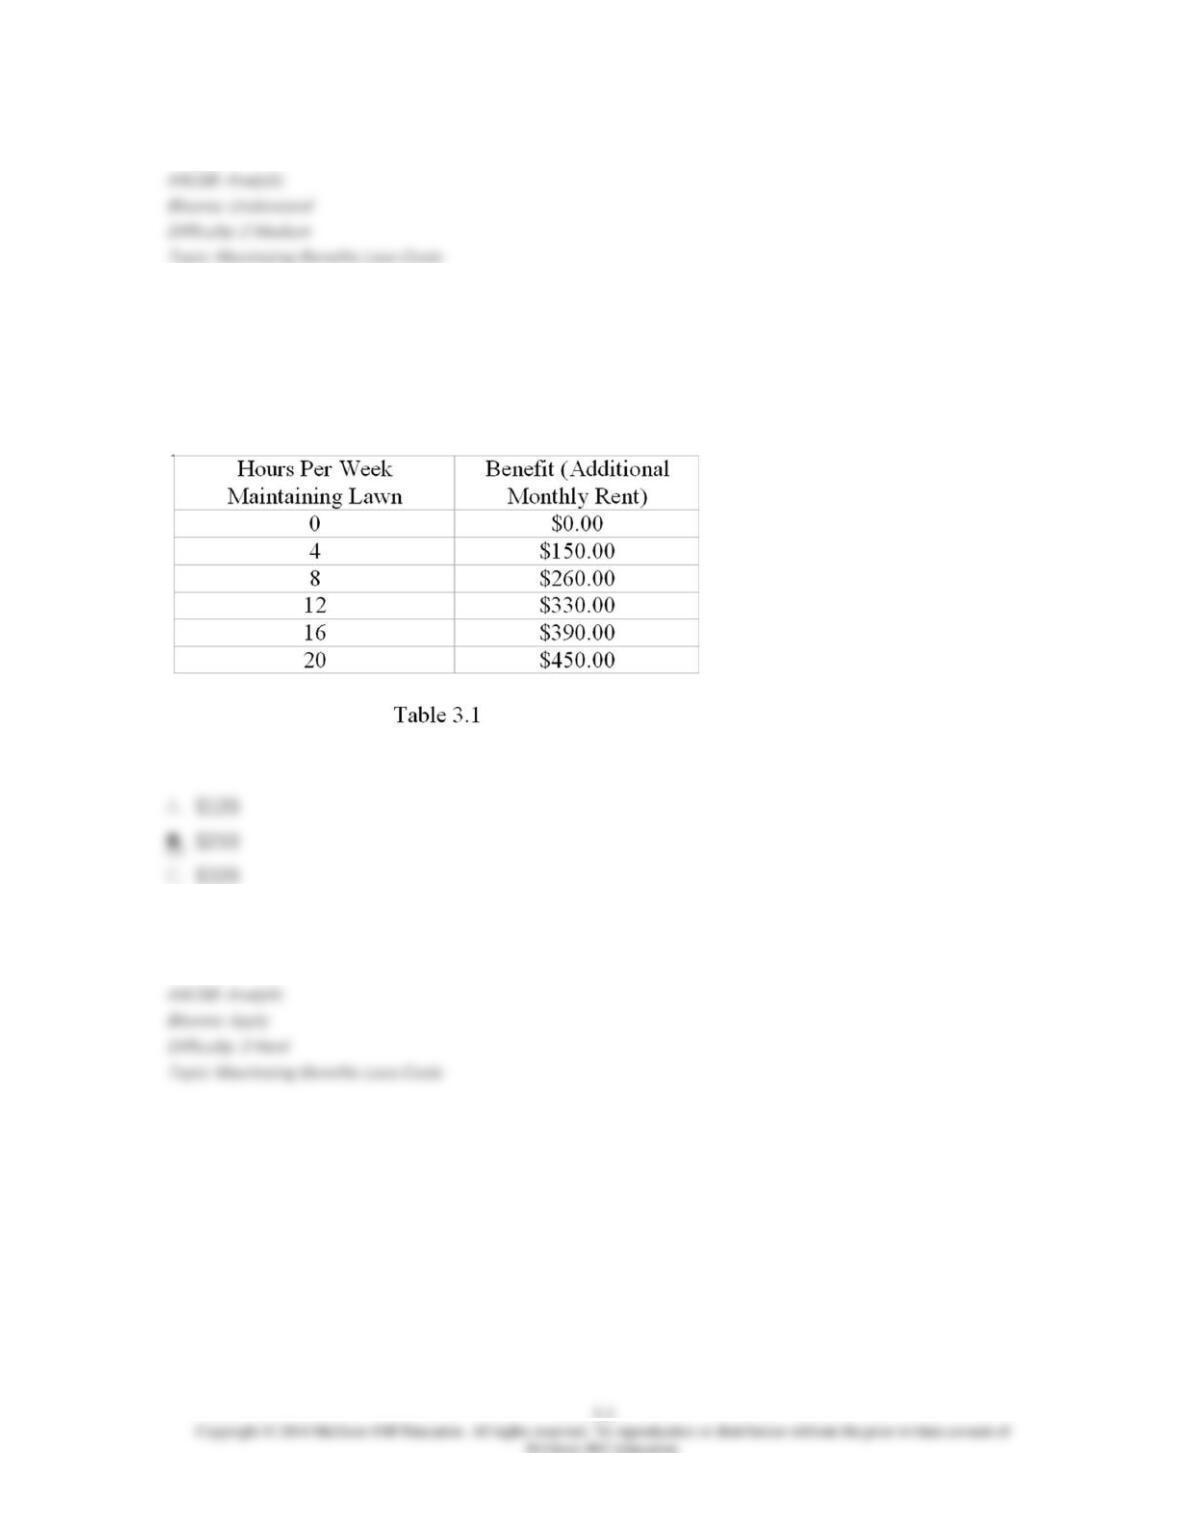
6. Refer to Table 3.1. Suppose that you have a house that you rent out. If you keep the lawn
maintained, you can charge a higher monthly rent for the house. Suppose your hourly wage from
your job at the mall is $10, what is the net benefit of spending 12 hours per week maintaining the
lawn of the house?
D. $330
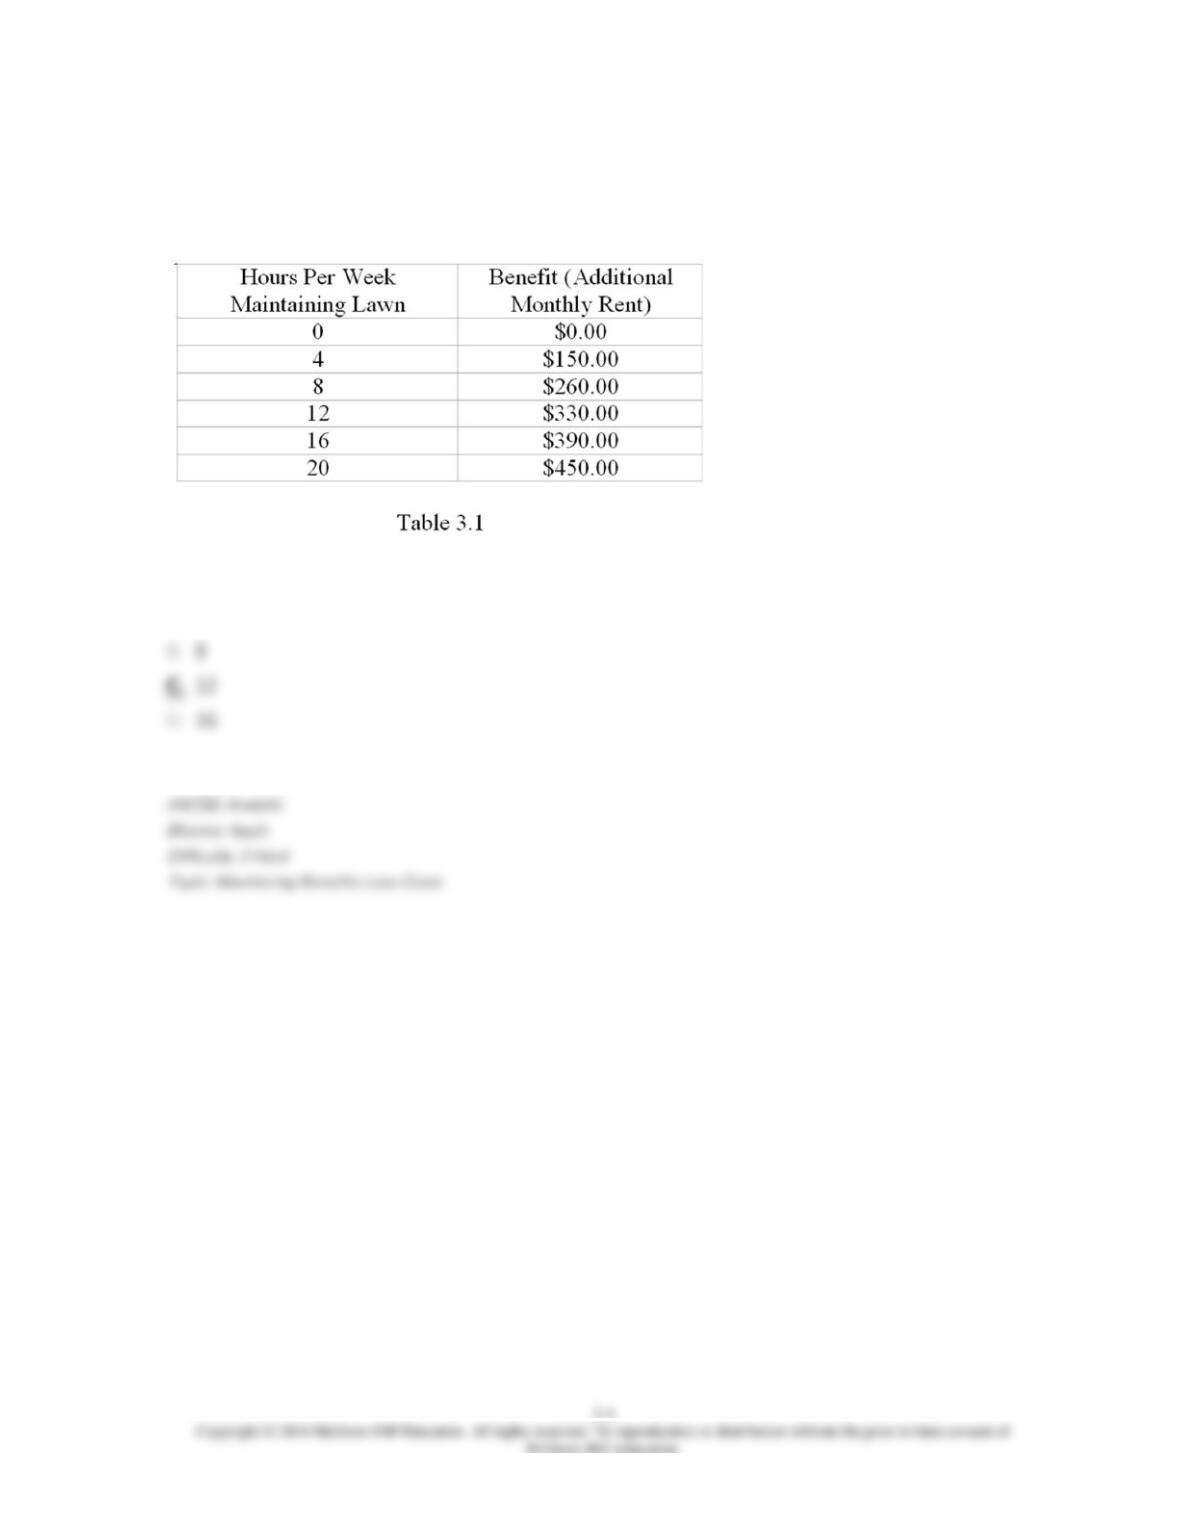
7. Refer to Table 3.1. Suppose that you have a house that you rent out. If you keep the lawn
maintained, you can charge a higher monthly rent for the house. Suppose your hourly wage from
your job at a law firm is $25, how many hours per week should you spend maintaining the lawn?
A. 4
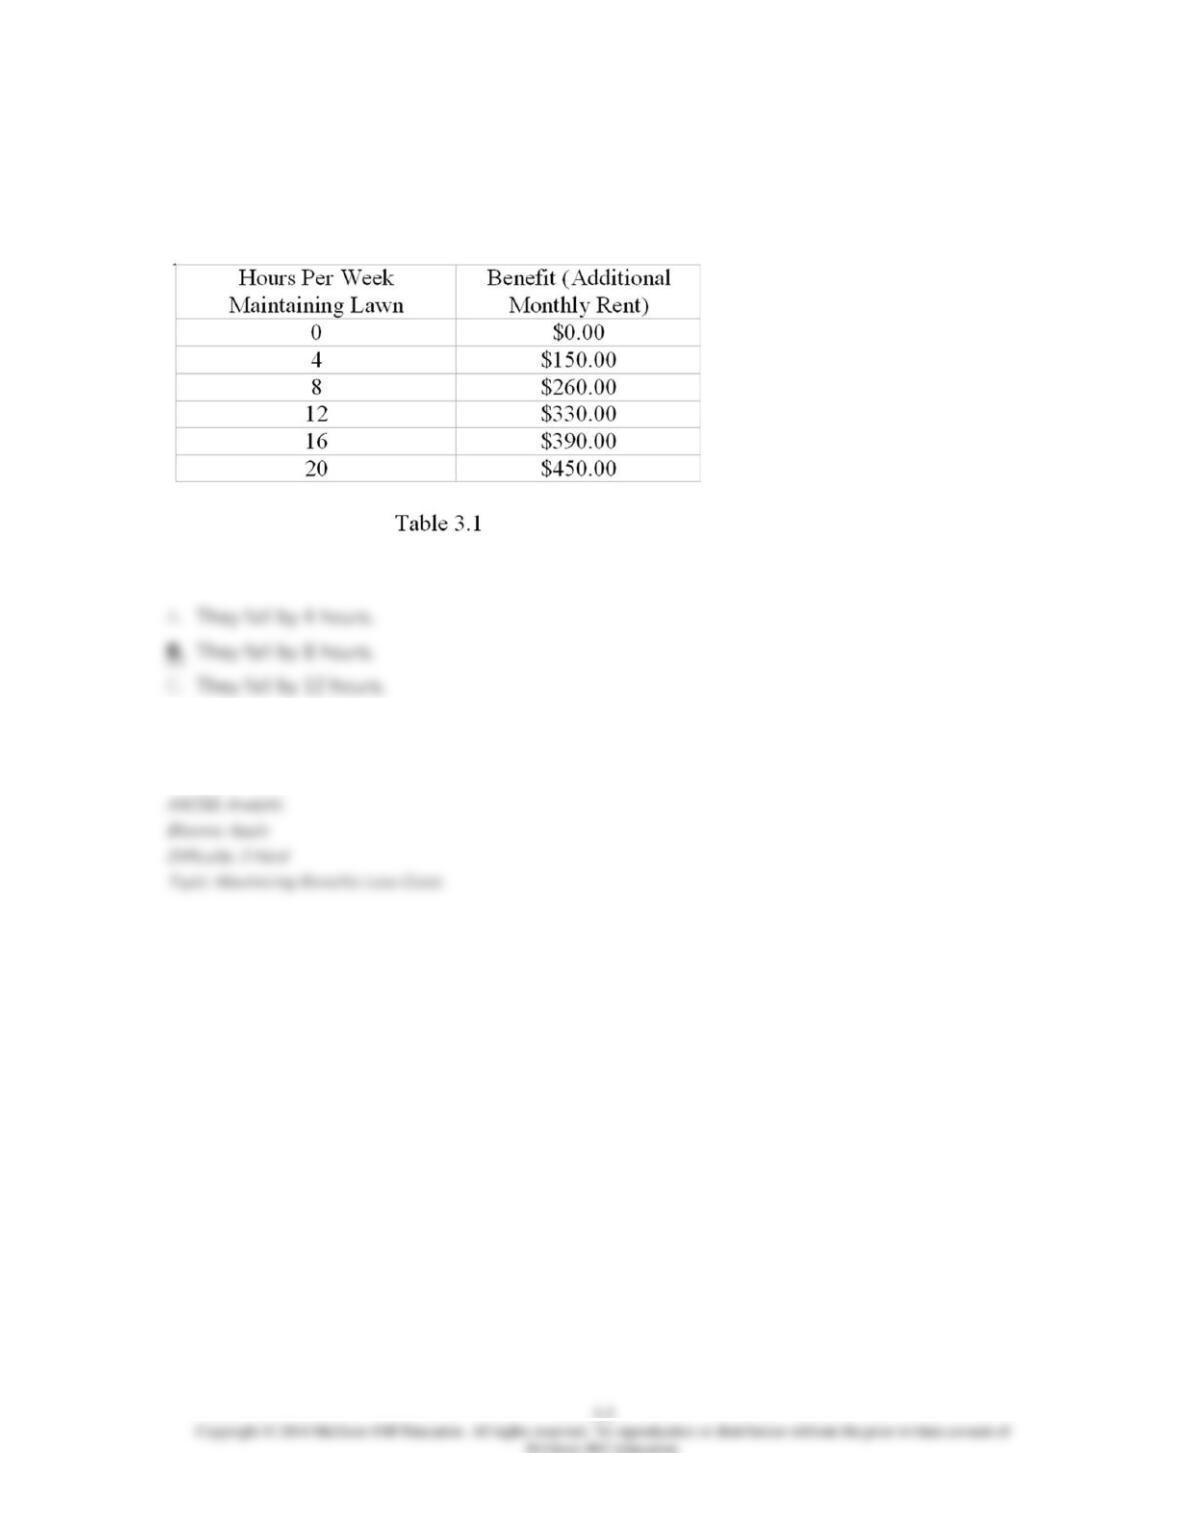
8. Refer to Table 3.1. Suppose that you have a house that you rent out. If you keep the lawn
maintained, you can charge a higher monthly rent for the house. If your hourly wage rises from
$25 to $35, what happens to the number of hours per week you spend maintaining the lawn?
D. They don’t change.
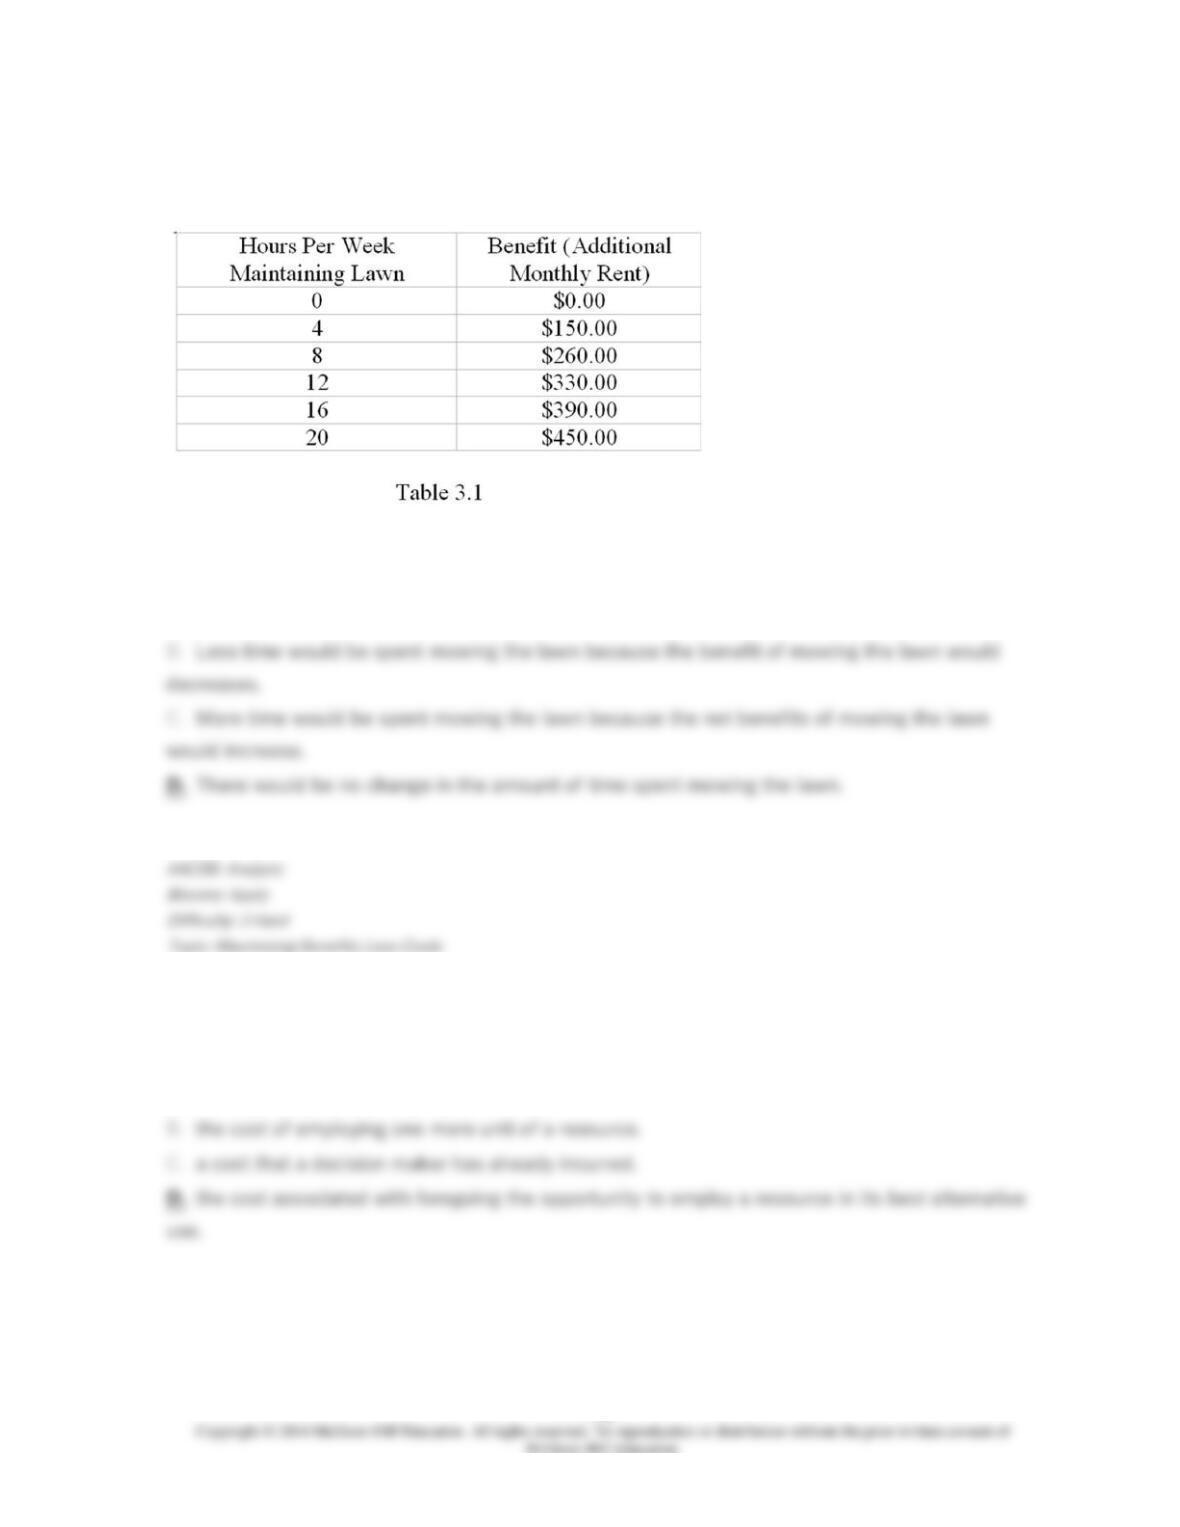
9. Refer to Table 3.1. Suppose there is a monthly tax of $100 on the house that you rent.
How does this affect the number of hours you spend mowing the lawn?
A. Less time would be spent mowing the lawn because the cost of mowing the lawn would
increase.
10. Opportunity cost refers to:
A. the amount of dollars that have to be spent in order to employ a resource.
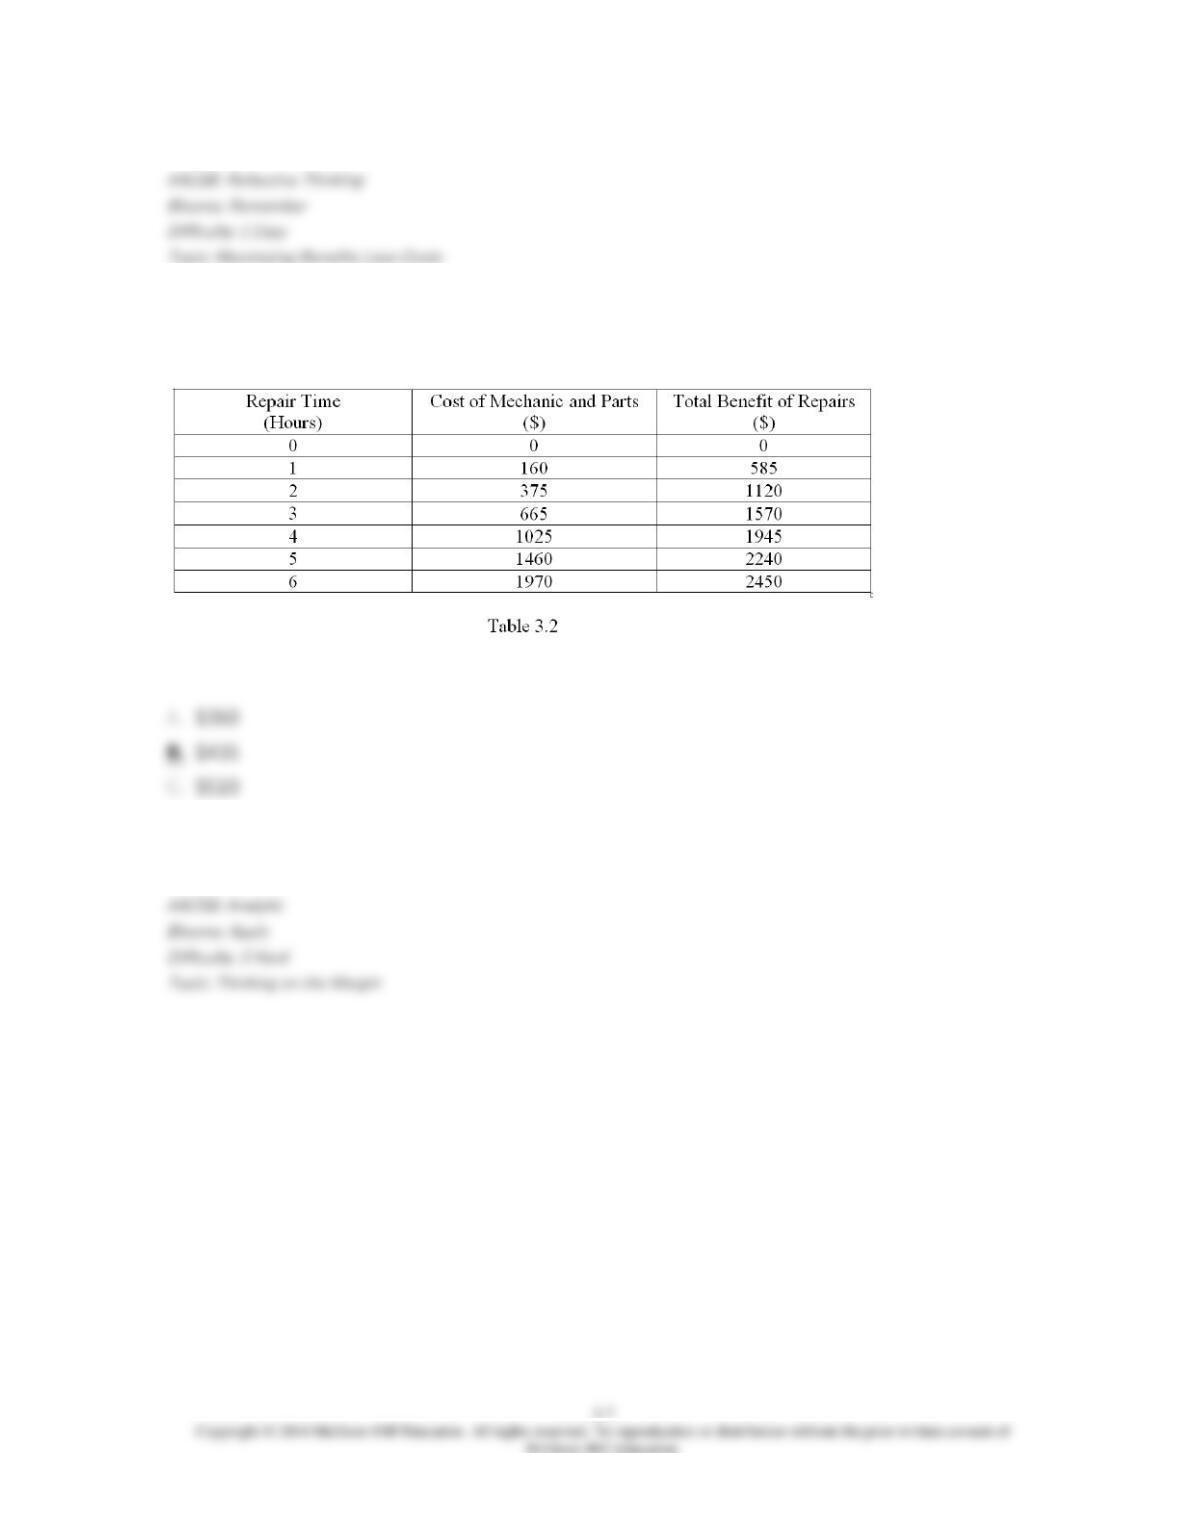
11. Refer to Table 3.2, which shows some costs and benefits of having your car repaired.
What is the marginal cost of the 5th hour spent on repairs?
D. $780
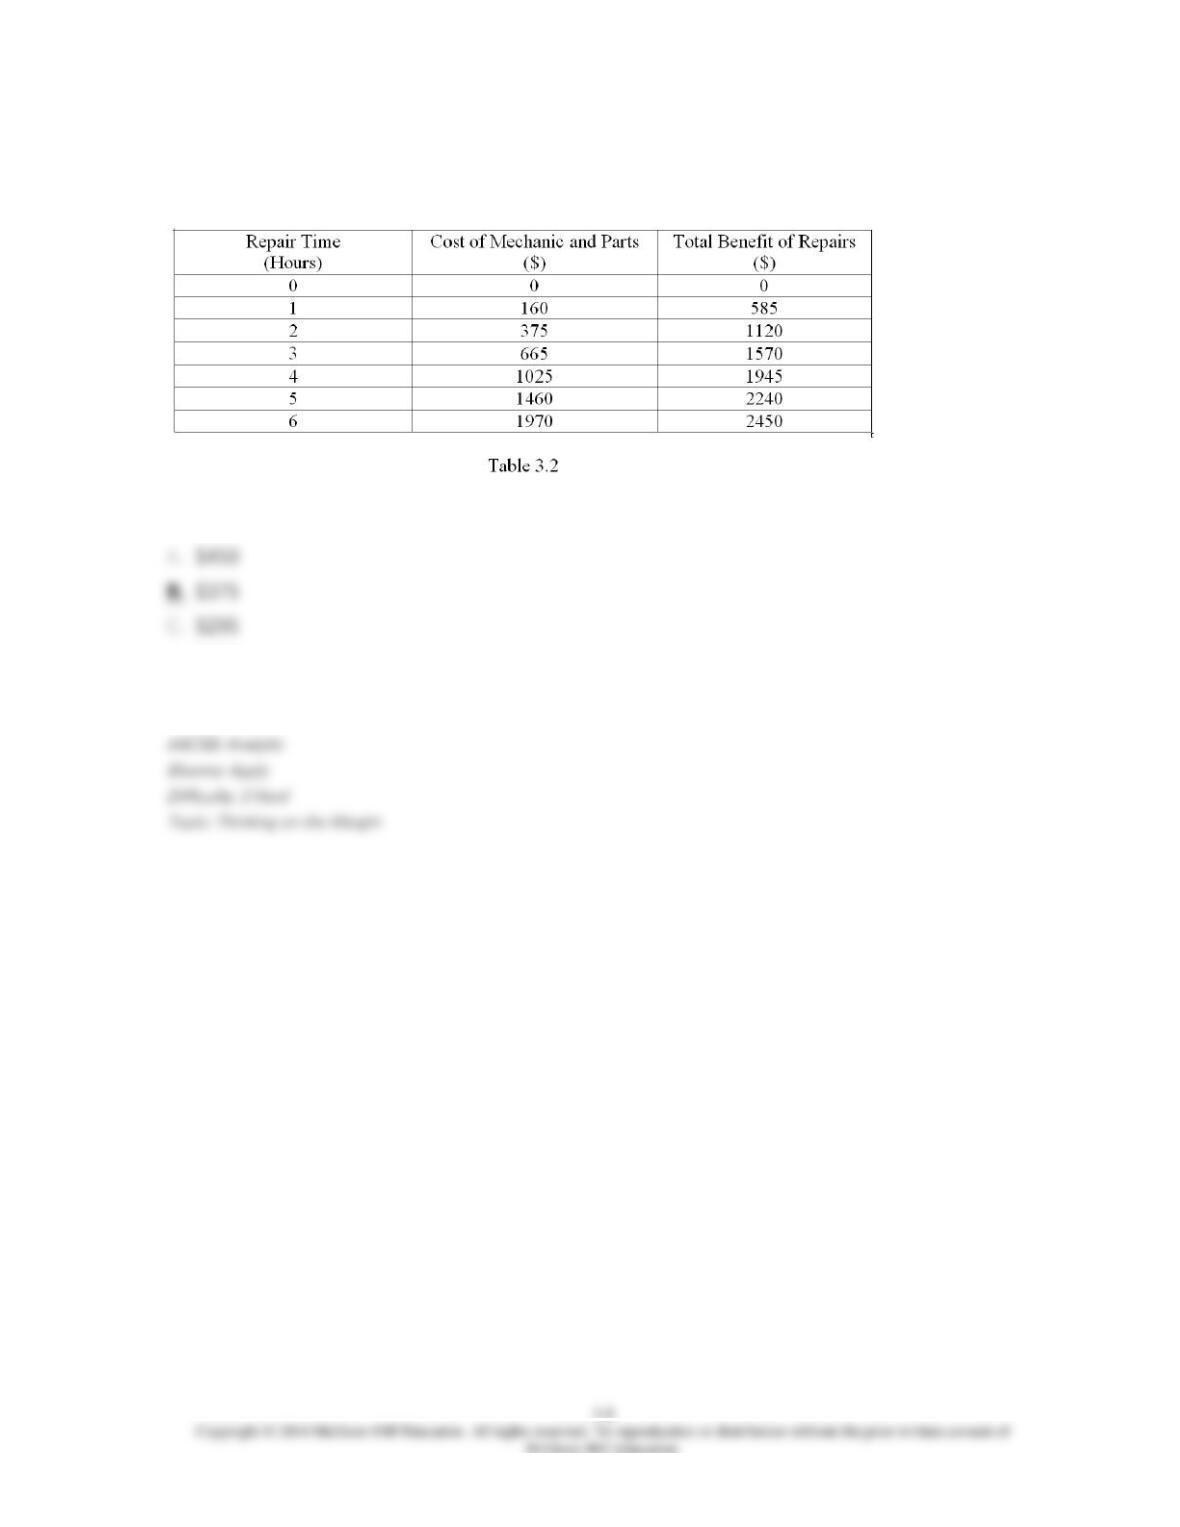
12. Refer to Table 3.2, which shows some costs and benefits of having your car repaired.
What is the marginal benefit of the 4th hour spent on repairs?
D. $920
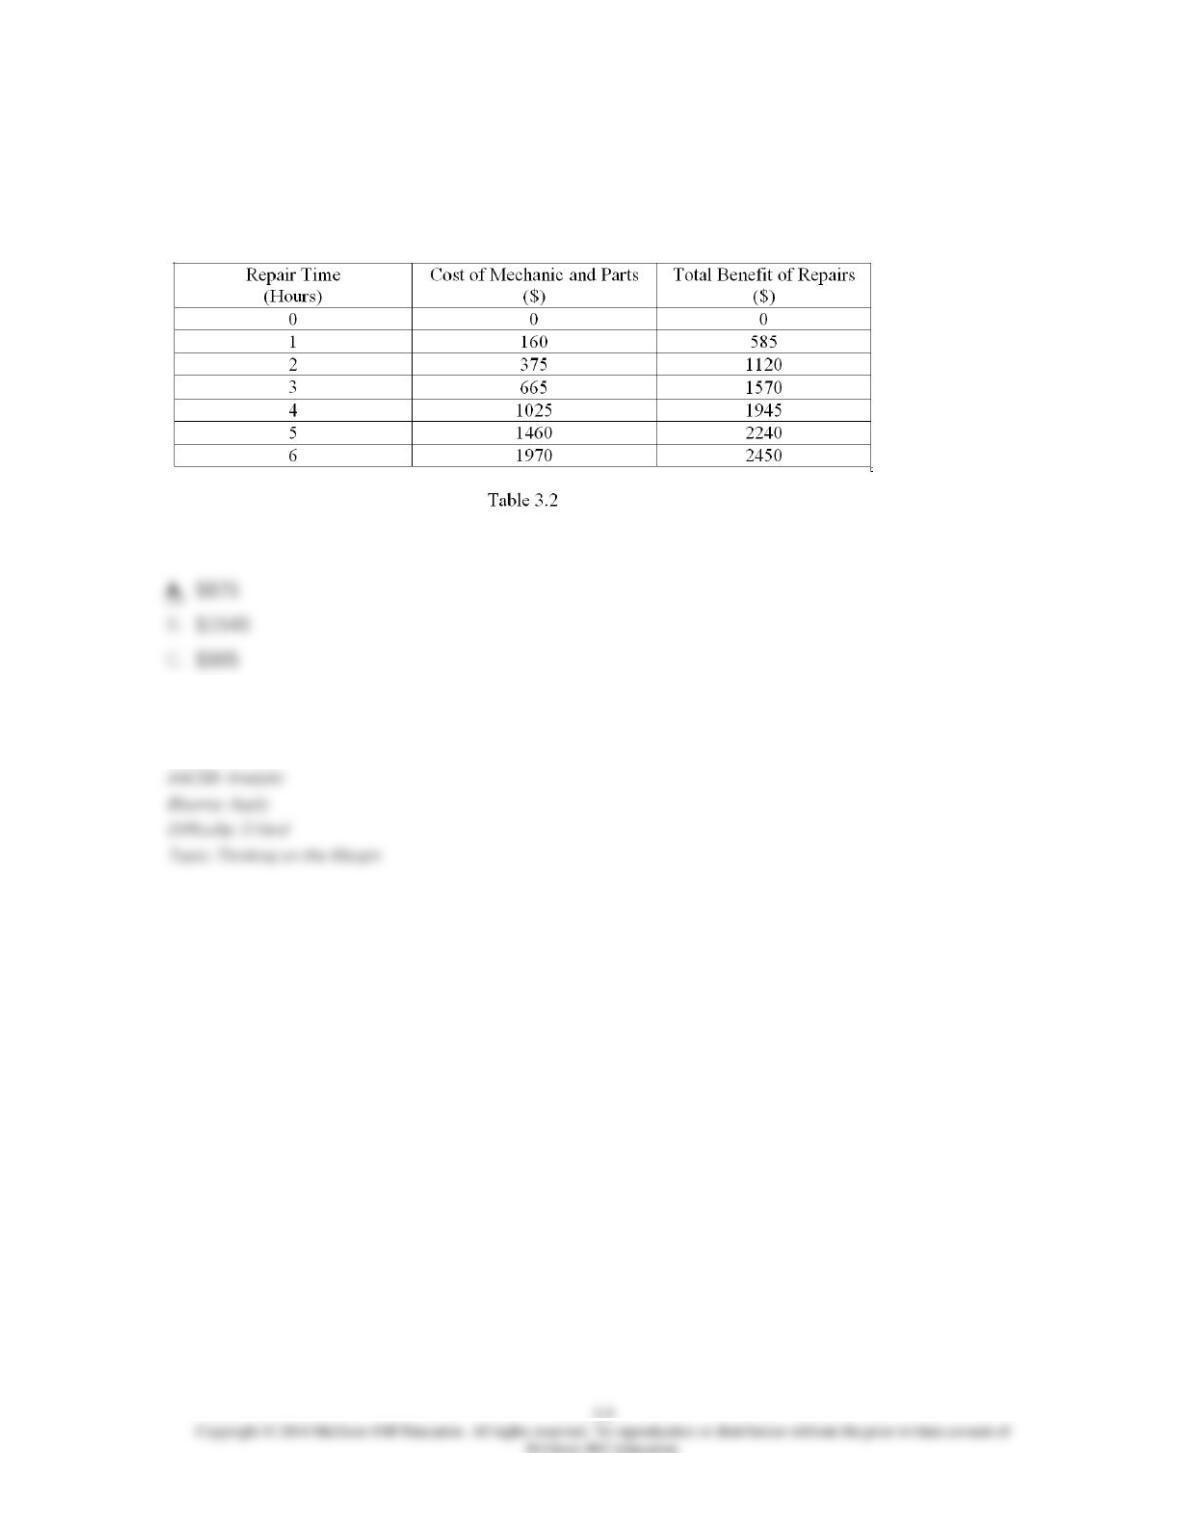
13. Refer to Table 3.2, which shows some costs and benefits of having your car repaired.
Suppose you use your car to deliver pizzas. If you earn $10 per hour delivering pizzas, what is the
net benefit of 3 hours of car repairs?
D. There is not enough information to determine the net benefits.
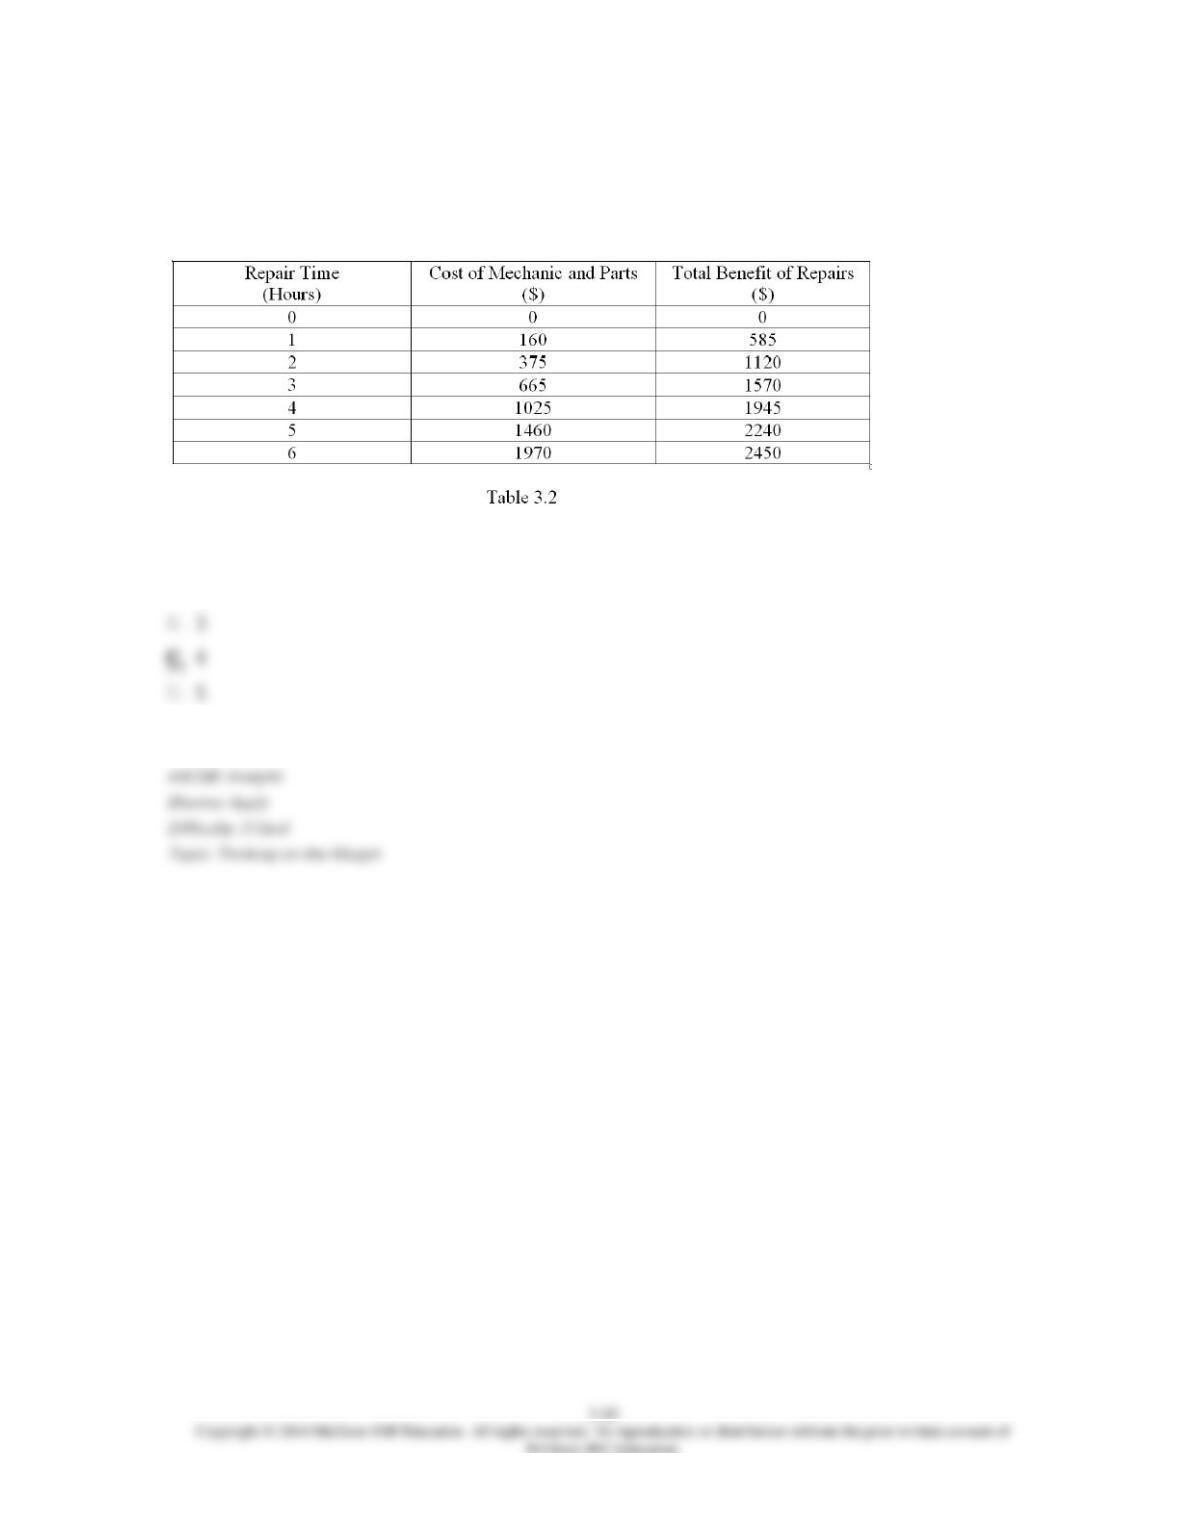
14. Refer to Table 3.2, which shows some costs and benefits of having your car repaired.
Suppose you use your car to deliver pizzas. If you earn $10 per hour delivering pizzas, what is your
best choice of hours to spend on car repairs?
A. 2
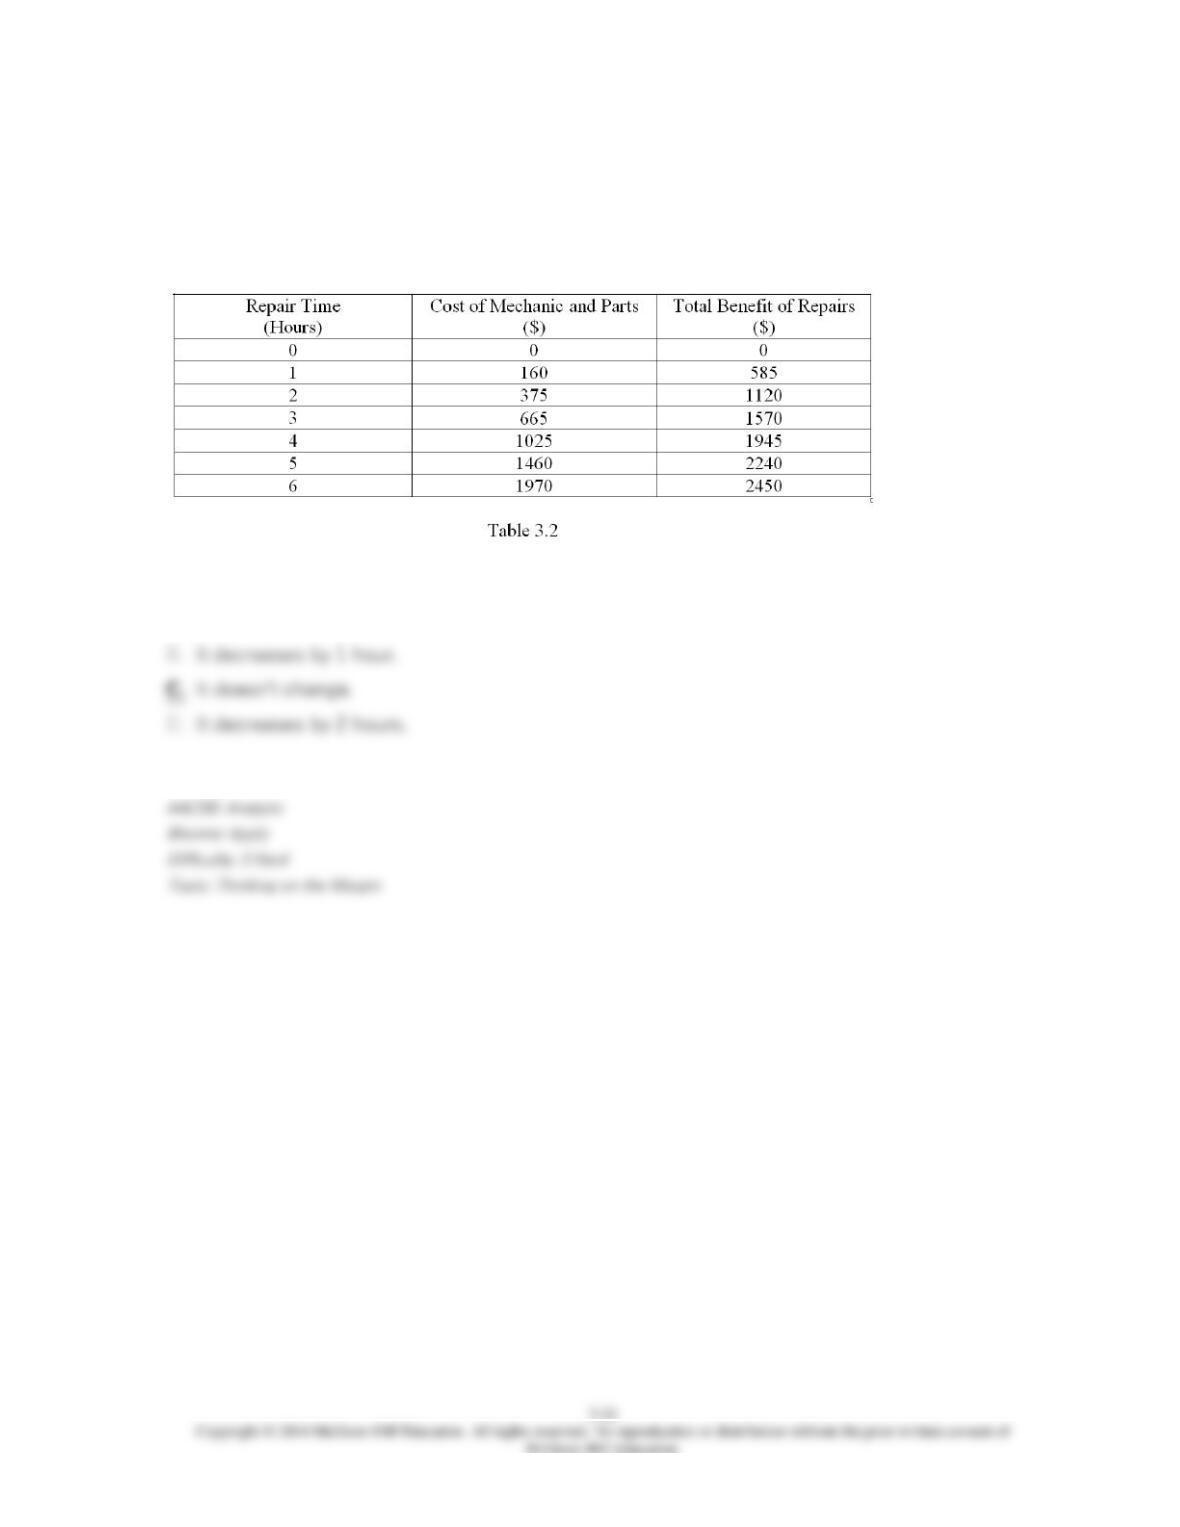
15. Refer to Table 3.2, which shows some costs and benefits of having your car repaired.
Suppose you use your car to deliver pizzas, for which you earn $10 per hour. If your mechanic
lowers the amount she charges by $50, what happens to your best choice of hours to spend on car
repairs?
A. It increases by 1 hour.
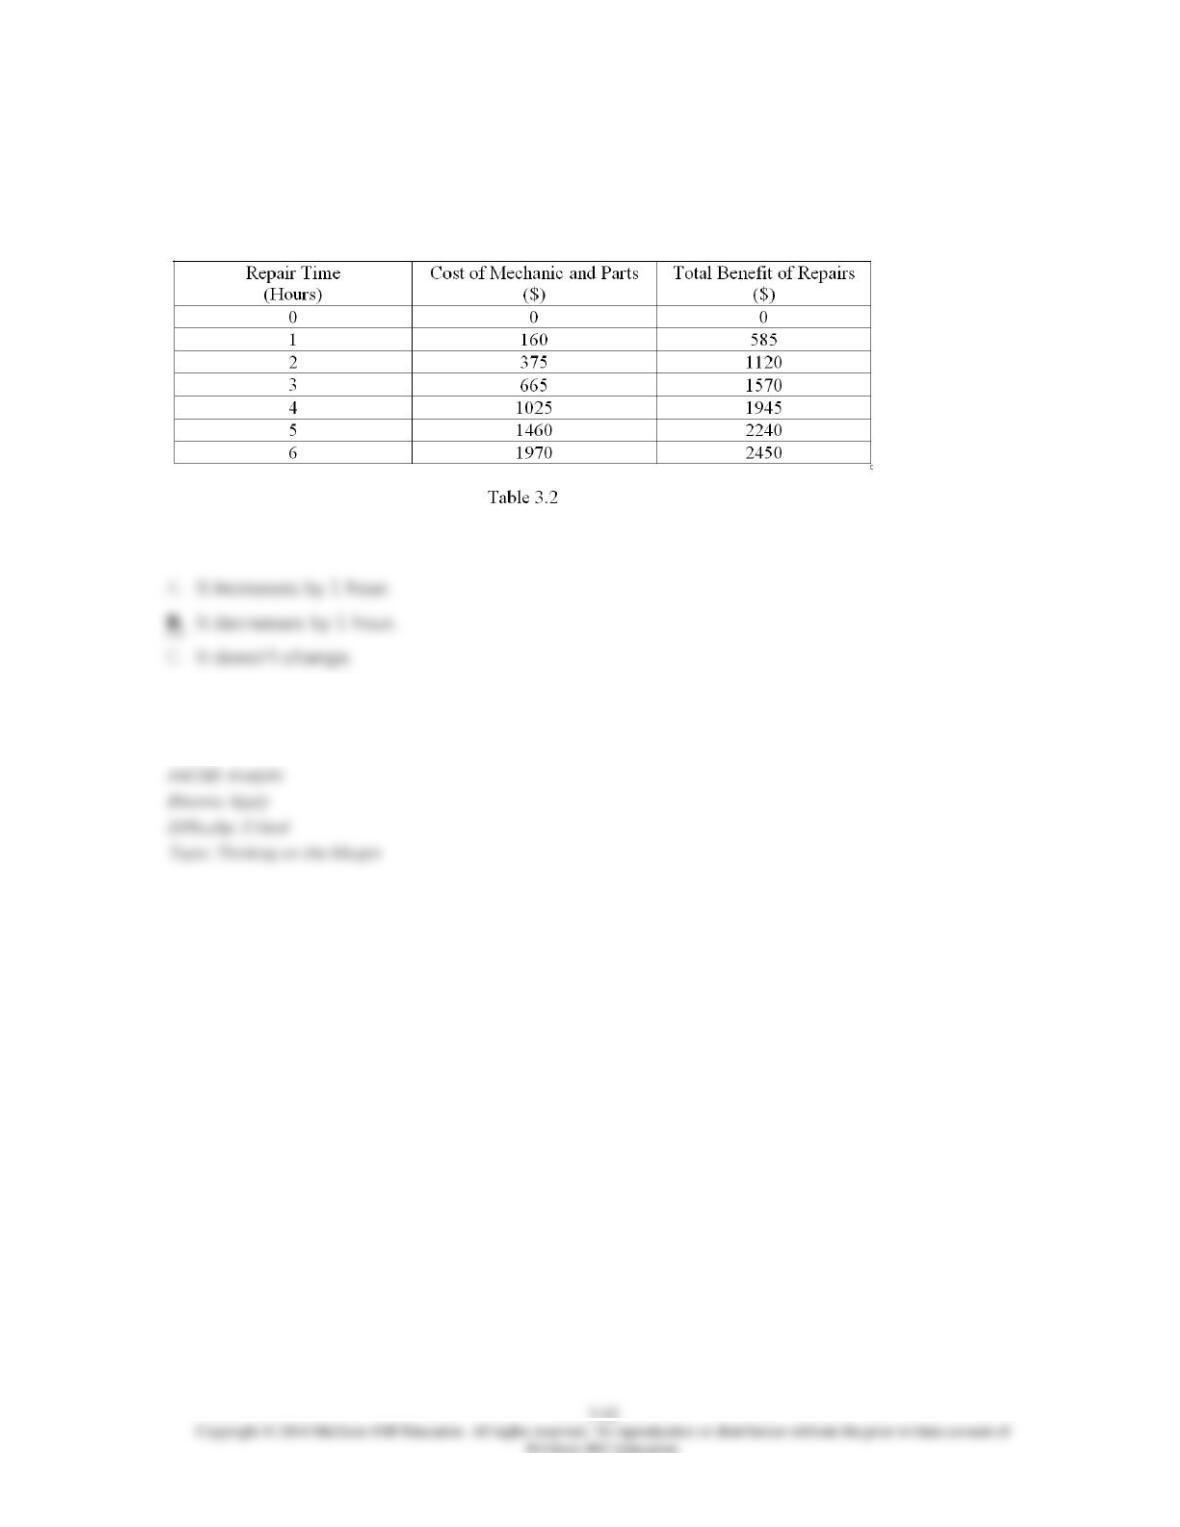
16. Refer to Table 3.2, which shows some costs and benefits of having your car repaired.
Suppose you use your car to deliver pizzas. If your wage increases from $10 to $20 per hour, what
happens to your best choice of hours to spend on car repairs?
D. It decreases by 2 hours.
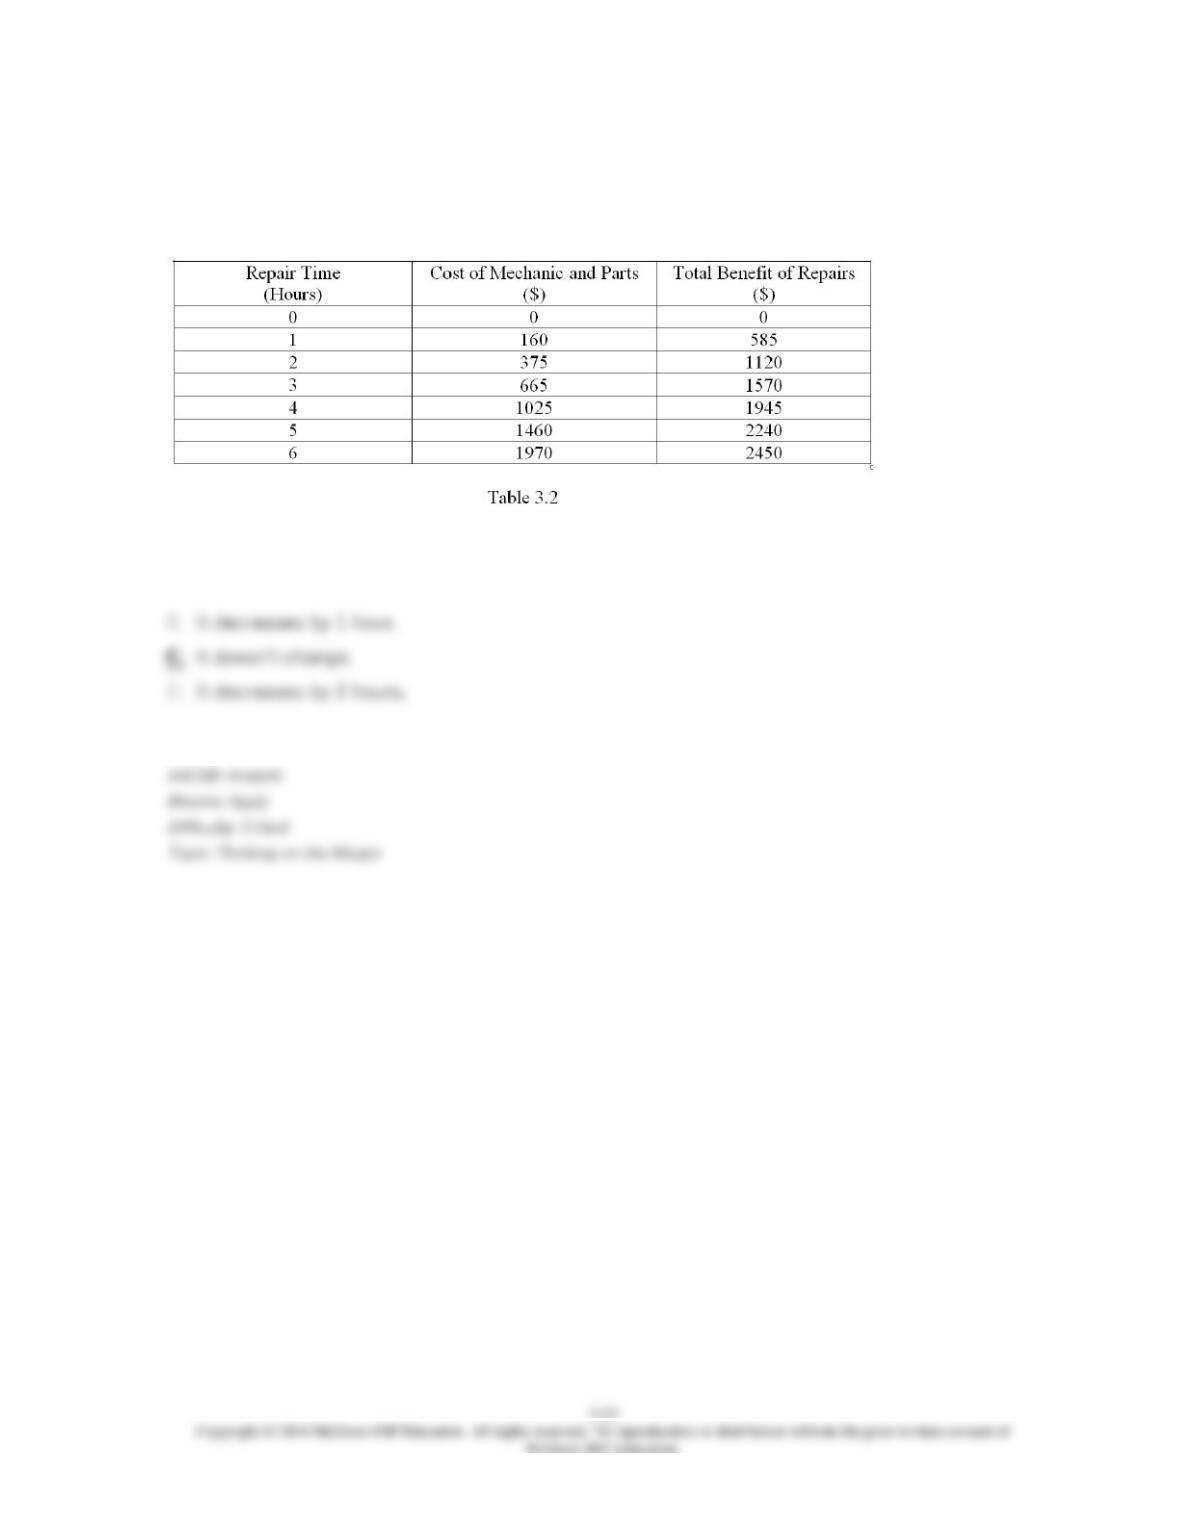
17. Refer to Table 3.2, which shows some costs and benefits of having your car repaired.
Suppose your mechanic charges a non-refundable fee of $100 just for scheduling an appointment.
What happens to the best choice of hours to spend on car repairs?
A. It increases by 1 hour.
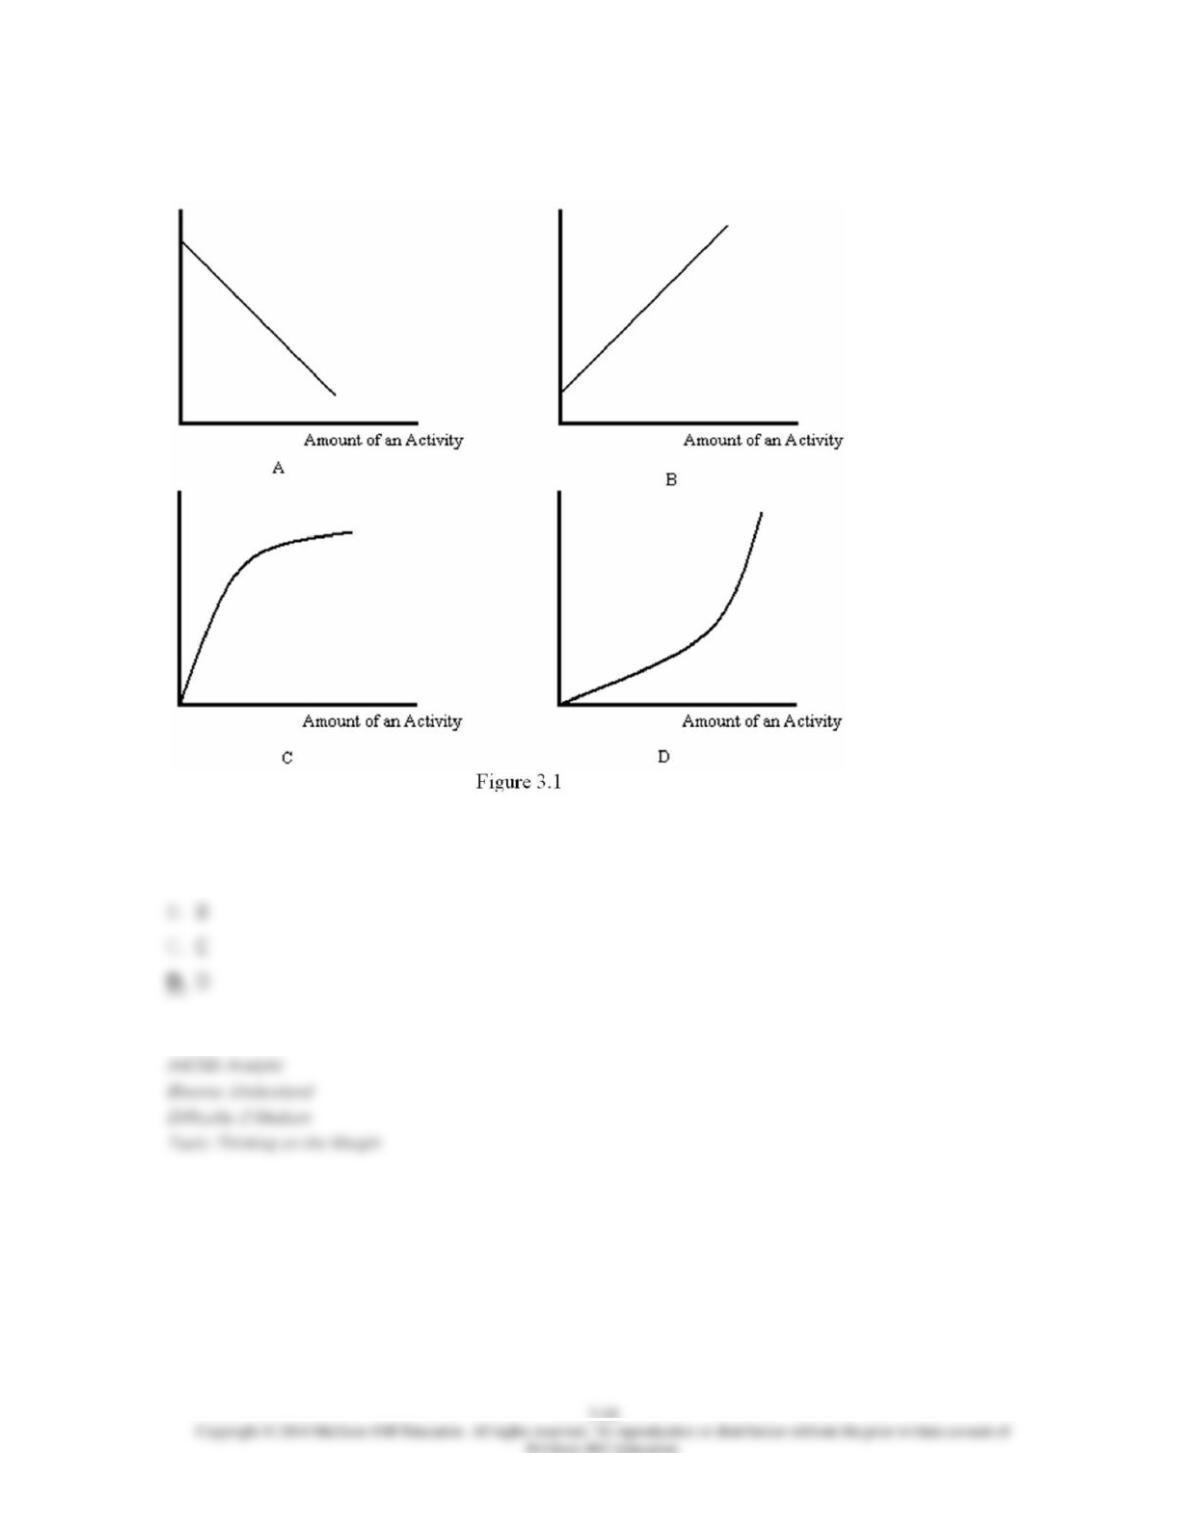
18. Refer to Figure 3.1. Which graph best represents the total cost of an activity?
A. A
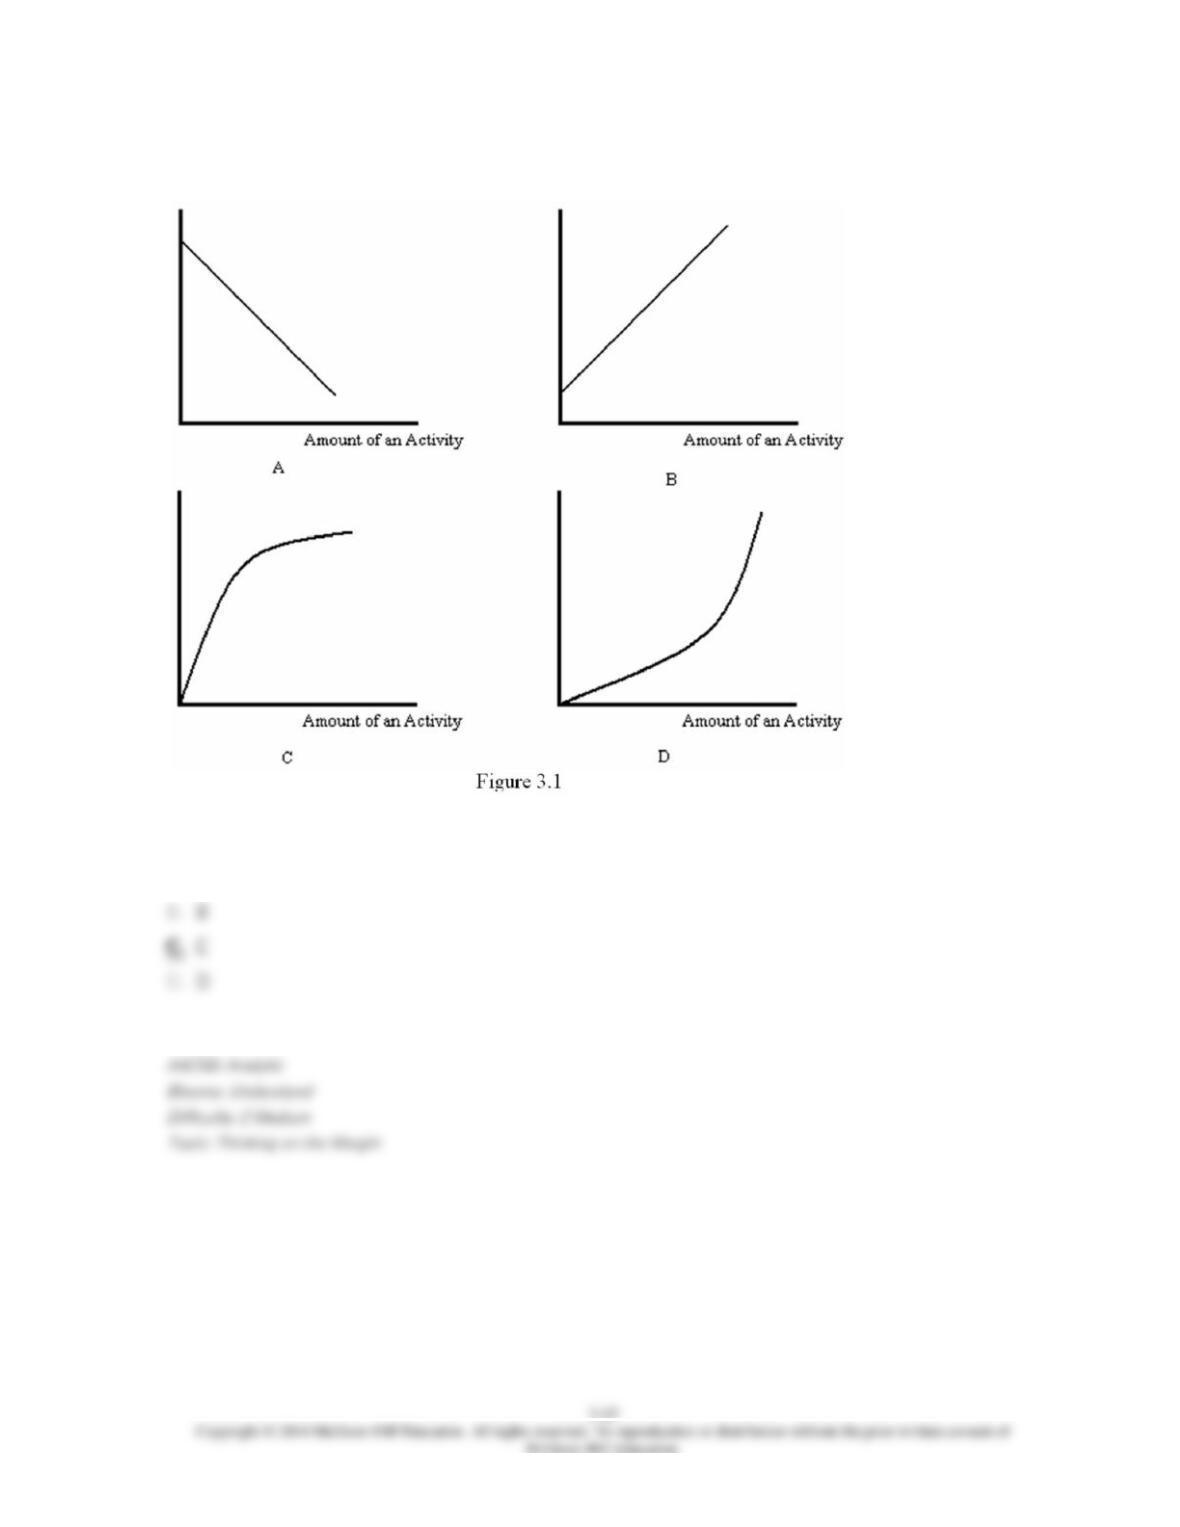
19. Refer to Figure 3.1. Which graph best represents the total benefit of an activity?
A. A
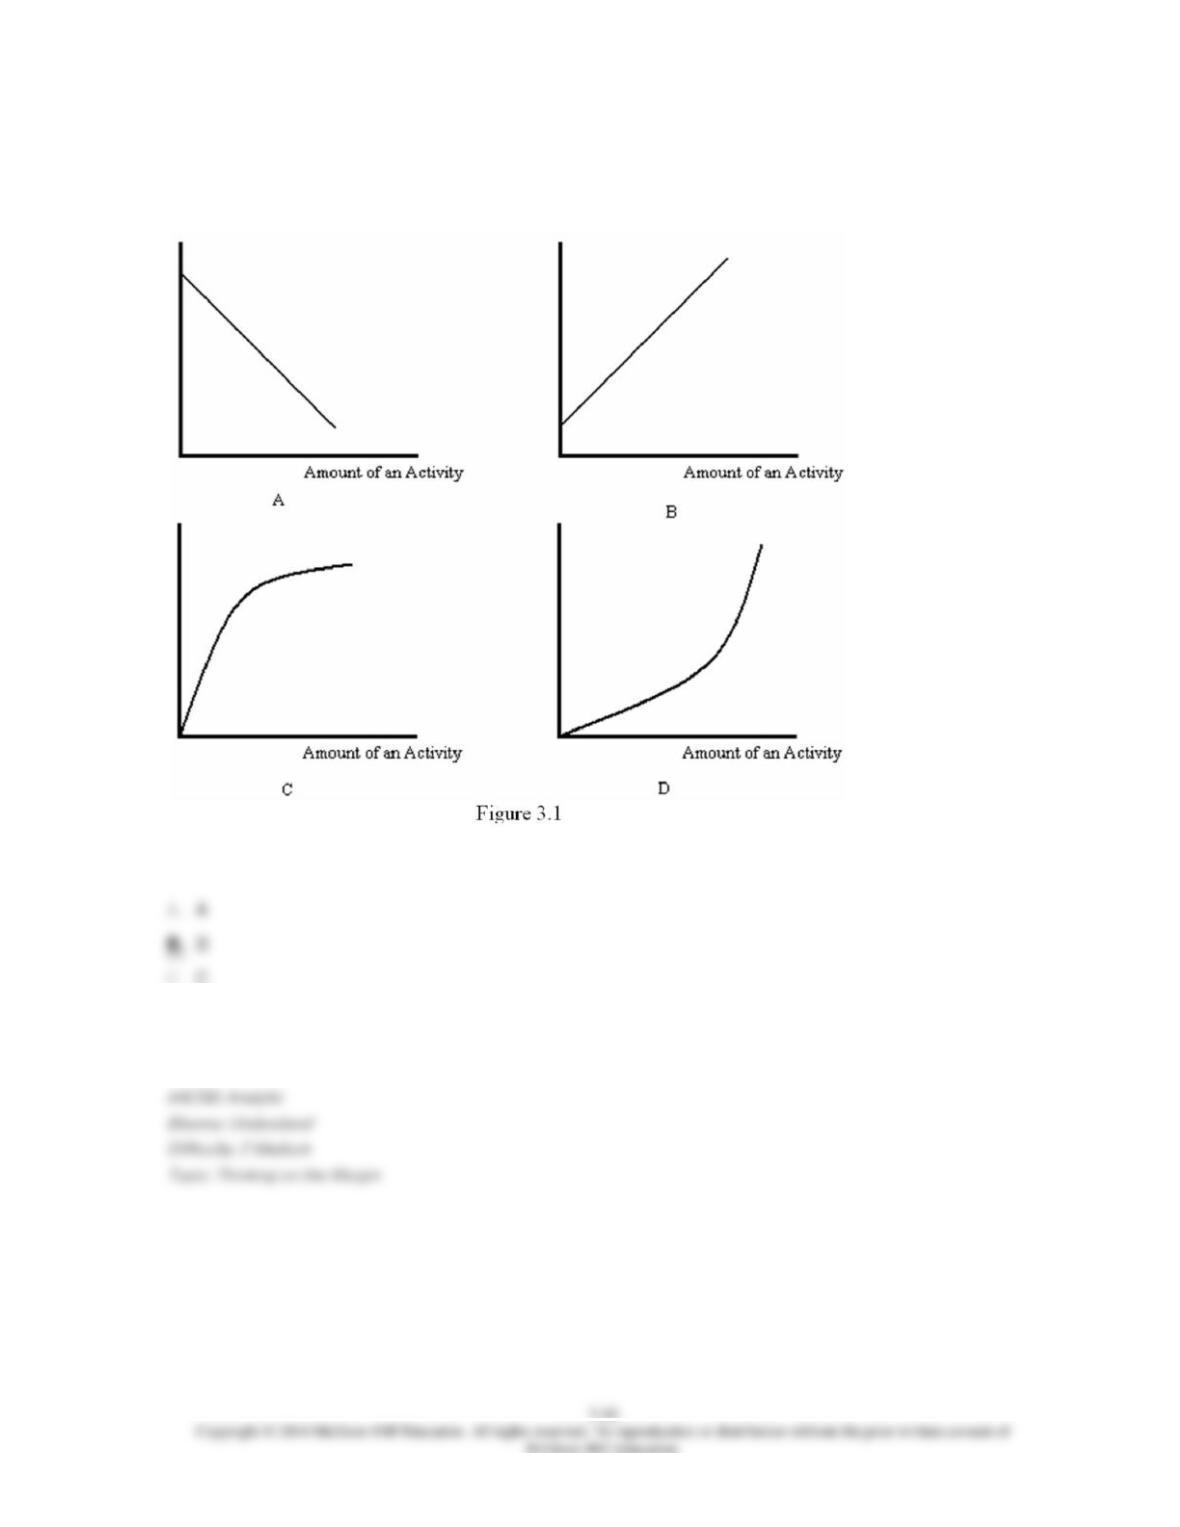
20. Refer to Figure 3.1. If one of the graphs represents the total cost of an activity, which
other graph best represents the marginal cost of the activity?
C. C
D. D
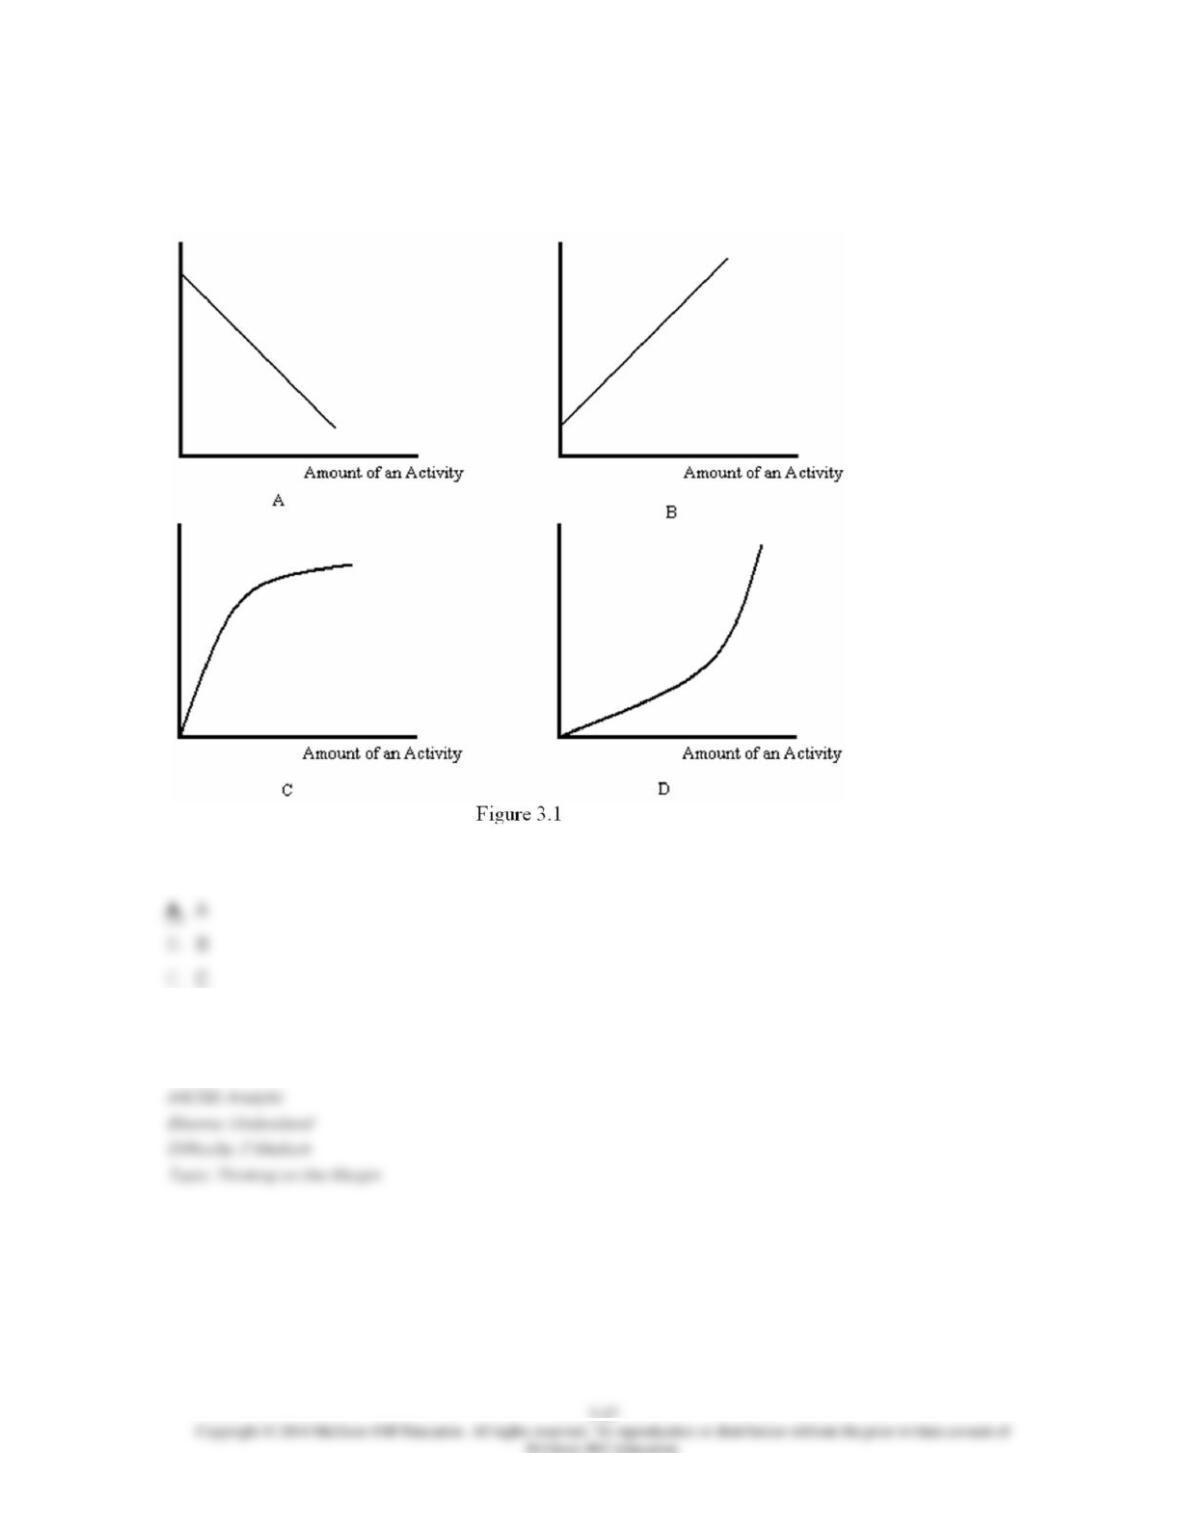
21. Refer to Figure 3.1. If one of the graphs represents the total benefit of an activity, which
other graph best represents the marginal benefit of the activity?
D. D
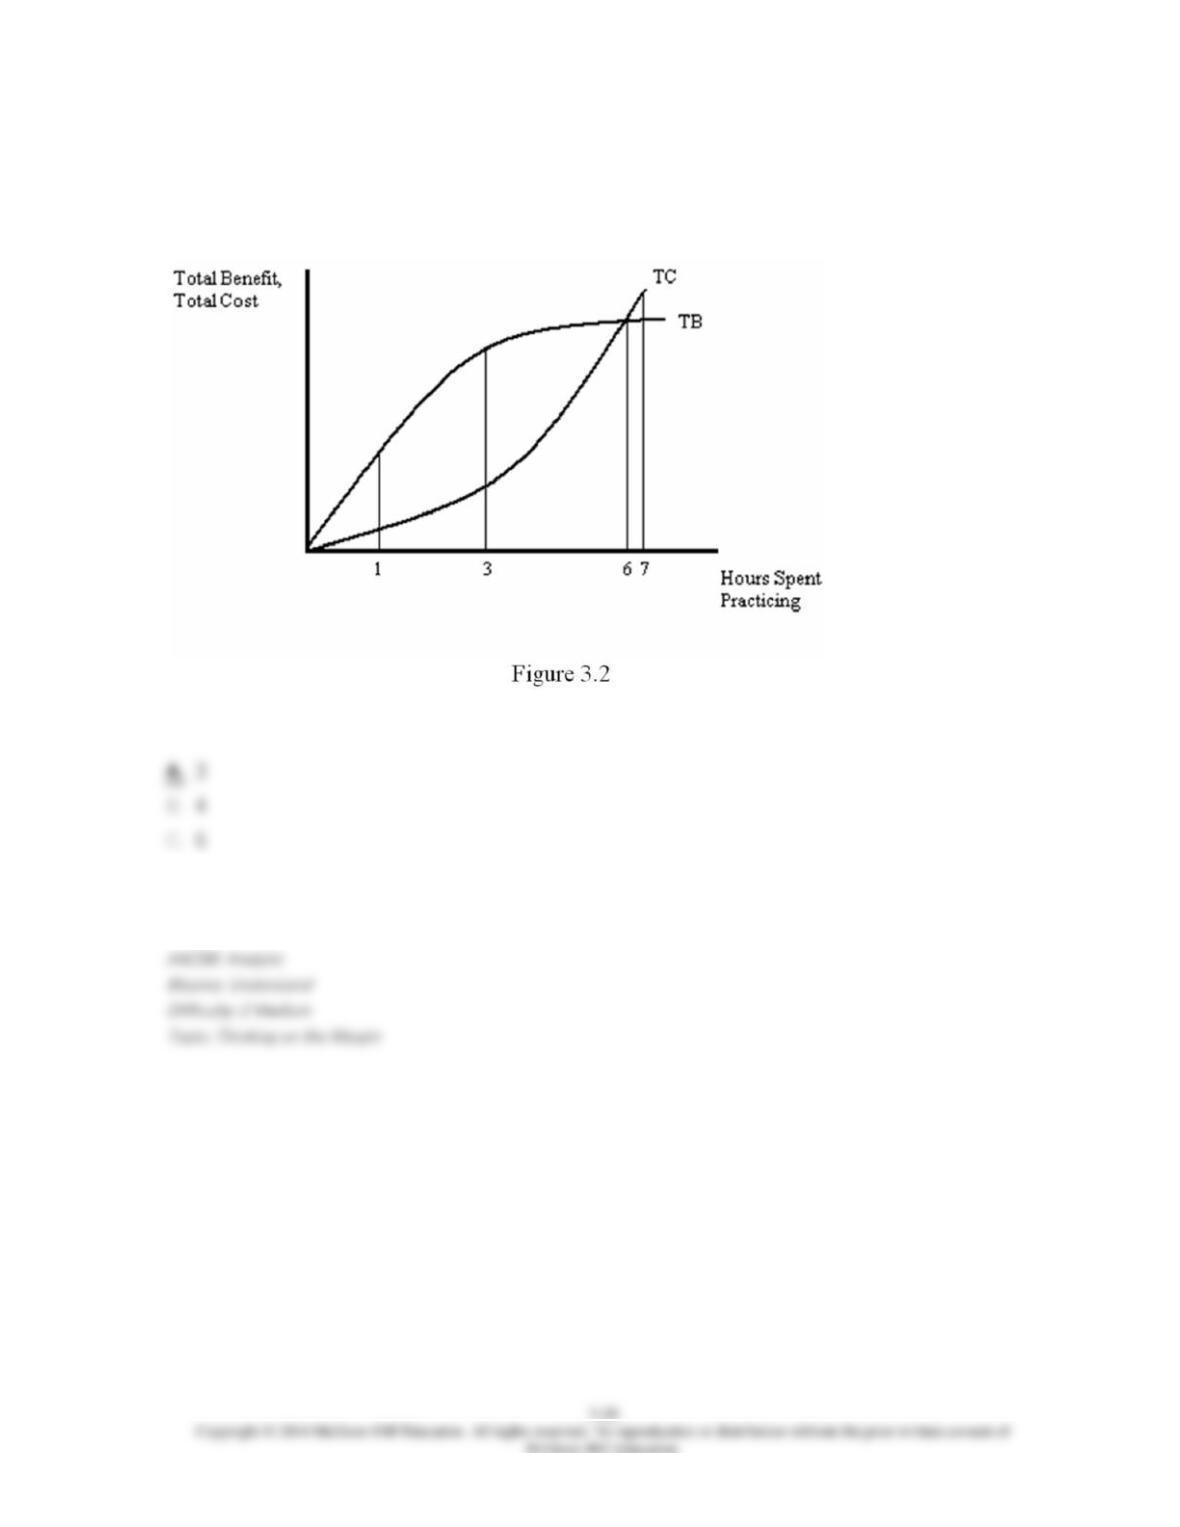
22. Figure 3.2 shows the total cost and total benefit curves for a professional guitarist.
According to the graph, which of the following is the best number of hours the guitarist should
spend practicing each day?
D. 7
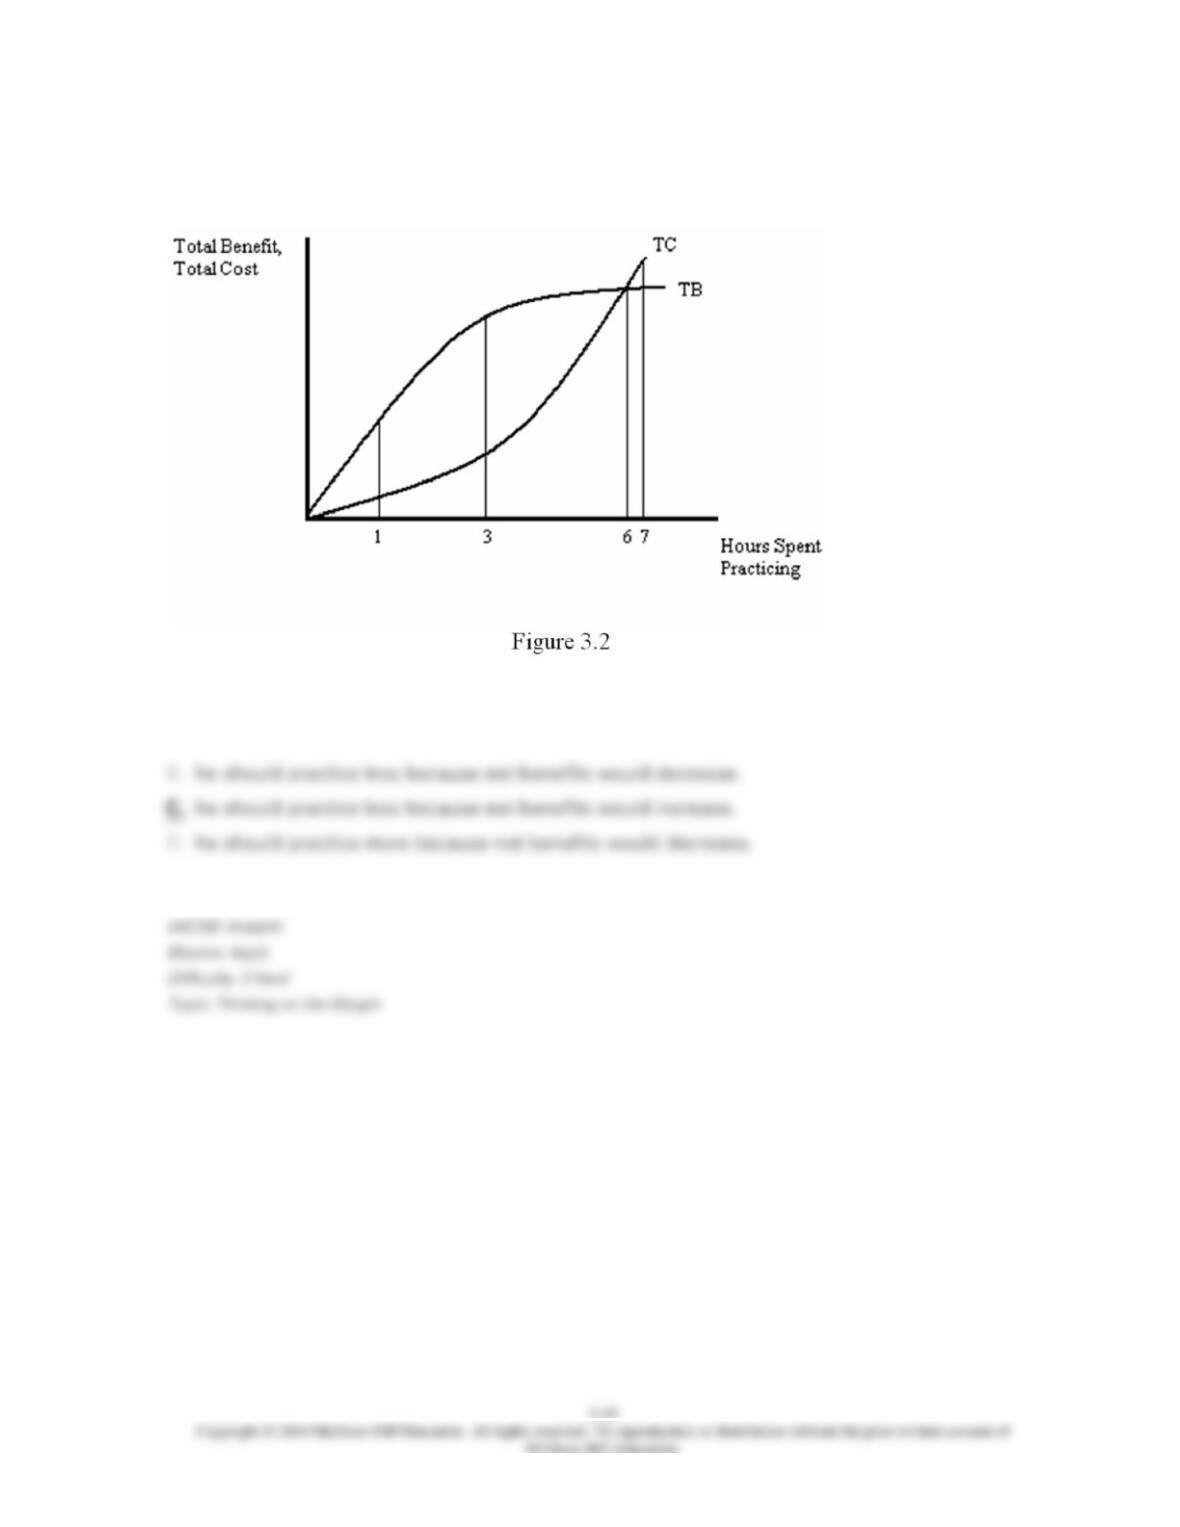
23. Figure 3.2 shows the total cost and total benefit curves for a professional guitarist. If the
guitarist is currently practicing 7 hours per day, then:
A. he should practice more because net benefits would increase.
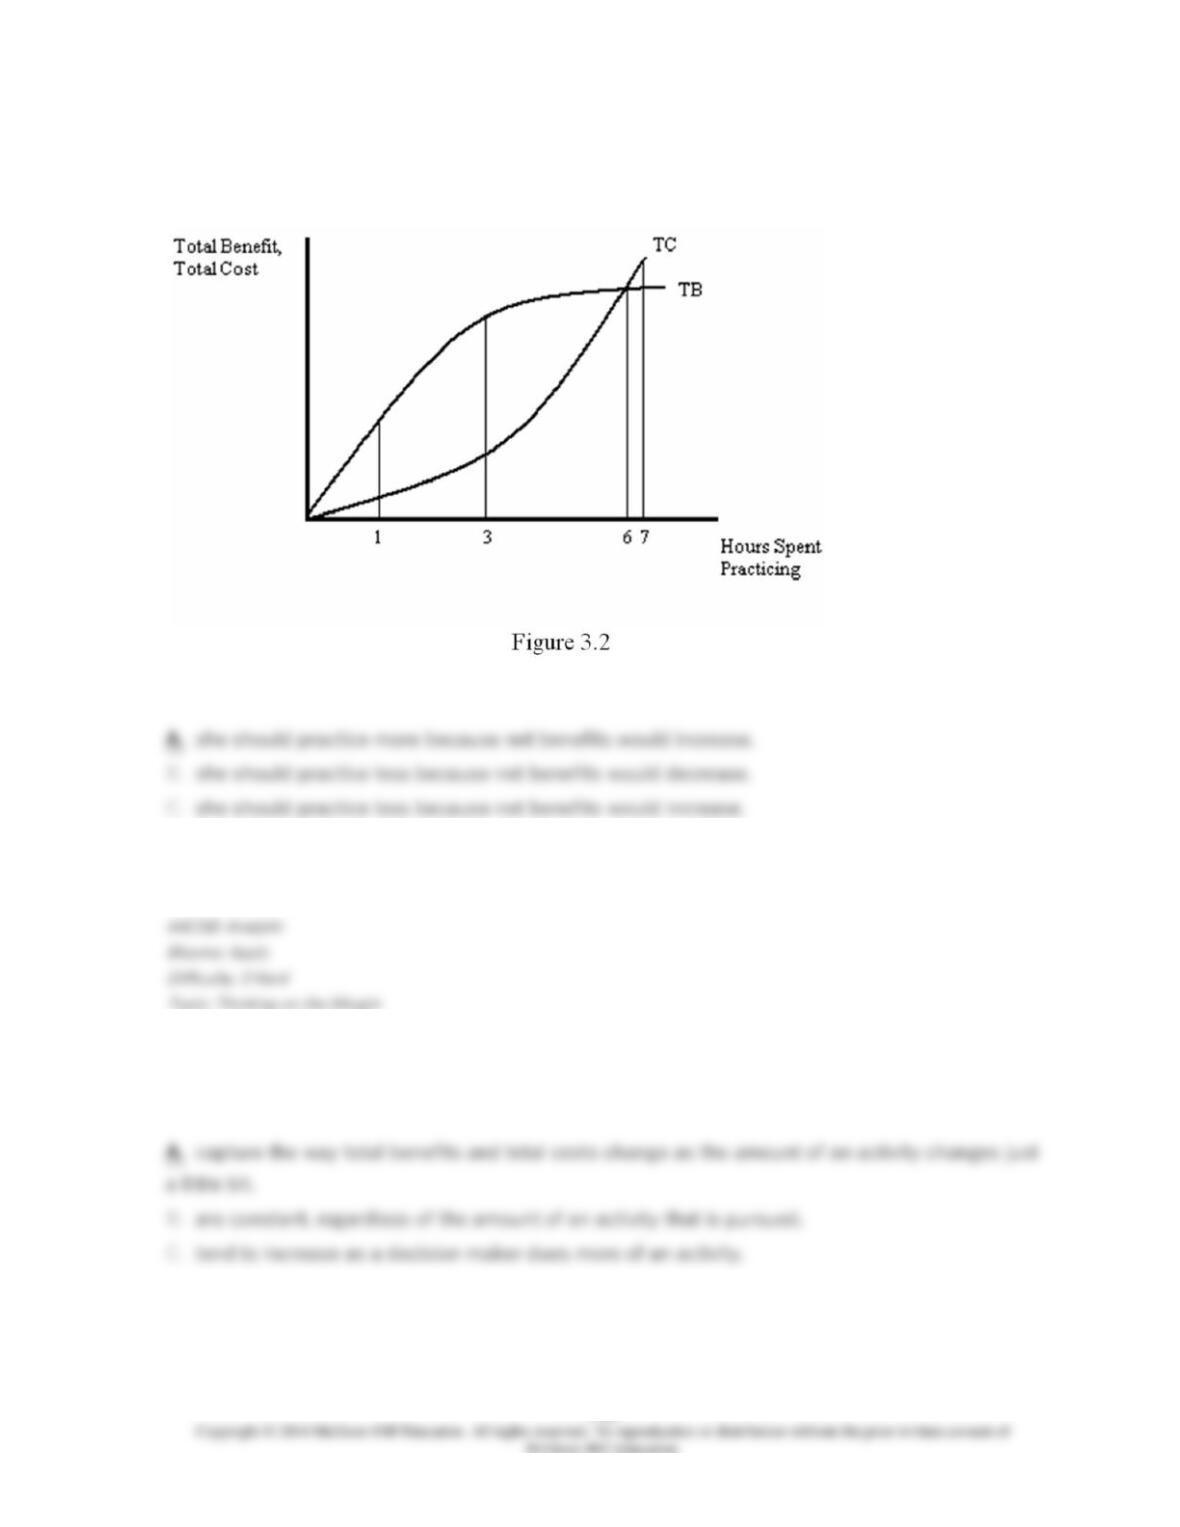
24. Figure 3.2 shows the total cost and total benefit curves for a professional guitarist. If the
guitarist is currently practicing 1 hour per day, then:
D. she should practice more because net benefits would decrease.
25. Marginal benefits and marginal costs:
D. tend to decrease as a decision maker does less of an activity.