CHAPTER 27
Simple Analytics of Supply and Demand
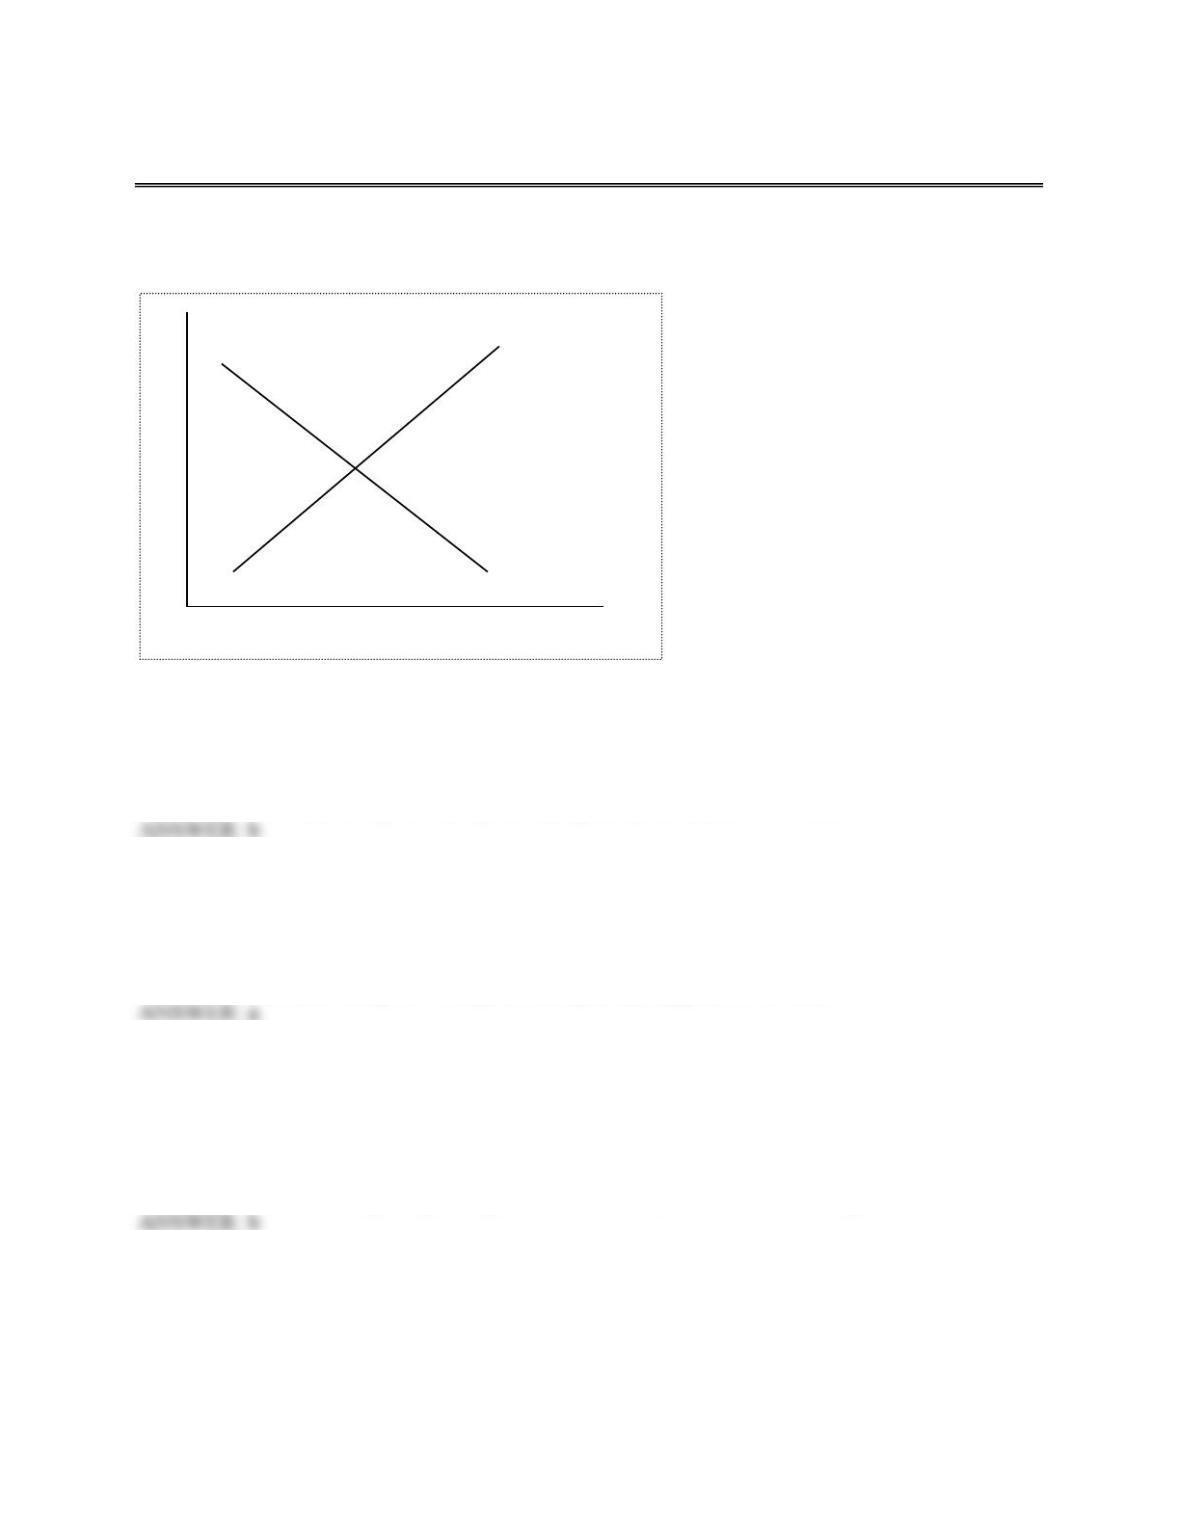
Diagram 27a
246. In Diagram 27a, the demand curve represented by line D shows
a. that there is a positive relationship between price and quantity demanded.
b. that there is an inverse relationship between price and quantity demanded.
c. that the relationship between price and quantity demanded is both positive and inverse.
d. that the relationship between price and quantity demanded is circular.
247. In Diagram 27a, the supply curve represented by line S shows
a. that there is a positive relationship between price and quantity supplied.
b. that there is an inverse relationship between price and quantity supplied.
c. that the relationship between price and quantity supplied it both positive and inverse.
d. that the relationship between price and quantity supplied is circular.
248. Which of the following factors may influence the demand for coffee sold in fast food
restaurants?
a. the cost of coffee beans used to make the coffee.
b. the income of consumers shopping in fast food restaurants.
c. the wages paid to workers in fast food restaurants.
d. the weather during the growing season in Brazil (where the coffee is grown).
S
P
Q
D
249. In the simple supply and demand diagram, equilibrium prices are determined by
a. demand
b. supply
c. both supply and demand
d. the government
Table 27a
Price Quantity Demanded
in January
Quantity Demanded
in February
$35,000 35,000
40,000
$30,000 40,000
45,000
$25,000
45,000
50,000
$20,000 50,000
55,000
$15,000 55,000
60,000
250. Assume Table 27a represents demand schedules for Ford Explorers. In January consumers
would have been willing to purchase 45,000 cars at a price of $25,000. In February, they
would have been willing to purchase 50,000 cars at a price of $25,000. This change
represents
a. an increase in demand.
b. an increase in quantity demanded.
c. an decrease in demand.
d. a decrease in quantity demanded.
251. Assume Table 27a represents demand schedules for Ford Explorers. What might account
for the difference between the January demand schedule and the February demand schedule?
a. There was a shift in consumer preferences in favor of small, fuel efficient cars because of
rising gasoline prices.
b. There was a decrease in consumer income in February.
c. There was a significant increase in the price of other Sport Utility Vehicles on the market.
d. Toyota and Honda announced special decreases on all their Sport Utility Vehicles in
February.
Table 27b
Price Quantity Supplied in
January
Quantity Supplied in
February
$35,000
55,000
60,000
$30,000 50,000
55,000
$25,000
45,000
50,000
$20,000
40,000
45,000
$15,000 35,000
40,000
252. Assume Table 27b represents supply schedules for Ford Explorers. In January Ford Motor
Company would have been willing to supply 55,000 cars at a price of $35,000 and 40,000
cars at a price of $20,000. This change from $35,000 to $20,000 represents
a. an increase in supply.
b. an increase in quantity supplied.
c. an decrease in supply.
d. a decrease in quantity supplied.
253. Assume Table 27a represents supply schedules for Ford Explorers. What might account for
the difference between the January supply schedule and the February supply schedule?
a. an increase in consumer income
b. a decrease in wages paid to Ford factory workers.
c. a decrease in consumer income.
d. an increase in the cost of glass used for windows in Ford Explorers.
254. A movement along the same demand curve is referred to as
a. an change in demand
b. a change in quantity demanded.
c. a change in the demand schedule.
d. an income effect.
APPENDIX 27.1
Equilibrium
MULTIPLE CHOICE
Table 27.1a
Price Quantity Demanded
per month
Quantity Supplied per
month
$35,000
35,000
55,000
$30,000 40,000
50,000
$25,000
45,000
4
5,000
$20,000
50,000
40,000
$15,000 55,000
35,000
255. Assume Table 27.1a represents the supply and demand of Ford Explorers. If price is
currently $30,000
a. the market is in equilibrium.
b. there is excess demand.
c. there is excess supply.
d. there is both excess demand and excess supply
Diagram 27.1a

256. Assume Diagram 27.1a represents the market for wheat bread. The shift in demand from D1
to D2 will
a. cause equilibrium price to fall and equilibrium quantity to fall
b. cause equilibrium price to rise and equillibrium quantity to rise.
c. cause equilibrium price to fall and equilibrium quantity to rise.
d. cause equilibrium price to rise and equilibrium quantity to fall.
257. Assume Diagram 27.1a represents the market for wheat bread. What is a possible cause of
the shift in demand from D1 to D2?
a. An increase in the cost of flour used to make wheat bread.
b. An increase in consumer income.
c. A decrease in the price of rye bread (a substitute for wheat bread).
d. A decrease in wages paid to workers in the bread factory.
258. What would cause an increase in equilibrium quantity accompanied by a decrease in
equilibrium price?
a. A outward shift or increase in demand.
b. An inward shift or decrease in demand.
c. An outward shift or increase in supply
d. An inward shift or decrease in supply.
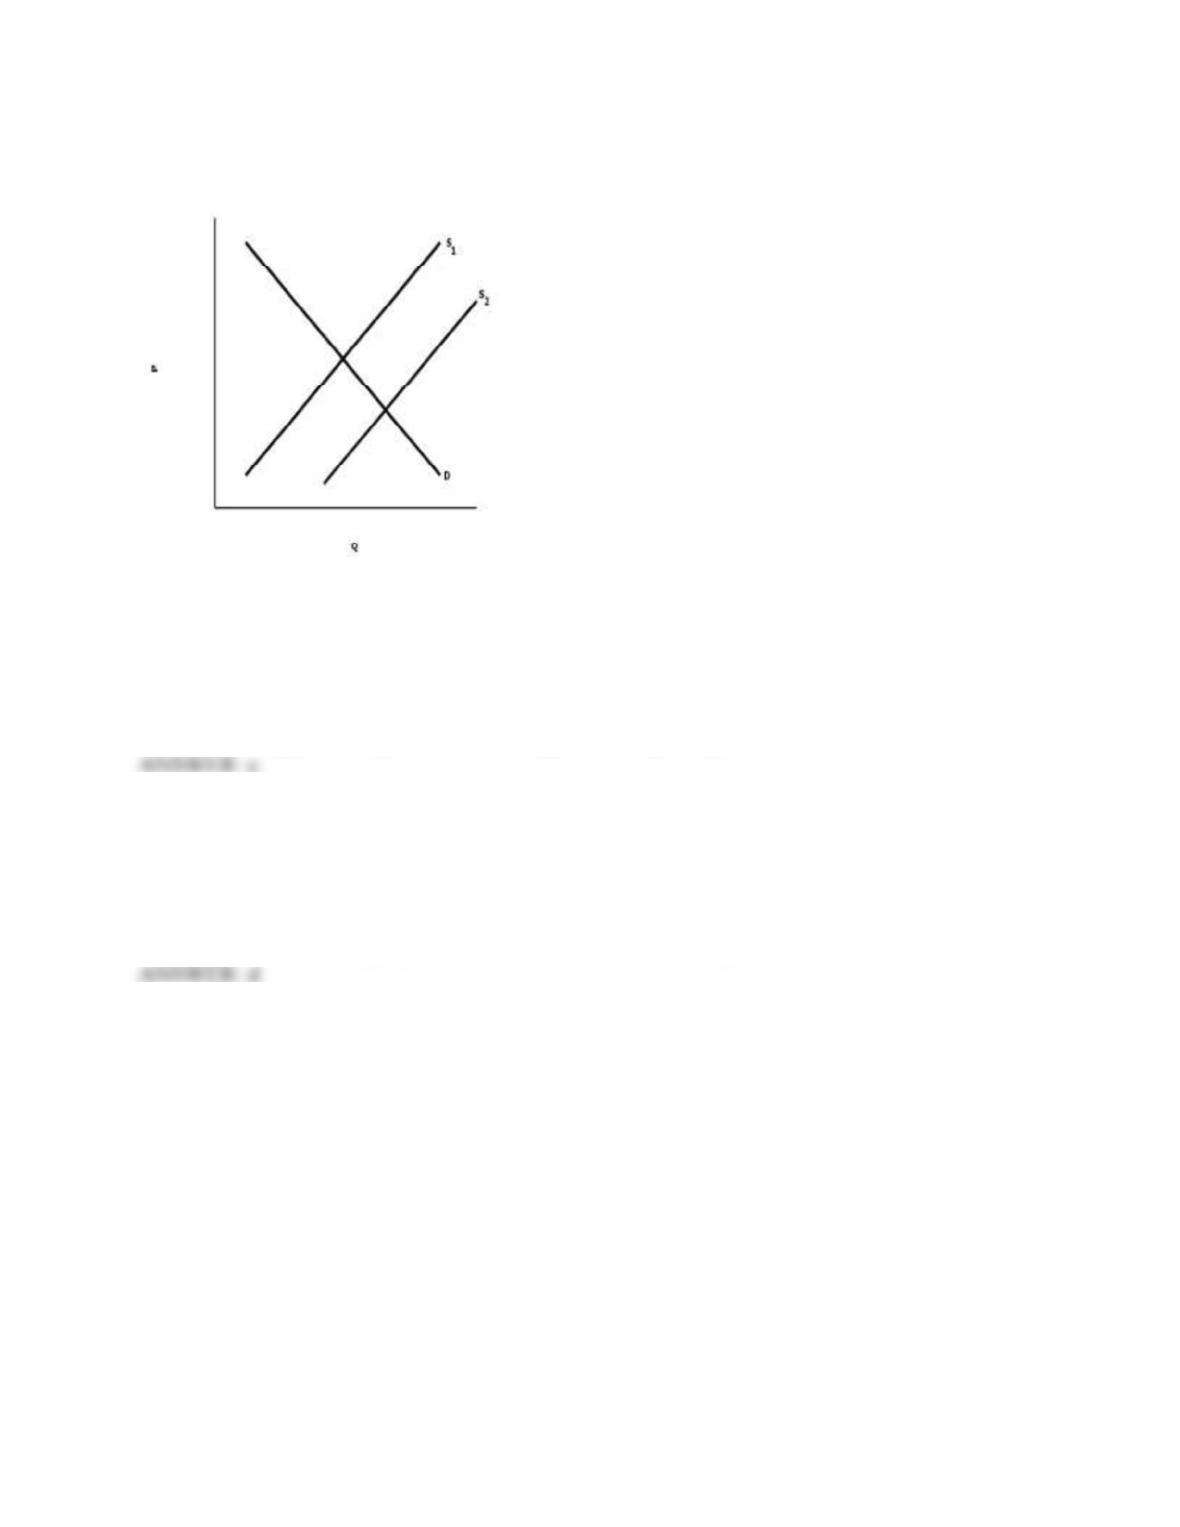
Diagram 27.1b
259. Assume Diagram 27.1b represents the market for wheat bread. The shift in supply from S1
to S2 will
a. cause equilibrium price to fall and equilibrium quantity to fall
b. cause equilibrium price to rise and equillibrium quantity to rise.
c. cause equilibrium price to fall and equilibrium quantity to rise.
d. cause equilibrium price to rise and equilibrium quantity to fall.
260. Assume Diagram 27.1b represents the market for wheat bread. What is a possible cause of
the shift in demand from S1 to S2?
a. An increase in the cost of flour used to make wheat bread.
b. An increase in consumer income.
c. A decrease in the price of rye bread (a substitute for wheat bread).
d. A decrease in wages paid to workers in the bread factory.
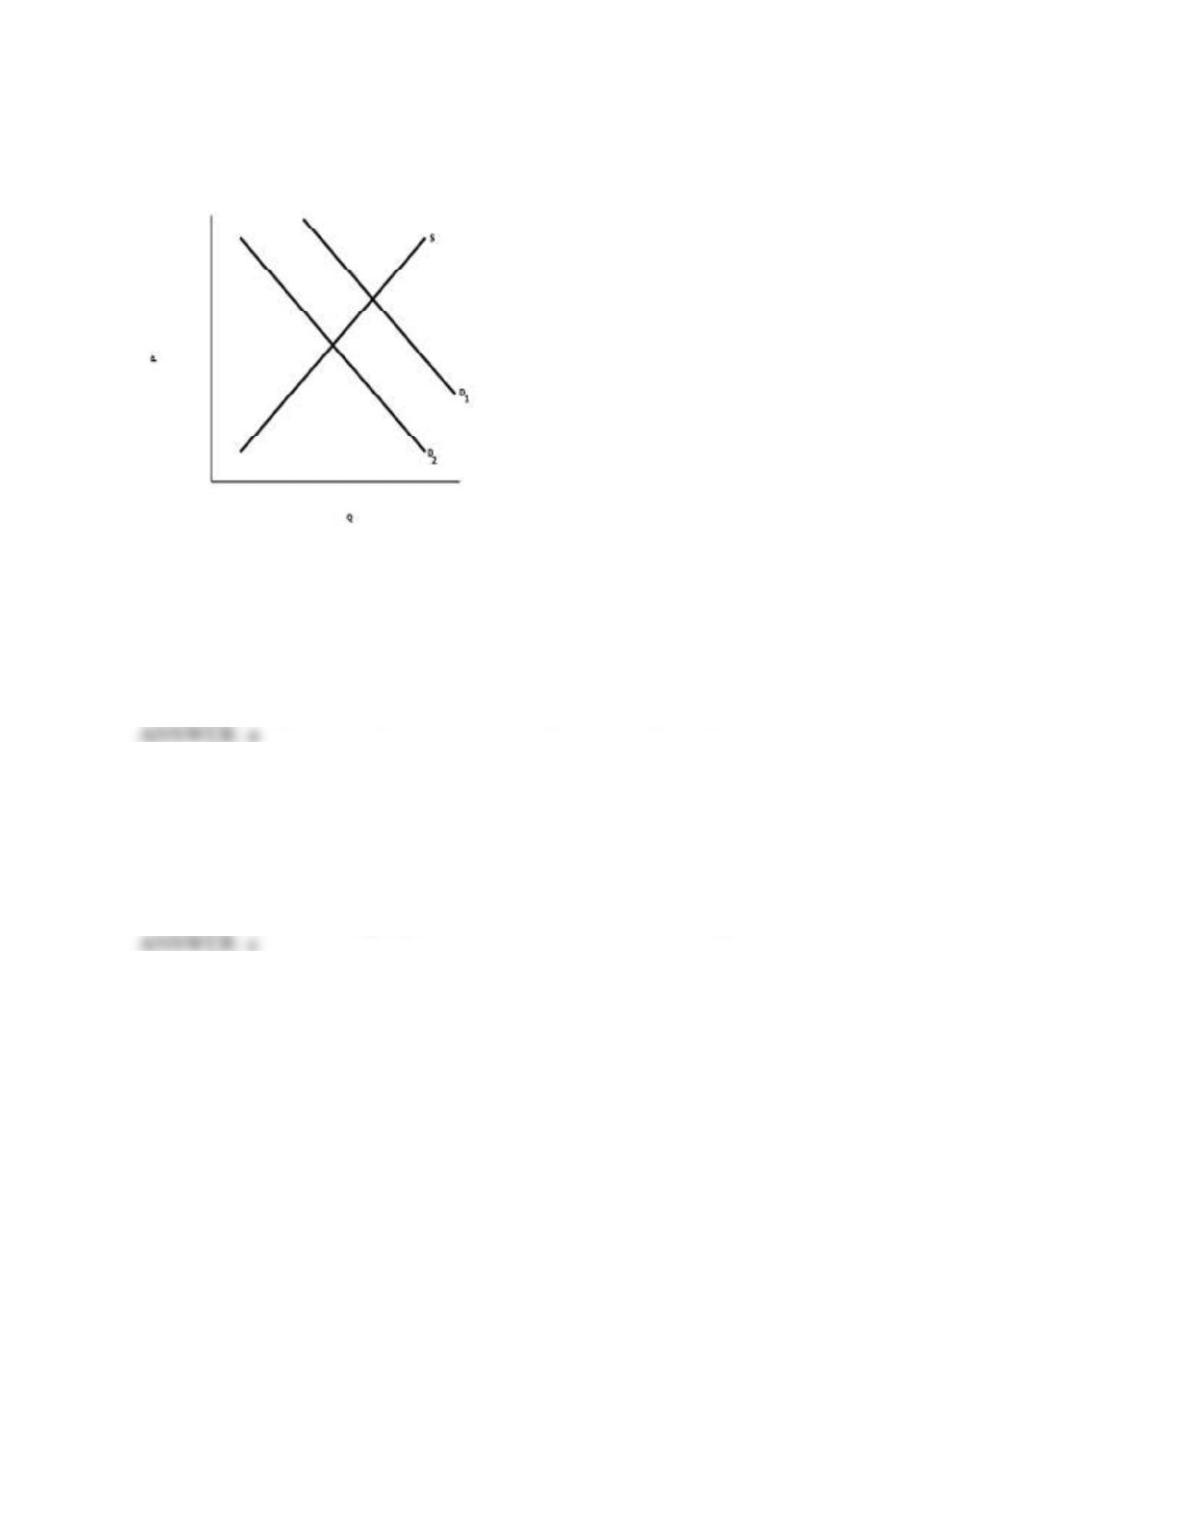
Diagram 27.1c
261. Assume Diagram 27.1b represents the market for wheat bread. The shift in demand from D1
to D2 will
a. cause equilibrium price to fall and equilibrium quantity to fall
b. cause equilibrium price to rise and equillibrium quantity to rise.
c. cause equilibrium price to fall and equilibrium quantity to rise.
d. cause equilibrium price to rise and equilibrium quantity to fall.
262. Assume Diagram 27.1b represents the market for wheat bread. What is a possible cause of
the shift in demand from D1 to D2?
a. An increase in the cost of flour used to make wheat bread.
b. An increase in consumer income.
c. A decrease in the price of rye bread (a substitute for wheat bread).
d. A decrease in wages paid to workers in the bread factory.
APPENDIX 27.2
Elasticity
MULTIPLE CHOICE
263. The price elasticity of demand is defined as
a. the change in quantity demanded divided by the change in price.
b. the percentage change in quantity demanded divided by the percentage change in price.
c. the percentage change in price divided by the percentage change in quantity demanded.
d. the change in price divided by the change in quantity.
264. The owner of a movie theater found that when he raised ticket prices 10%, he sold 20%
more tickets. What is the price elasticity of demand?
a. 0.5
b. 2.0
c. 10
d. 20
265. The owner of a movie theater found that when he raised ticket prices 10%, he sold 20%
more tickets. What kind of elasticity does this response indicate?
a. demand for the ticket is elastic.
b. demand for the tickets is inelastic.
c. demand for the tickets is unit elastic.
d. demand for the tickets has no elasticity.
266. The price of gasoline rose 20% last month, the quantity demanded of gasoline fell by 5%.
What is the price elasticity of demand?
a. 20
b. 5
c. 0.25
d. 25
267. Using the midpoint formula, calculate the price elasticity of demand for the following
situation: Price rises from $6 to $8, quantity demanded falls from 2 units to 1 unit.
a. 0.5
b. 2.33
c. 1.66
d. 4
268. Since there is no substitute for insulin, we would expect the price elasticity of demand for
insulin to be
a. elastic
b. inelastic
c. unit elastic
d. zero
269. Assume Harvard wants to raise more revenue from tuition. What should Harvard do if the
price elasticity of demand for a Harvard education is inelastic?
a. Harvard should raise tuition in order to collect more tuition from each student.
b. Harvard should lower tuition in order to increase the number of students paying tuition.
c.
from a higher price would be offset by the loss of students.
d. It depends on the price elasticity of supply at the local community college.
270. Assume a move theater owner wants to raise more revenue from ticket sales. What should
the theater owner due if the price elasticity of demand for his tickets is elastic?
a. the theater owner should raise ticket prices in order to collect more from each customer.
b. the theater owner should lower ticket prices in order to increase the number of customers.
c. the theater owner should keep ticket prices the same, because h
sales.
d. It depends on what movie is currently showing at the theater.
271. What is income elasticity?
a. the percent change in quantity demanded divided by the percent change in consumer
income.
b. the percent change in consumer income divided by the percent change in quantity
demanded.
c. the percent change in quantity supplied divided by the percent change in consumer
income.
d. the percent change in consumer income divided by the percent change in quantity
supplied.
272. A good whose consumption increases when income increases
a. is an inferior good.
b. is a complementary good.
c. is a substitute good.
d. is a normal good.
273. A good with an income elasticity greater than one is
a. a necessity good.
b. a luxury good.
c. an inferior good.
d. a normal good.
274. A good with an income elasticity less than one is
a. a necessity good.
b. a luxury good.
c. an inferior good.
d. a normal good.
275. If the quantity demanded of bagels increases when the price of doughtnut increases, then
bagels and doughnuts are
a. substitutes.
b. complements.
c. necessities.
d. inferior.
276. If the quantity demanded of good A falls when the price of good B rises, then good A and
good B are
a. substitutes.
b. complements.
c. necessities.
d. inferior.
277. The cross price elasticity measures
a. the responsiveness of demand for a good when income changes.
b. the responsiveness of demand for a good when the price of that good changes.
c. the responsiveness of supply of a good when the price of that good changes.
d. the responsiveness of demand for a good when the price of a different good changes.