CHAPTER 26
Scarcity and Choice
Neoclassical View
230. According to neoclassical economists, the central economic problem is
a. rapid technological change
b. unchecked population growth.
c. choice due to the existence of scarcity
d. the distribution of income.
231. Neoclassical economists make a number of assumptions about people. Which of the
following is not a basic assumption of neoclassical economics?
a. People often make irrational decisions.
b. People make decisions in their own self-interest.
c. People have unlimited wants and desires.
d. People weigh costs and benefits in making decisions.
232. What is the attitude of neoclassical economists toward scarcity?
a. scarcity results from the unlimited desires of people.
b. scarcity can be solved by the operation of the free market.
c. scarcity is the result of speculators trying to drive up prices.
d. scarcity is a hoax perpetuated by radical environmentalists.
233.
a. business associations such as the Chamber of Commerce.
b. international organizations such as the United Nations.
c. social systems, habits and customs that influence human behavior.
d. major governmental bodies such as the Congress and the Supreme court.
234. The Production Possibilities Curve is a device designed to demonstrate what principle?
a. the existence of trade-offs.
b. the effect of consumer demand on prices.
c. the effect of unlimited resources on production decisions.
d. that there are no limits to production possibilities.
235.
a. ice cream
b. lumber
c. bread
d. a cell phone
236. What d
a. computers and other electronic devices.
b. equipment used to produce other goods.
c. knowledge, techniques and tools used to produce goods.
d. software
APPENDIX 26.1
More on the Production Possibility Curve
237. What is the definition of opportunity cost?
a. the costs of expanding your opportunities.
b. the cost of not taking advantage of your opportunities.
c. the cost of the best alternative that you choose.
d. the cost of the best alternative that you do not choose.
238. What is the definition of marginal cost?
a. the cost of buying things on the margin.
b. the additional cost of producing an additional item.
c. the average cost per unit.
d. the cost of buying a stock online.
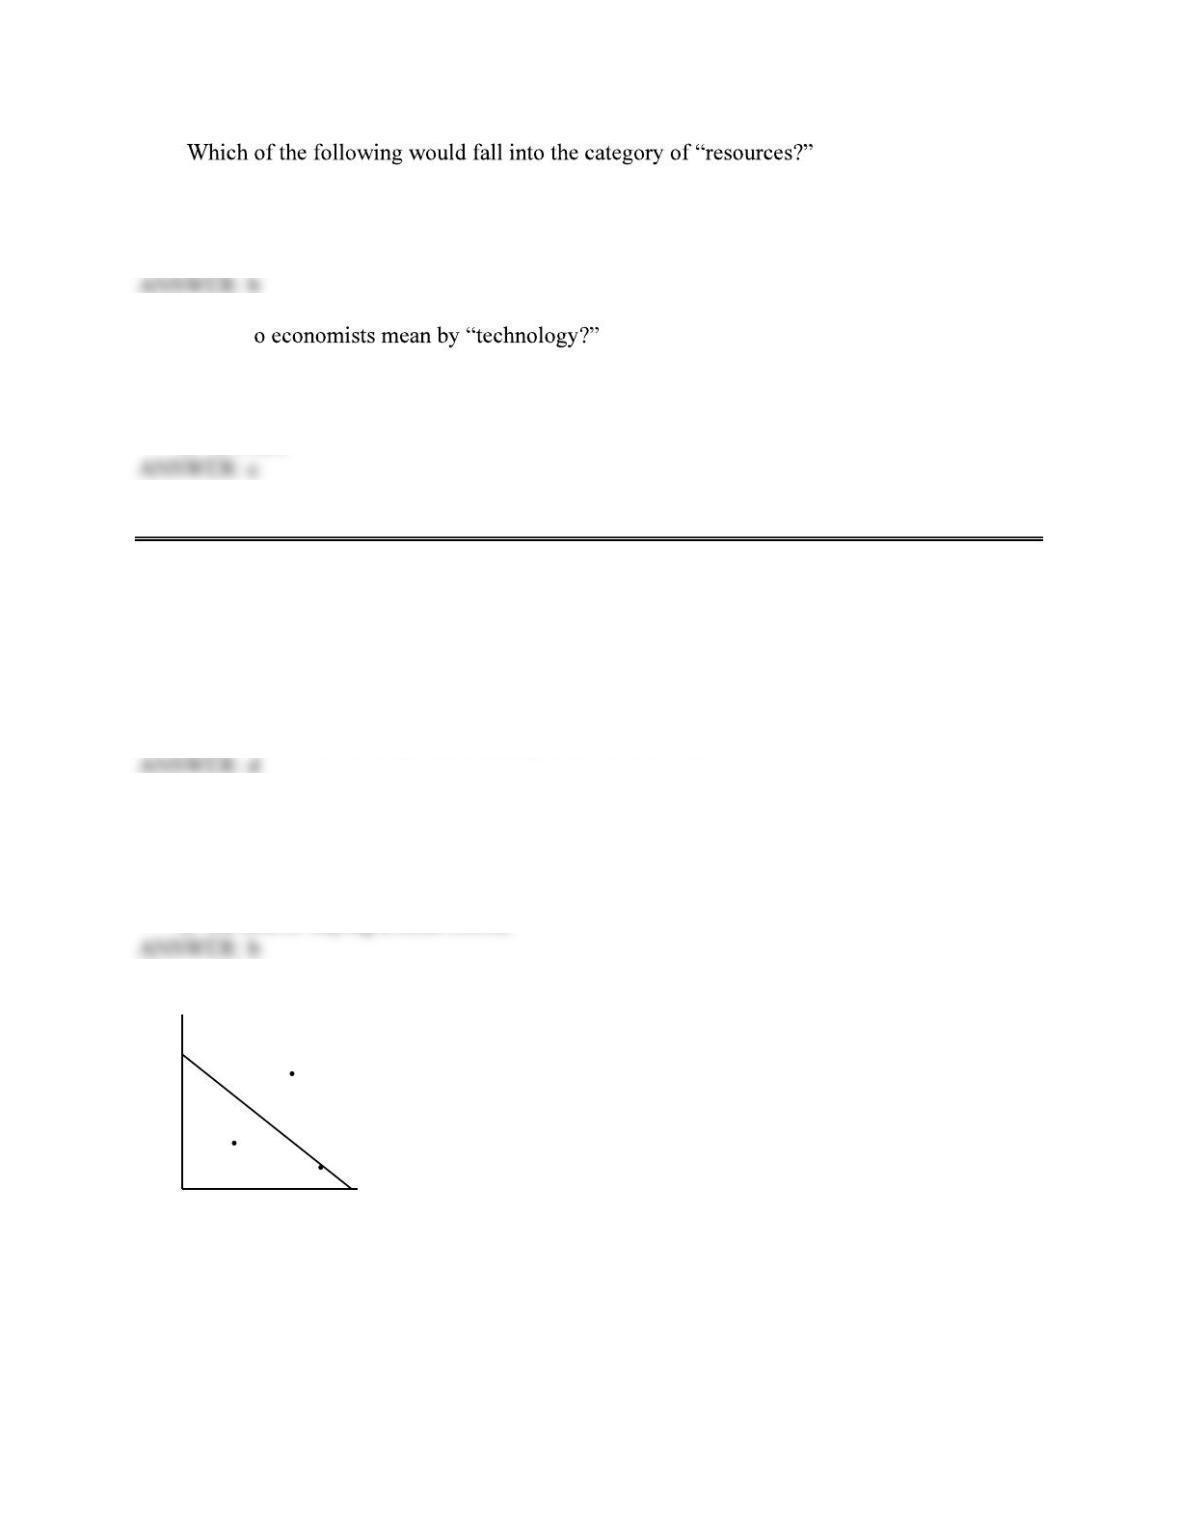
Diagram 26.1a
Point Y
Good A
Good B
Point W
Point X
Good B
239. In Diagram 26.1a, Point X represents
a. a production possibility that is not presently attainable.
b. a production possibility that is attainable and efficient.
c. a production possibility that is attainable but inefficient.
d. a increasing opportunity costs.
240. In Diagram 26.1a, Point W represents
a. a production possibility that is not presently attainable.
b. a production possibility that is attainable and efficient.
c. a production possibility that is attainable but inefficient.
d. a increasing opportunity costs.
241. In Diagram 26.1a, Point Y represents
a. a production possibility that is not presently attainable.
b. a production possibility that is attainable and efficient.
c. a production possibility that is attainable but inefficient.
d. a increasing opportunity costs.
242. The production possibilities curve depicted in Diagram 26.1 reflects
a. increasing opportunity costs
b. decreasing opportunity costs
c. constant opportunity costs.
d. the absence of opportunity costs.
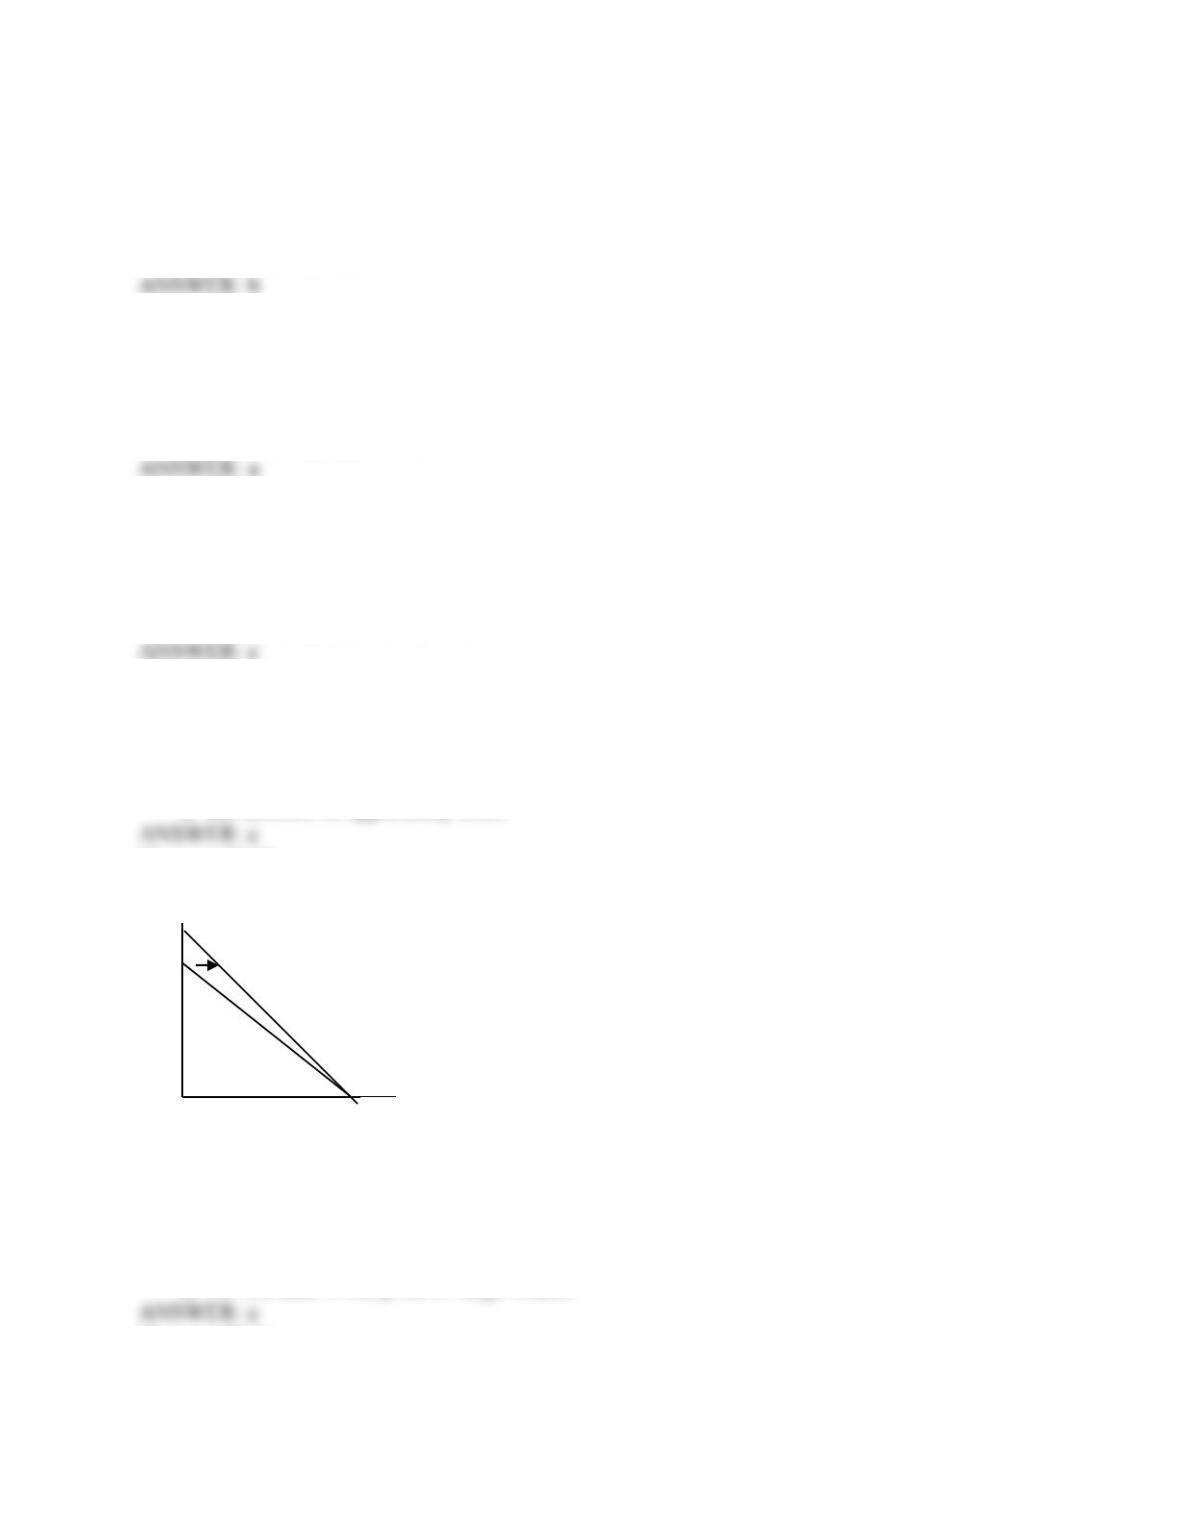
Diagram 26.1b
243. The shift in the production possibilities curve in Diagram 26.1b means
a. An improvement in painting technology suitable for both large and small houses.
b. An improvement in painting technology suitable only for small houses.
c. An improvement in painting technology suitable only for large houses.
d. An increase in the price of large houses.
Diagram 26.1c
Large Houses
Small Houses

244. The production possibilities curve shown in Diagram 26.1c reflects
a. constant opportunity costs
b. increasing opportunity costs
c. no opportunity costs.
d. unlimited resources.
245. The shift in the production possibilities curve shown in Diagram 26.1c reflects
a. an increase in resources used in the production of both goods.
b. a decrease in resources used in the production of both goods.
c. an decrease in resources used in the production of bamboo only.
d. an decrease in resources used in the production of coconuts only.
Coconuts
Bamboo