
58. A decrease in the expected future income of the United States would likely:
A. shift its AD curve to the left.
B. shift its AD curve to the right.
C. make its AD curve flatter.
D. make its AD curve steeper.
59. Suppose prices in the United States are expected to decline in the future. The effect today is
likely to:
A. shift the AD curve to the left.
B. shift the AD curve to the right.
C. make the AD curve flatter.
D. make the AD curve steeper.
60. If a country is experiencing high inflation, other things equal, the expectations of worsening
inflation in the future would probably:
A. shift the AD curve to the left.
B. shift the AD curve to the right.
C. make the AD curve flatter.
D. make the AD curve steeper.

61. Which of the following would shift the aggregate demand curve to the right?
A. An increase in foreign income
B. An appreciation of the value of a country’s currency
C. A lower future expected price level
D. An increase in imports
62. Which of the following would shift the aggregate demand curve to the left?
A. An increase in foreign income
B. A depreciation in the value of the country’s currency
C. A higher future expected price level
D. A decrease in exports
63. A fall in the value of the dollar relative to other currencies will:
A. increase foreign demand for U.S. goods, shifting the U.S. aggregate demand curve to the
right.
B. increase foreign demand for U.S. goods, shifting the U.S. aggregate demand curve to the left.
C. decrease foreign demand for U.S. goods, shifting the U.S. aggregate demand curve to the
right.
D. decrease foreign demand for U.S. goods, shifting the U.S. aggregate demand curve to the left.
64. In 2015, the Brazilian currency, the real, depreciated significanly. The AS/AD model
predicts that this would cause a trade:
A. deficit for Brazil and shifted its AD curve left
B. surplus for Brazil and shifted its AD curve left.
C. deficit for Brazil and shifted its AD curve right.
D. surplus for Brazil and shifted its AD curve right.
65. From 1975 to 1995, the value of the dollar in terms of yen fell from over 300 yen per dollar
to about 100 yen per dollar. Considering the impact of this alone, this would likely:
A. shift the U.S. AD curve to the left.
B. shift the U.S. AD curve to the right.
C. make the U.S. AD curve flatter.
D. make the U.S. AD curve steeper.
66. If the dollar were to depreciate against major foreign currency, the dollar’s depreciation
should result in:
A. an increase in U.S. exports and an outward shift of the U.S. aggregate demand curve.
B. an increase in U.S. exports and an inward shift of the U.S. aggregate demand curve.
C. a decrease in U.S. exports and an outward shift of the U.S. aggregate demand curve.
D. a decrease in U.S. exports and an inward shift of the U.S. aggregate demand curve.
67. If total income remains the same but profits fall and real wages rise, the aggregate demand
curve will most likely:
A. shift to the right.
B. shift to the left.
C. become flatter.
D. become steeper.
68. If total income in Sweden remains the same but the wage share of income rises, the Swedish
AD curve will most likely:
A. shift to the left.
B. shift to the right.
C. become flatter.
D. become steeper.
69. The new government of Pakistan transfers money from the rich to the poor. This will likely:
A. shift the Pakistani AD curve to the left.
B. shift the Pakistani AD curve to the right.
C. make the Pakistani AD curve flatter.

D. make the Pakistani AD curve steeper.
70. In the early 1930s, U.S. government expenditures increased as part of the New Deal without
any change in taxes. This:
A. shifted the AD curve to the left.
B. shifted the AD curve to the right.
C. made the AD curve flatter.
D. made the AD curve steeper.
71. If the U.S. government increased taxes without changing spending, the U.S. AD curve
would:
A. shift to the left.
B. shift to the right.
C. become flatter.
D. become steeper.
72. If the U.S. government increases its expenditures (without any change in taxes) and at the
same time the Federal Reserve Bank increases the money supply, the AD curve would:
A. shift to the left.
B. shift to the right.
C. become flatter.
D. become steeper.
73. If the U.S. government increases its expenditures (without any changes in taxes) while the
Federal Reserve Bank decreases the money supply:
A. the AD curve would likely shift to the left.
B. the AD curve would likely shift to the right.
C. the AD curve would likely remain unchanged.
D. what happens to the AD curve is unclear.
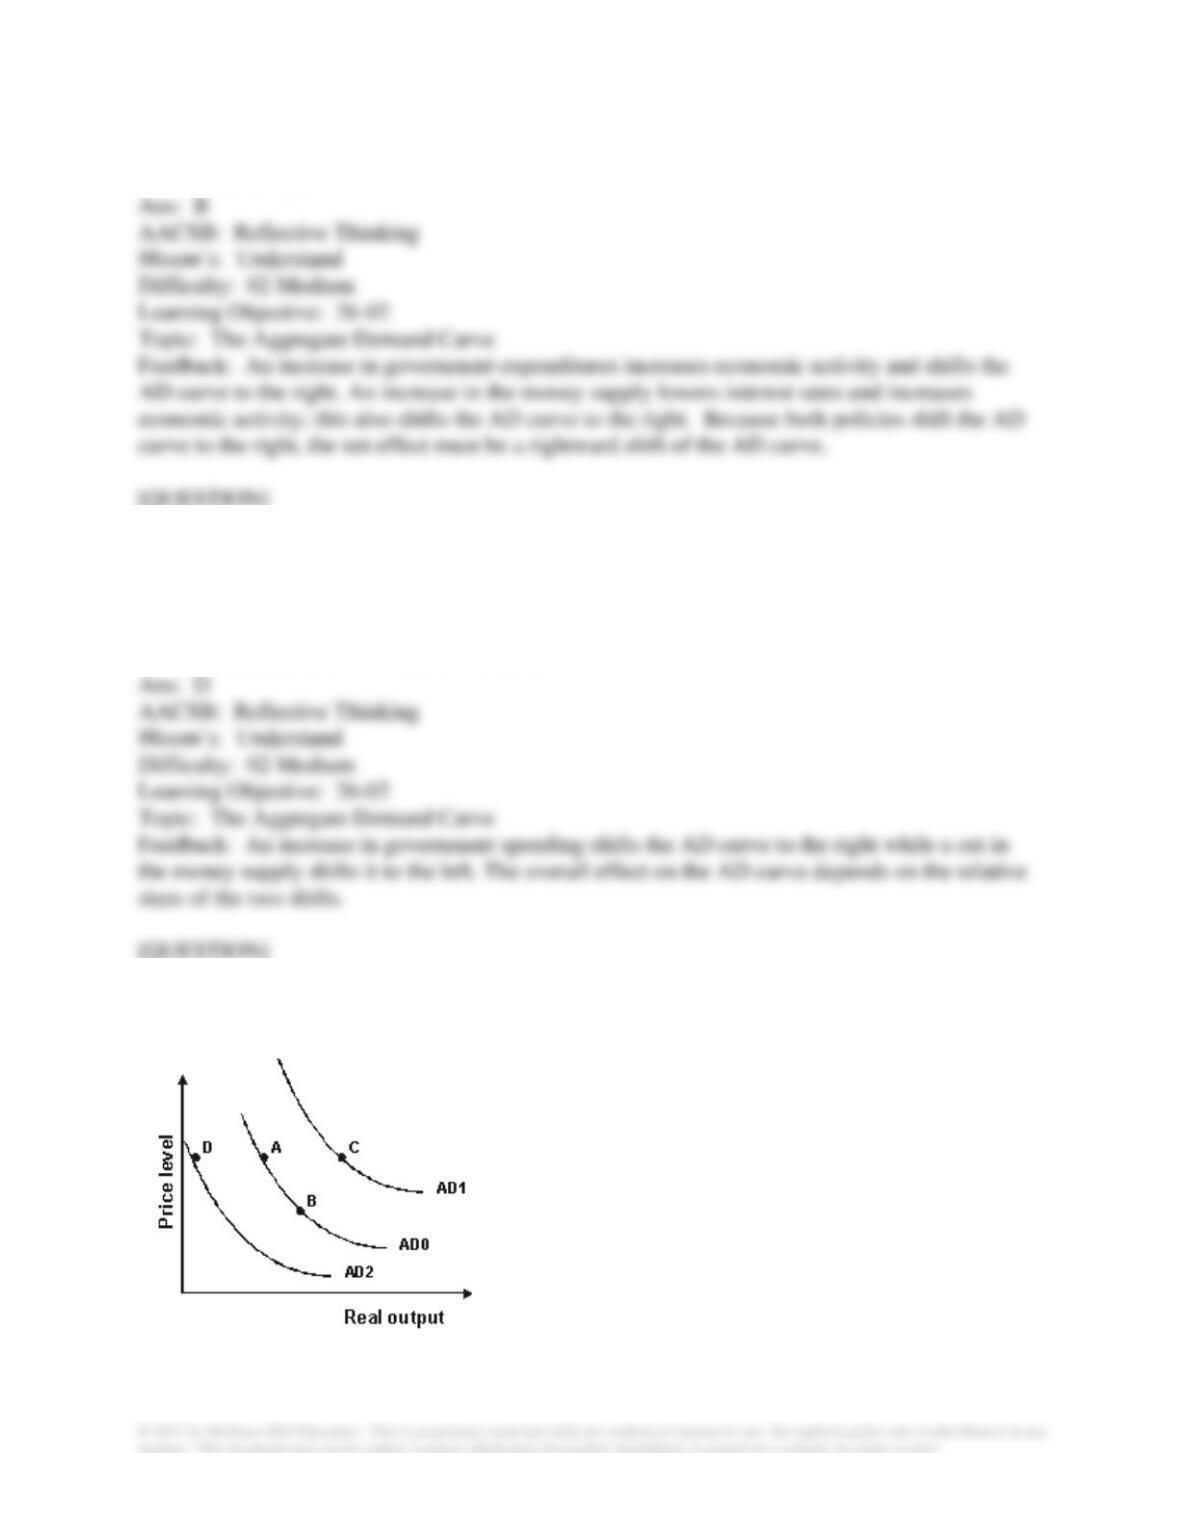
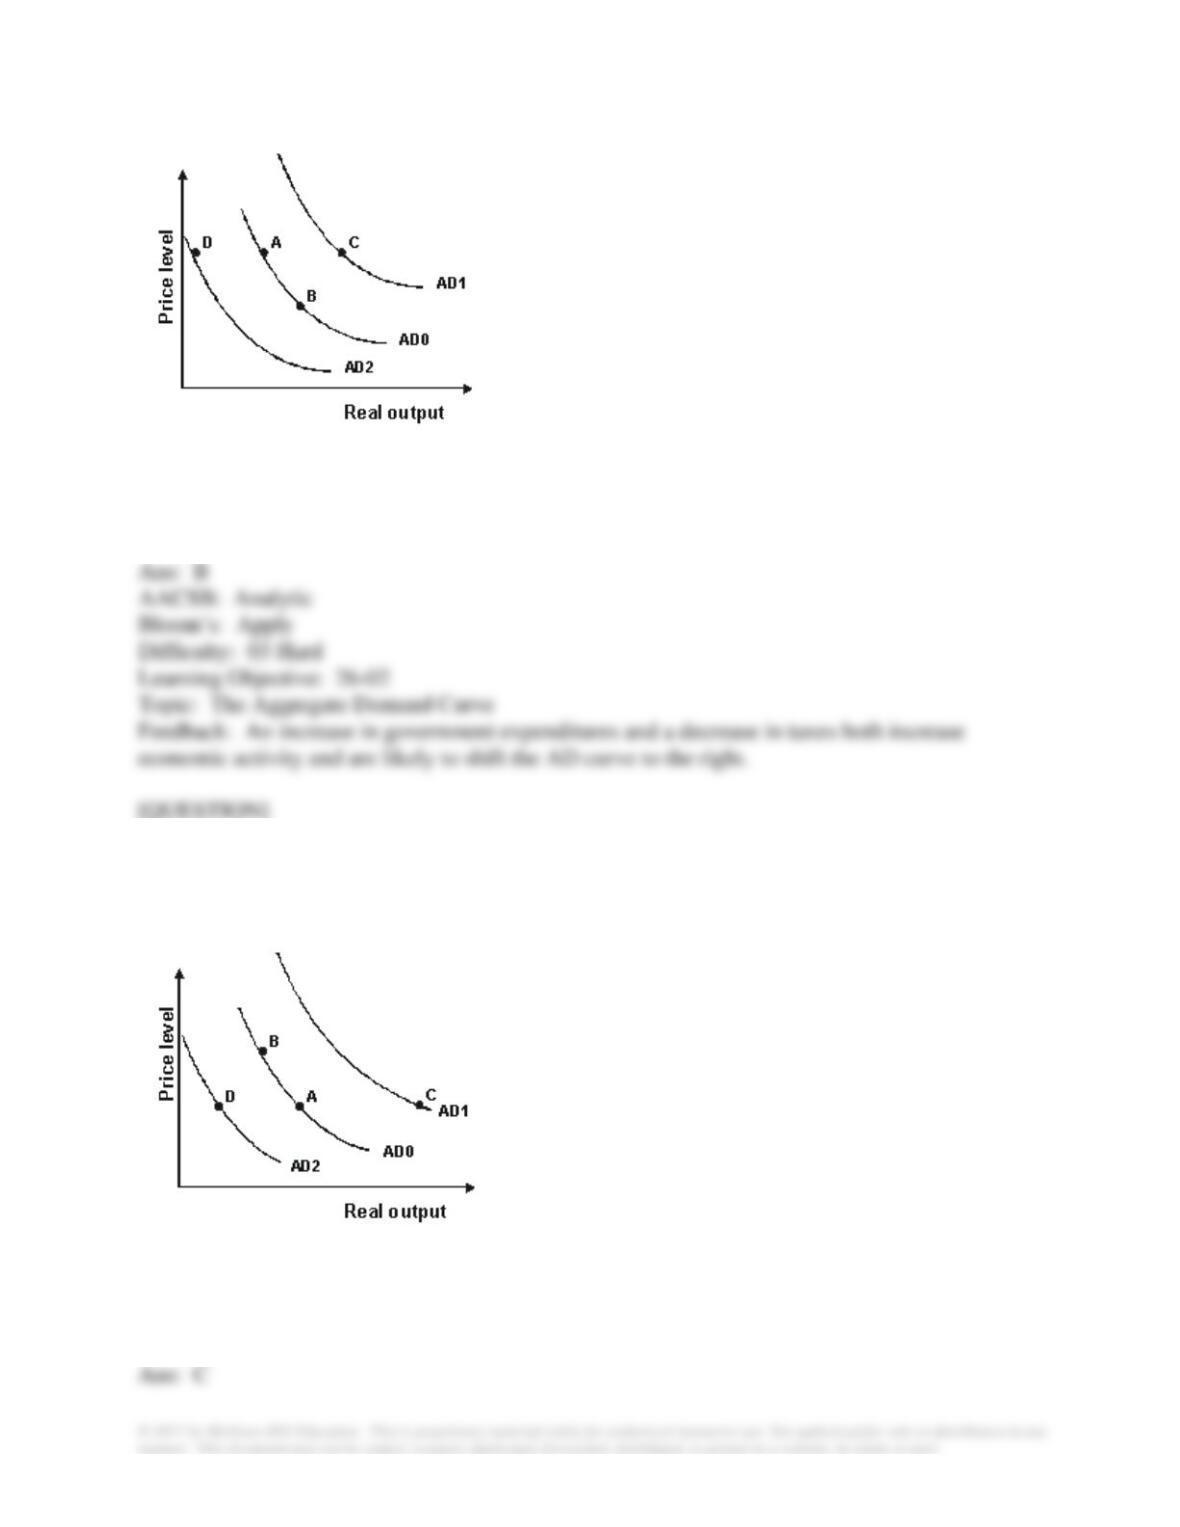
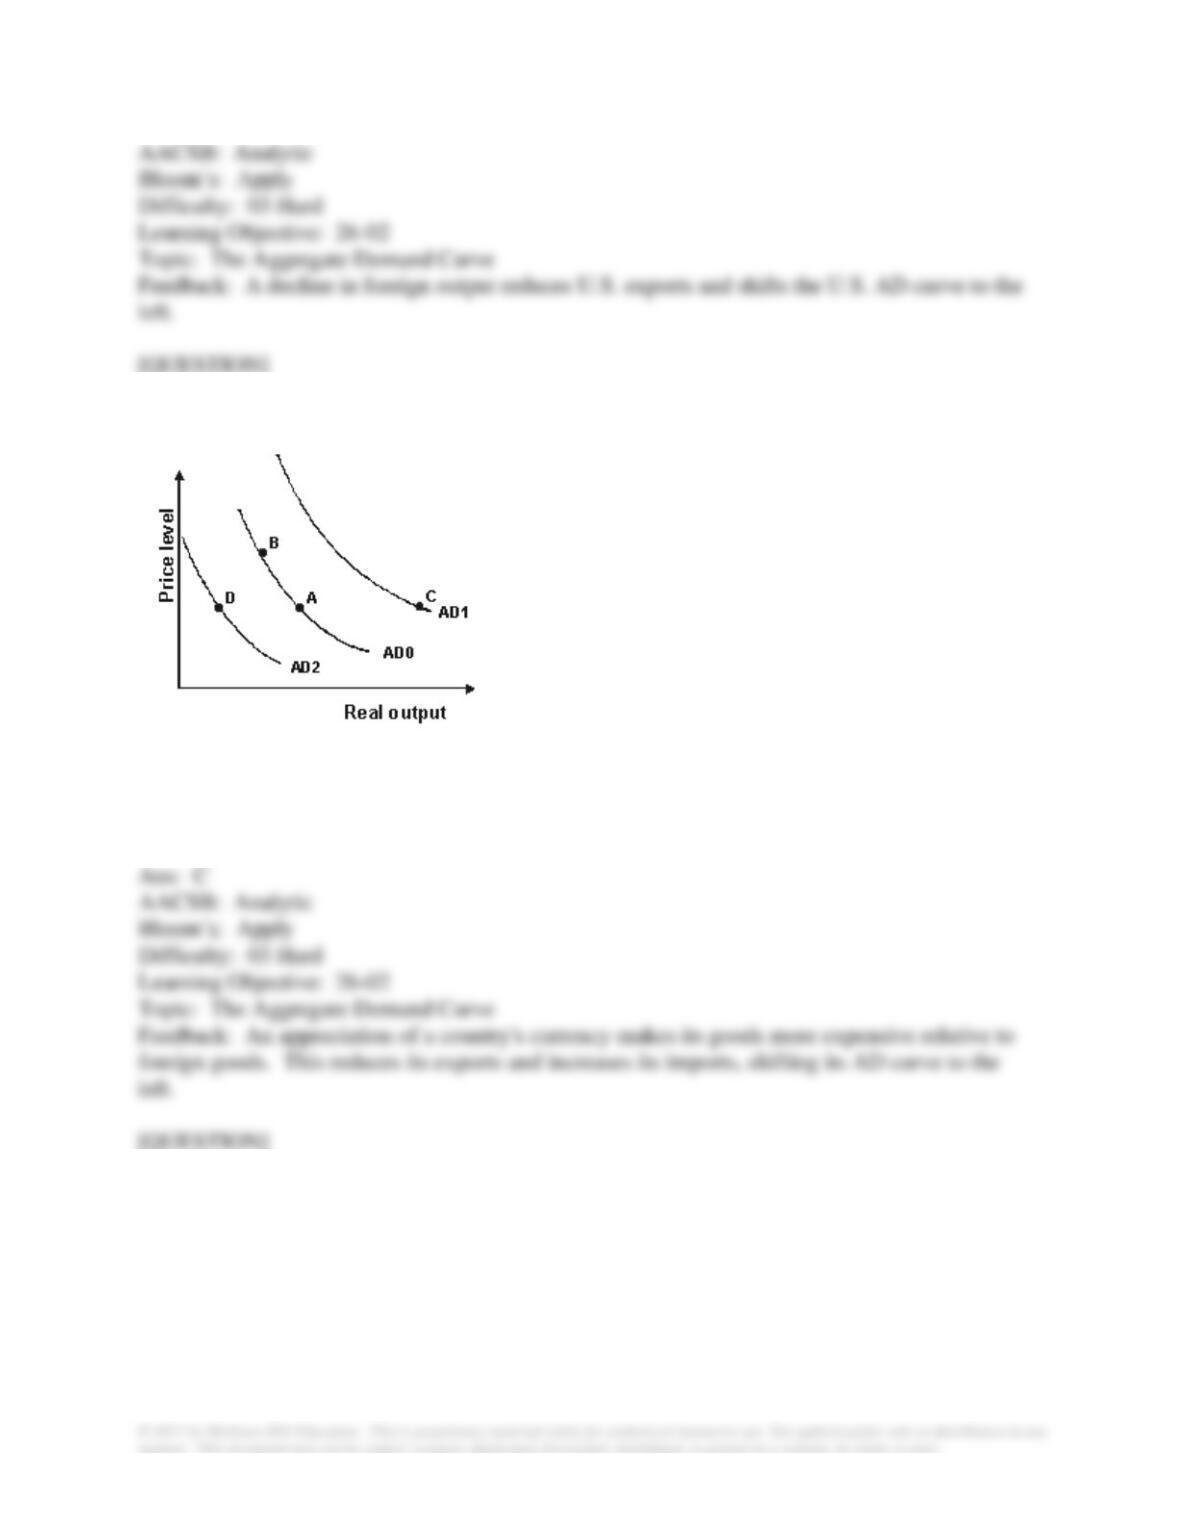
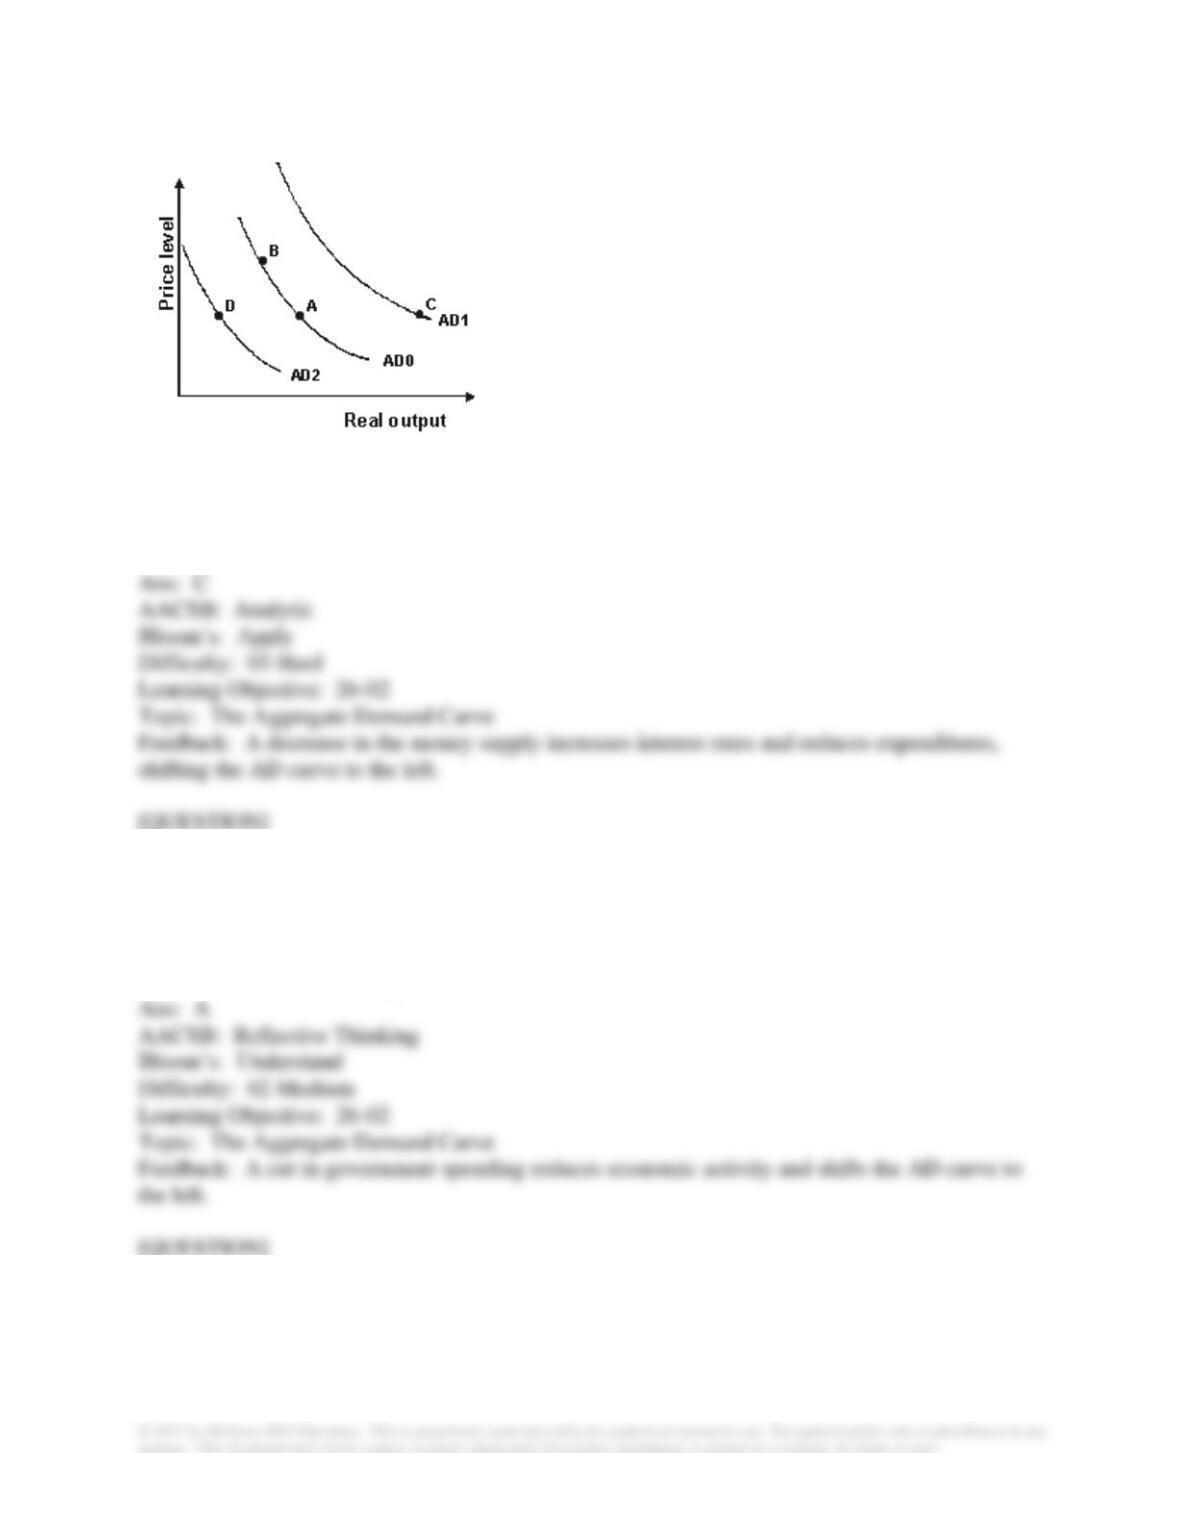
74. Refer to the graph shown. From 1938 to 1943 the Federal deficit rose from $1.0 billion to
$53.8 billion due to increased defense spending. The effect of this on the AD curve can be
shown by a movement from:
A. A to B.
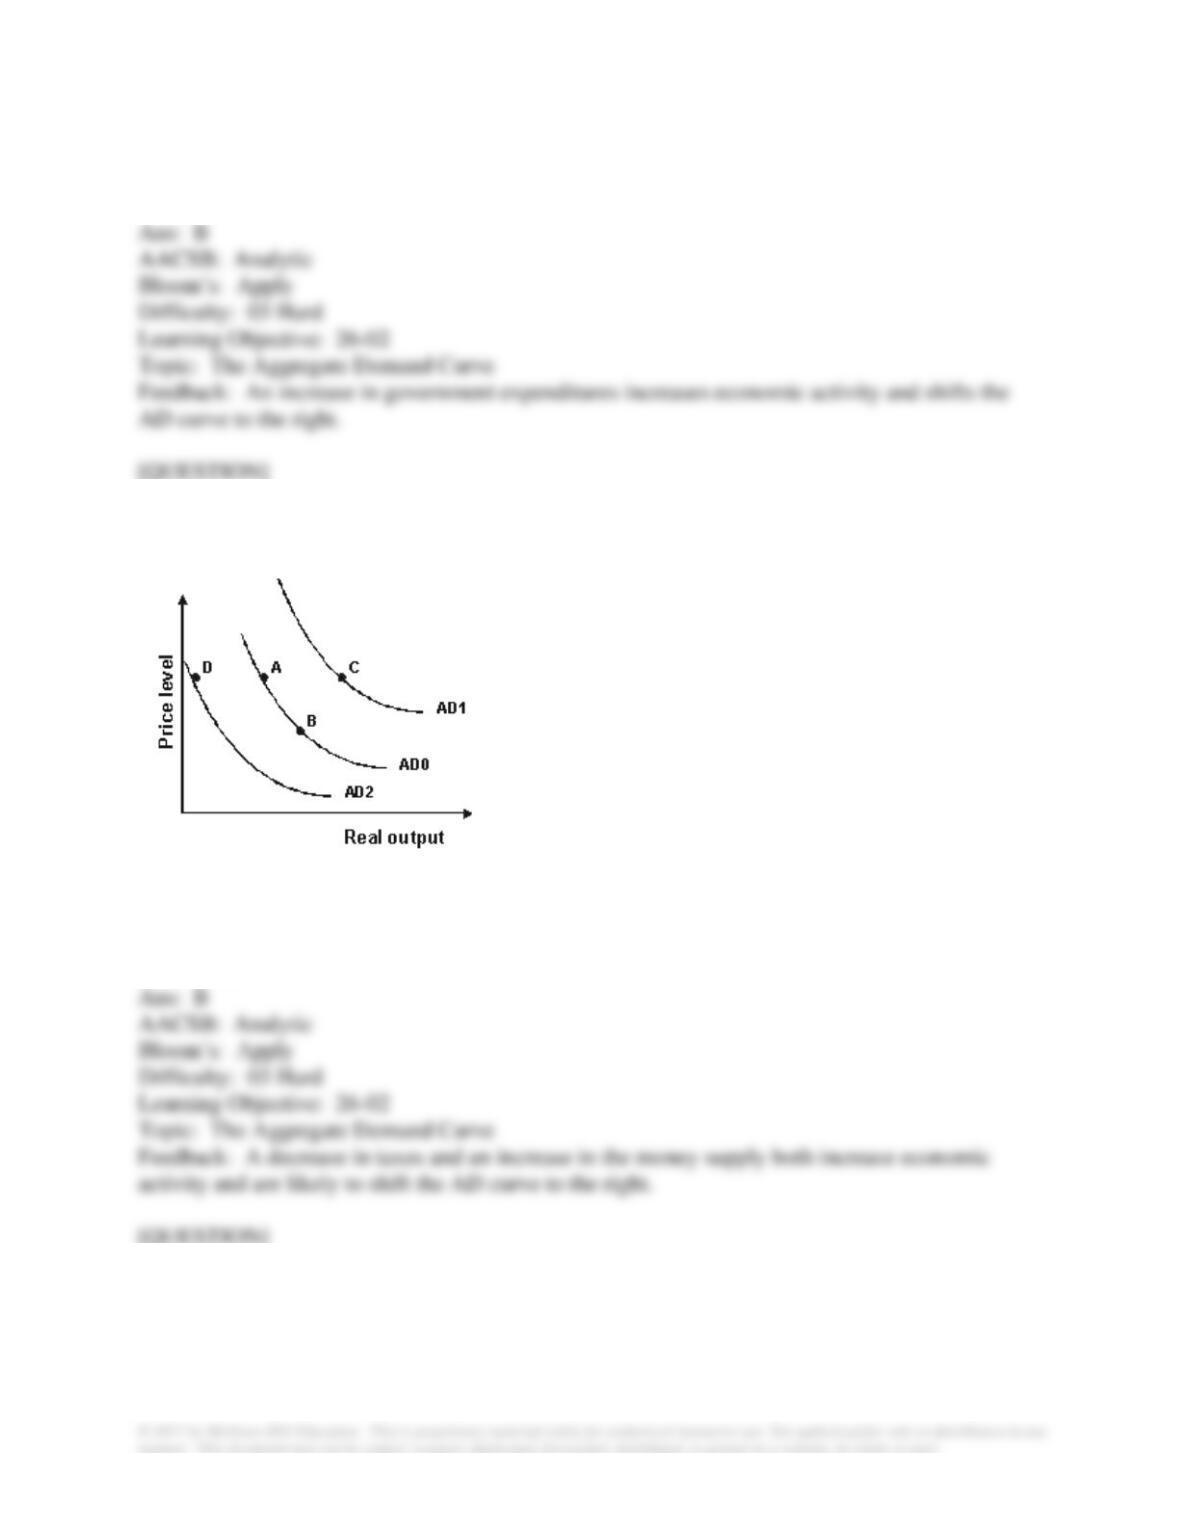
B. A to C.
C. A to D.
D. B to A.
75. Refer to the graph shown. In 1975 U.S. President Gerald Ford instituted a large tax cut. At
the same time, the Fed expanded the money supply. The effect of these policies on the AD curve
is best shown as a movement from:
A. A to B.
B. D to A.
C. A to D.
D. B to A.
76. Refer to the graph shown. During the Reagan Administration (1981 to 1989), tax rates were
reduced significantly, while federal defense spending rose by 80 percent. The effect of these
policies on the AD curve is best shown as a movement from:
A. A to B.
B. A to C.
C. A to D.
D. B to A.
77. Refer to the graph shown. In 1930, the United States passed the Smoot-Hawley Tariff Act,
which raised tariffs on imported goods at an average of 60 percent. Other countries retaliated
with similar tariffs and world output declined. The effect of the decline in foreign output on the
U.S. AD curve can be shown by a movement from:
A. A to B.
B. A to C.
C. A to D.
D. B to A.
78. Refer to the graph shown. From 1980 to 1985, the U.S. dollar appreciated over 60 percent.
The effect of this appreciation on the AD curve can be shown by a movement from:
A. A to B.
B. A to C.
C. A to D.
D. B to A.
79. Refer to the graph shown. From 1929 to 1933 the money supply fell in the United States by
40 percent. The effect of this on the AD curve is best shown by a movement from:
A. A to B.
B. A to C.
C. A to D.
D. B to A.
80. In the summer of 1953, the Korean War ended and government expenditures decreased. In
terms of the AS/AD model, this change should have:
A. shifted the AD curve to the left.
B. shifted the AD curve to the right.
C. made the AD curve flatter.
D. made the AD curve steeper.
81. In 1968, the government instituted a 26 percent income tax surcharge. In terms of the
AS/AD model, this change should have:
A. shifted the AD curve to the left.
B. shifted the AD curve to the right.

C. made the AD curve flatter.
D. made the AD curve steeper.
82. To combat inflation in 1955 and 1956, the Fed reduced the money supply. In terms of the
AS/AD model, this change should have:
A. shifted the AD curve to the left.
B. shifted the AD curve to the right.
C. made the AD curve flatter.
D. made the AD curve steeper.
83. If the dollar appreciates while foreign income rises:
A. the U.S. AD curve would likely shift to the left.
B. the U.S. AD curve would likely shift to the right.
C. the U.S. AD curve would likely remain unchanged.
D. what happens to the U.S. AD curve is unclear.
84. During the Vietnam War, Congress increased government expenditures while raising taxes.
As a result we know that:
A. the AD curve shifted to the left.
B. the AD curve shifted to the right
C. the AD curve remained unchanged.
D. What happened to the AD curve is unclear.
85. If a fall in foreign income decreases domestic aggregate expenditures by 20, the AD curve
will:
A. shift left by more than 20.
B. shift left by less than 20.
C. shift left by exactly 20.
D. not shift at all.
86. If the depreciation of a country’s currency increases its aggregate expenditures by 20, the AD
curve will:
A. shift right by more than 20.
B. shift right by less than 20.
C. shift right by exactly 20.
D. not shift at all.
87. If a fall in the price level made people feel richer and initially increased aggregate

expenditures by 20, the AD curve would:
A. shift by more than 20.
B. shift by less than 20.
C. shift by exactly 20.
D. not shift at all.
88. If the multiplier is 4, a $15 billion increase in government expenditures will shift the AD
curve:
A. to the right by $15 billion.
B. to the left by $15 billion.
C. to the right by $60 billion.
D. to the left by $60 billion.
89. The axes for the short-run aggregate supply curve are:
A. real output and the price level.
B. real output and unemployment.
C. inflation and real output.
D. unemployment and inflation.
90. The short-run aggregate supply curve is upward sloping for all of the following reasons
except:
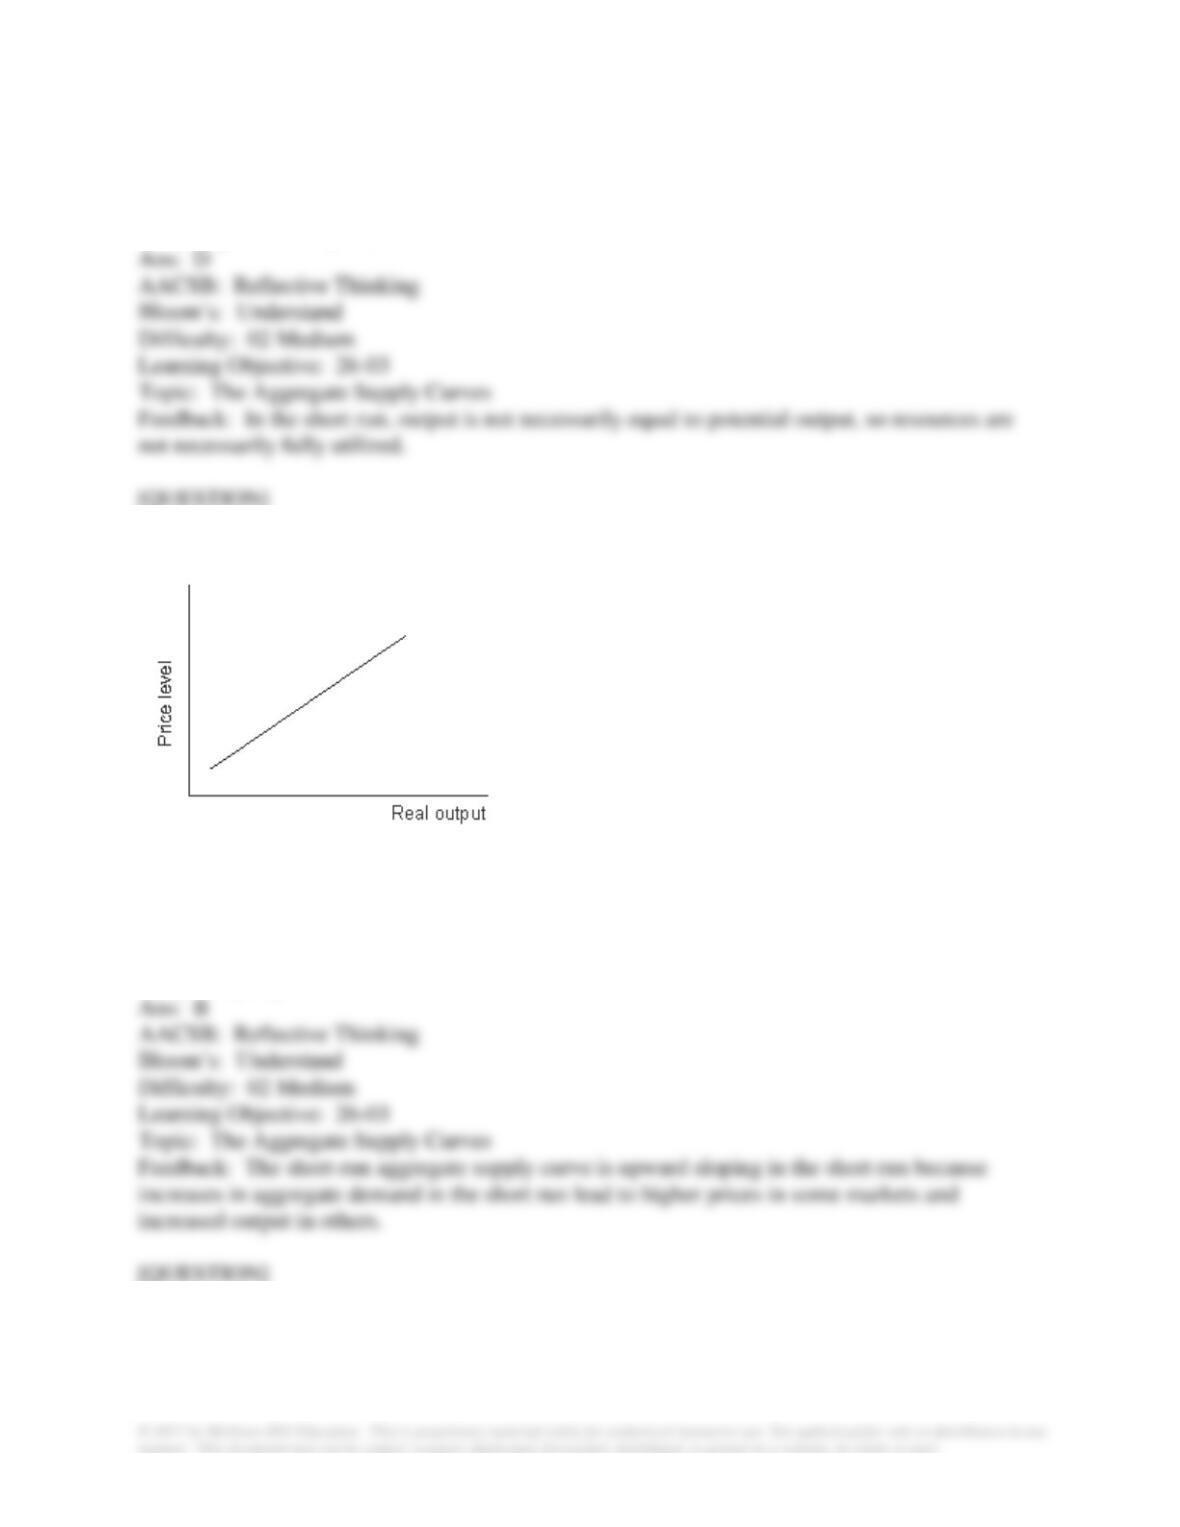
A. some firms adjust their markup in response to an increase in demand.
B. some firms adjust their production in response to an increase in demand.
C. some markets are posted-price markets.
D. all inputs are fully utilized in the short run.
91. Refer to the following graph.
The upward sloping relationship in the diagram represents the:
A. aggregate demand curve.
B. short-run aggregate supply curve.
C. long-run aggregate supply curve.
D. quantity adjustment curve.
92. During the late 1990s in the United States, aggregate demand rose sharply but the price level
increased much more slowly. This might be because during this period, firms:
A. were reluctant to increase their markups in the face of higher aggregate demand, causing the
short-run aggregate supply curve to be steeper.
B. increased their markups in the face of higher aggregate demand, causing the short-run
aggregate supply curve to be steeper.
C. increased their markups in the face of higher aggregate demand, causing the short-run
aggregate supply curve to be flatter.
D. were reluctant to increase their markups in the face of higher aggregate demand, causing the
short-run aggregate supply curve to be flatter.
93. What of the following would be the best example of a posted-price market?
A. Auctions on eBay.com
B. Computers at Apple.com
C. Stock prices at Schwab.com
D. Pirline tickets on priceline.com
94. With an upward-sloping short-run aggregate supply curve, firms respond to a change in
aggregate demand by adjusting:
A. both prices and quantities in the short run.
B. prices but not quantities in the short run.
C. quantities but not prices in the short run.
D. neither prices nor quantities in the short run.

95. According to the short-run aggregate supply curve, firms are most likely to respond to an
increase in aggregate demand by raising:
A. prices.
B. production.
C. both production and prices.
D. neither production nor prices.
96. An increase in production costs is most likely to shift the:
A. short-run aggregate supply curve up (to the left).
B. short-run aggregate supply curve down (to the right).
C. aggregate demand curve to the left.
D. aggregate demand curve to the right.
97. A sharp increase in oil prices along with a decline in labor productivity decline will likely
shift the:
A. short-run aggregate supply curve up (to the left).
B. short-run aggregate supply curve down (to the right).
C. aggregate demand curve to the right.
D. aggregate demand curve to the left.
98. Federal Reserve policy makers argue about whether productivity is increasing faster than it
has in the past. If productivity is growing faster than anticipated, they would expect the:
A. aggregate demand curve to be shifting to the right.
B. aggregate demand curve to be shifting to the left.
C. short-run aggregate supply curve to be shifting down (to the right).
D. short-run aggregate supply curve to be shifting up (to the left).
99. In early 2000s, oil prices were rising because of concern about the Iraqi and other situations,
along with rapid growth in demand in the Far East. Prices eventually reached over $100 a barrel.
How would most economists predict these high prices should affect the U.S. economy in terms
of the AD/AS model?
A. They would have no effect because oil prices are a microeconomic phenomenon.
B. They do not change anything, but are evidence of a shift in the aggregated demand curve to
the right.
C. Because oil is an important input in many production processes, the higher prices should shift
the short-run aggregate supply curve up (to the left).
D. Because oil is an important input in many production processes, the higher prices should shift
the short-run aggregate supply curve down (to the right).
100. If productivity increases by 2 percent but wages increase by 3 percent, then it is most likely
that the:
A. short-run aggregate supply curve will shift up (to the left).
B. short-run aggregate supply curve will shift down (to the right).
C. short-run aggregate supply curve will not shift.
D. aggregate demand curve will shift left.
101. If workers begin to expect more inflation in the future, then we would expect that the:
A. short-run aggregate supply curve will shift up (to the left).
B. short-run aggregate supply curve will shift down (to the right).
C. short-run aggregate supply curve will not shift.
D. aggregate demand curve will shift left.
102. If productivity increases by 5 percent but wages increase by 2 percent, then it is most likely
that the price level will:
A. rise by 3 percent.
B. fall by 3 percent.
C. rise by 7 percent.
D. fall by 7 percent.

103. If productivity increases by 3 percent but wages increase by 4 percent, then it is most likely
that the price level will:
A. rise by 1 percent.
B. fall by 1 percent.
C. rise by 7 percent.
D. fall by 7 percent.
104. The short-run aggregate supply curve is most likely to shift down (to the right) if:
A. productivity falls.
B. wages rise.
C. sales taxes increase.
D. input prices fall.
105. In the early 2000s the European Central Bank warned that higher oil prices were a threat to
economic growth. The Bank President called the higher prices “a sizeable adverse shock” to the
economy. In terms of the AS/AD framework, this shock would be represented as a shift:
A. up (to the left) of the AS curve.
B. down (to the right) of the AS curve.
C. left of the AD curve.
D. right of the AD curve.
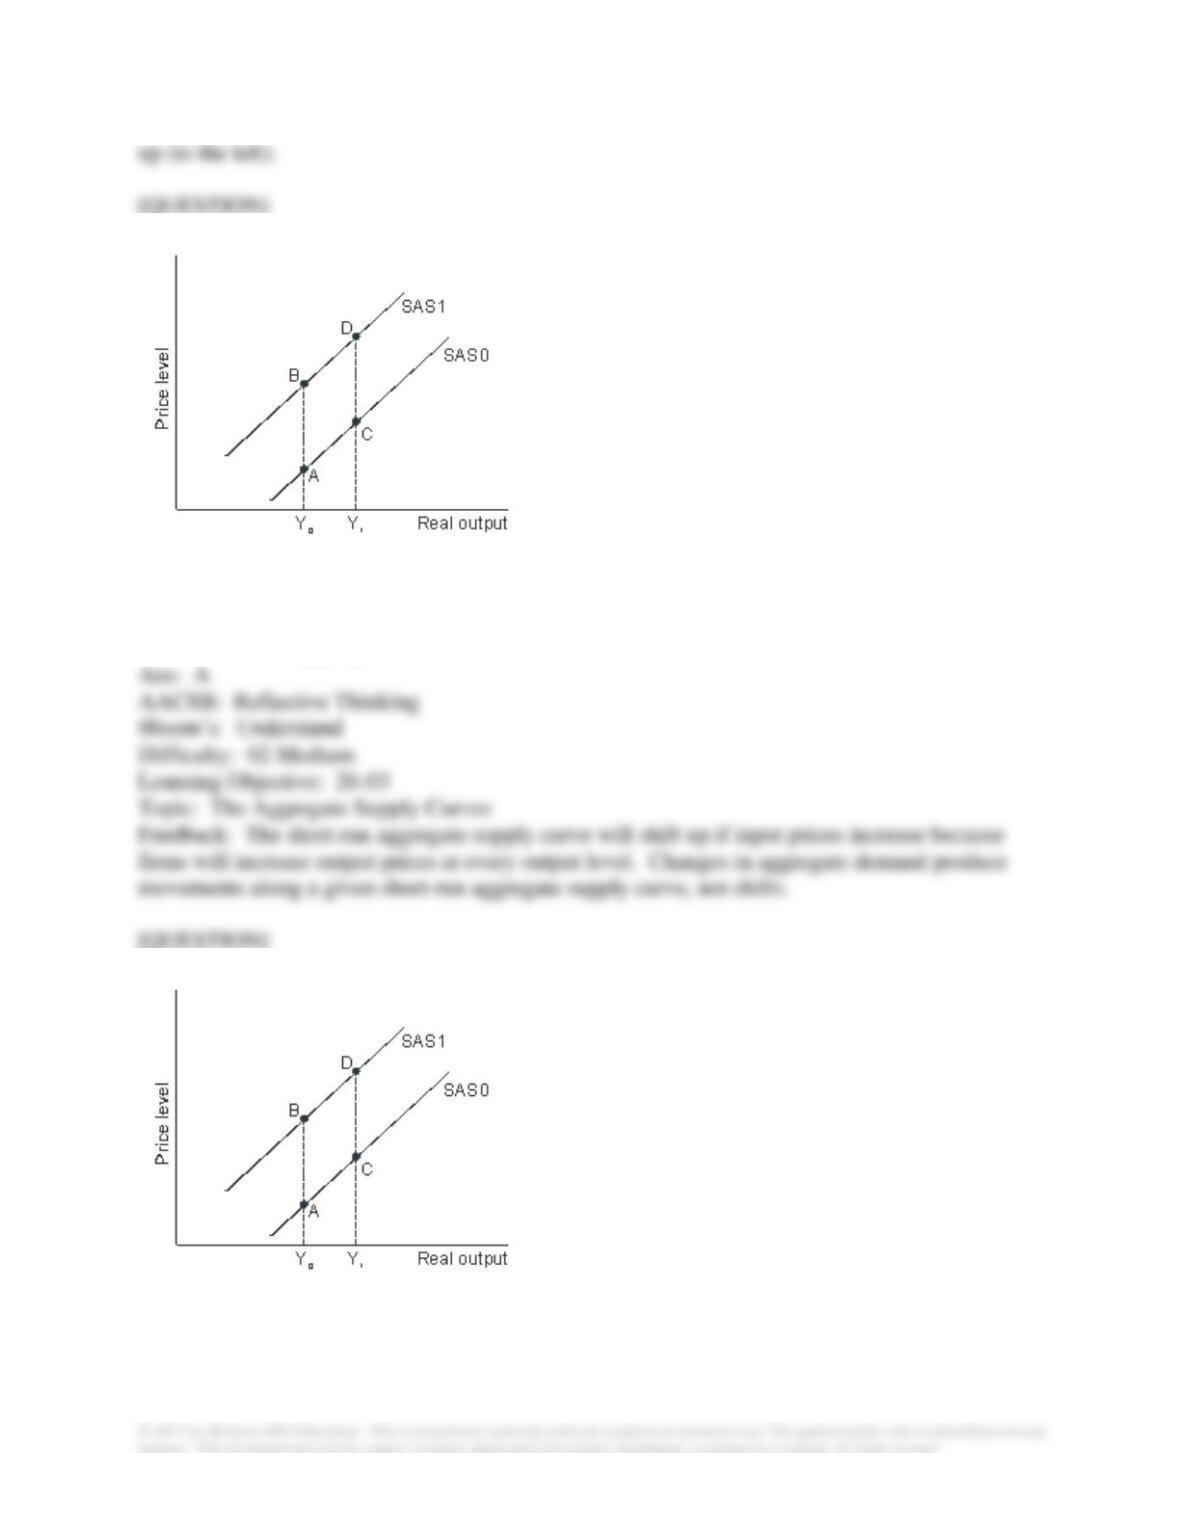
106. Refer to the graph shown. A movement from A to B is most likely to be caused by:
A. an increase in input prices.
B. a decrease in input prices.
C. an increase in aggregate demand.
D. a decrease in aggregate demand.
107. Refer to the graph shown. A movement from A to C is most likely to be caused by:
A. an increase in input prices.
B. a decrease in input prices.
C. an increase in aggregate demand.