Multiple Choice
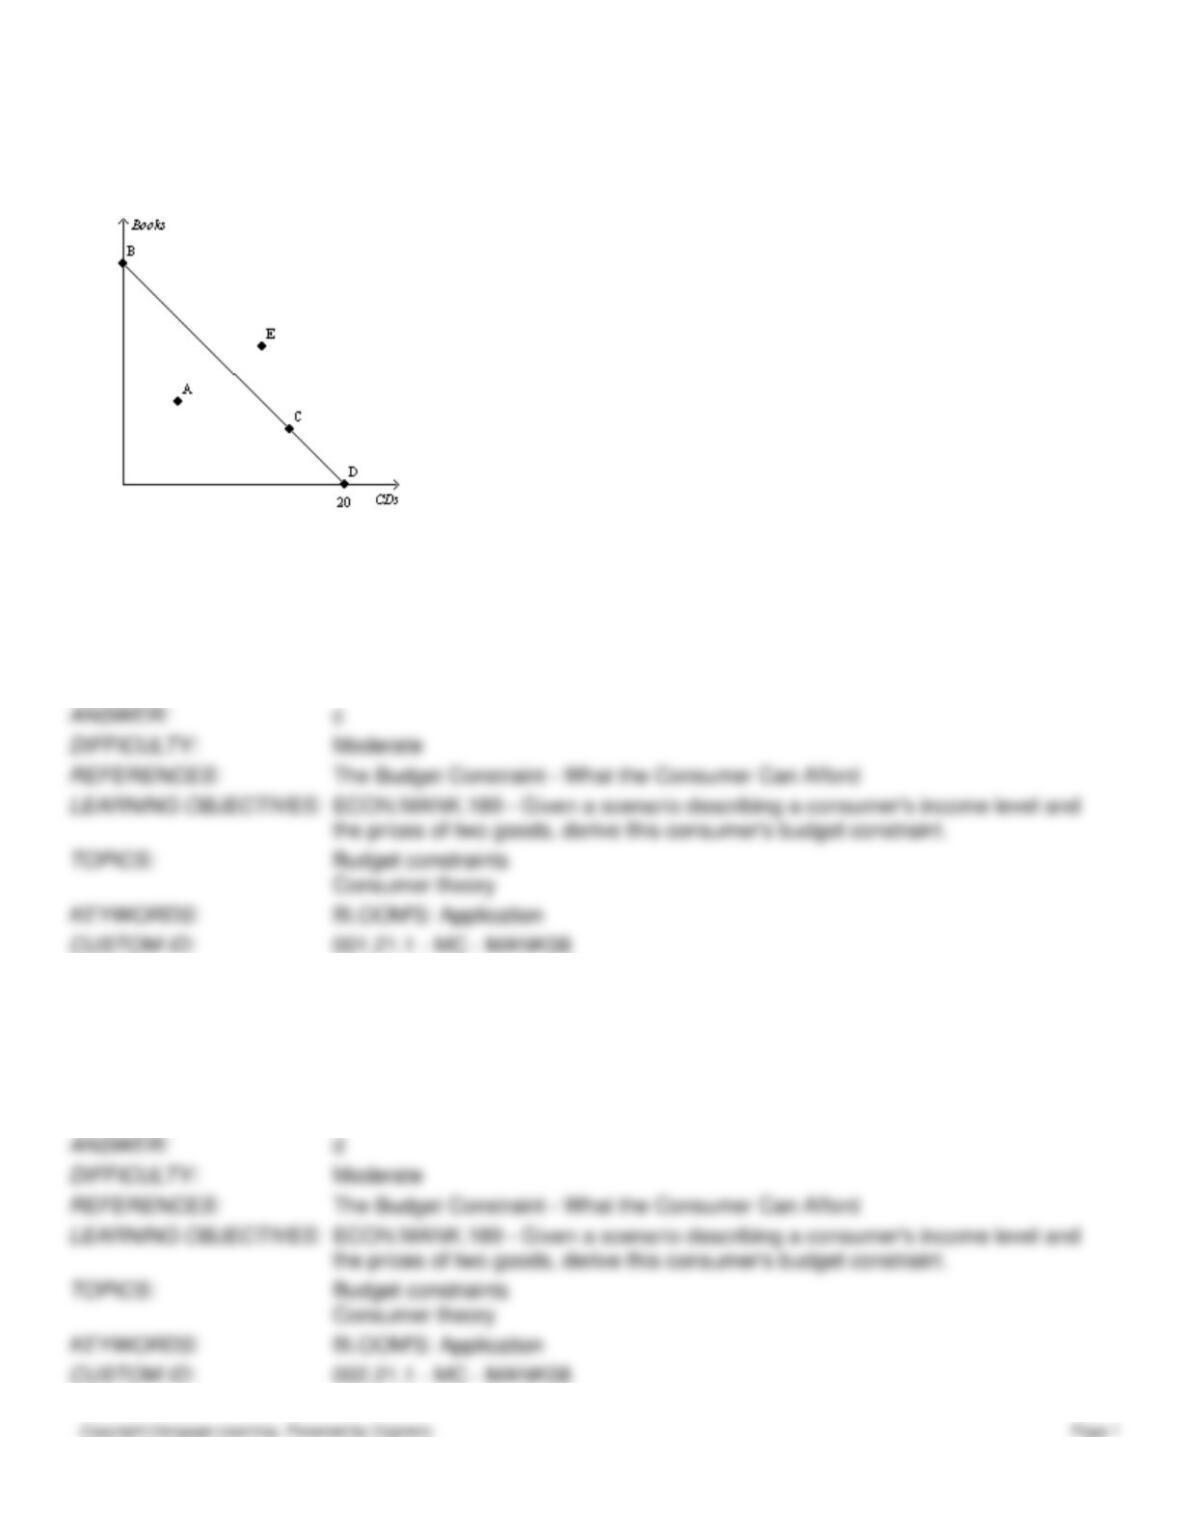
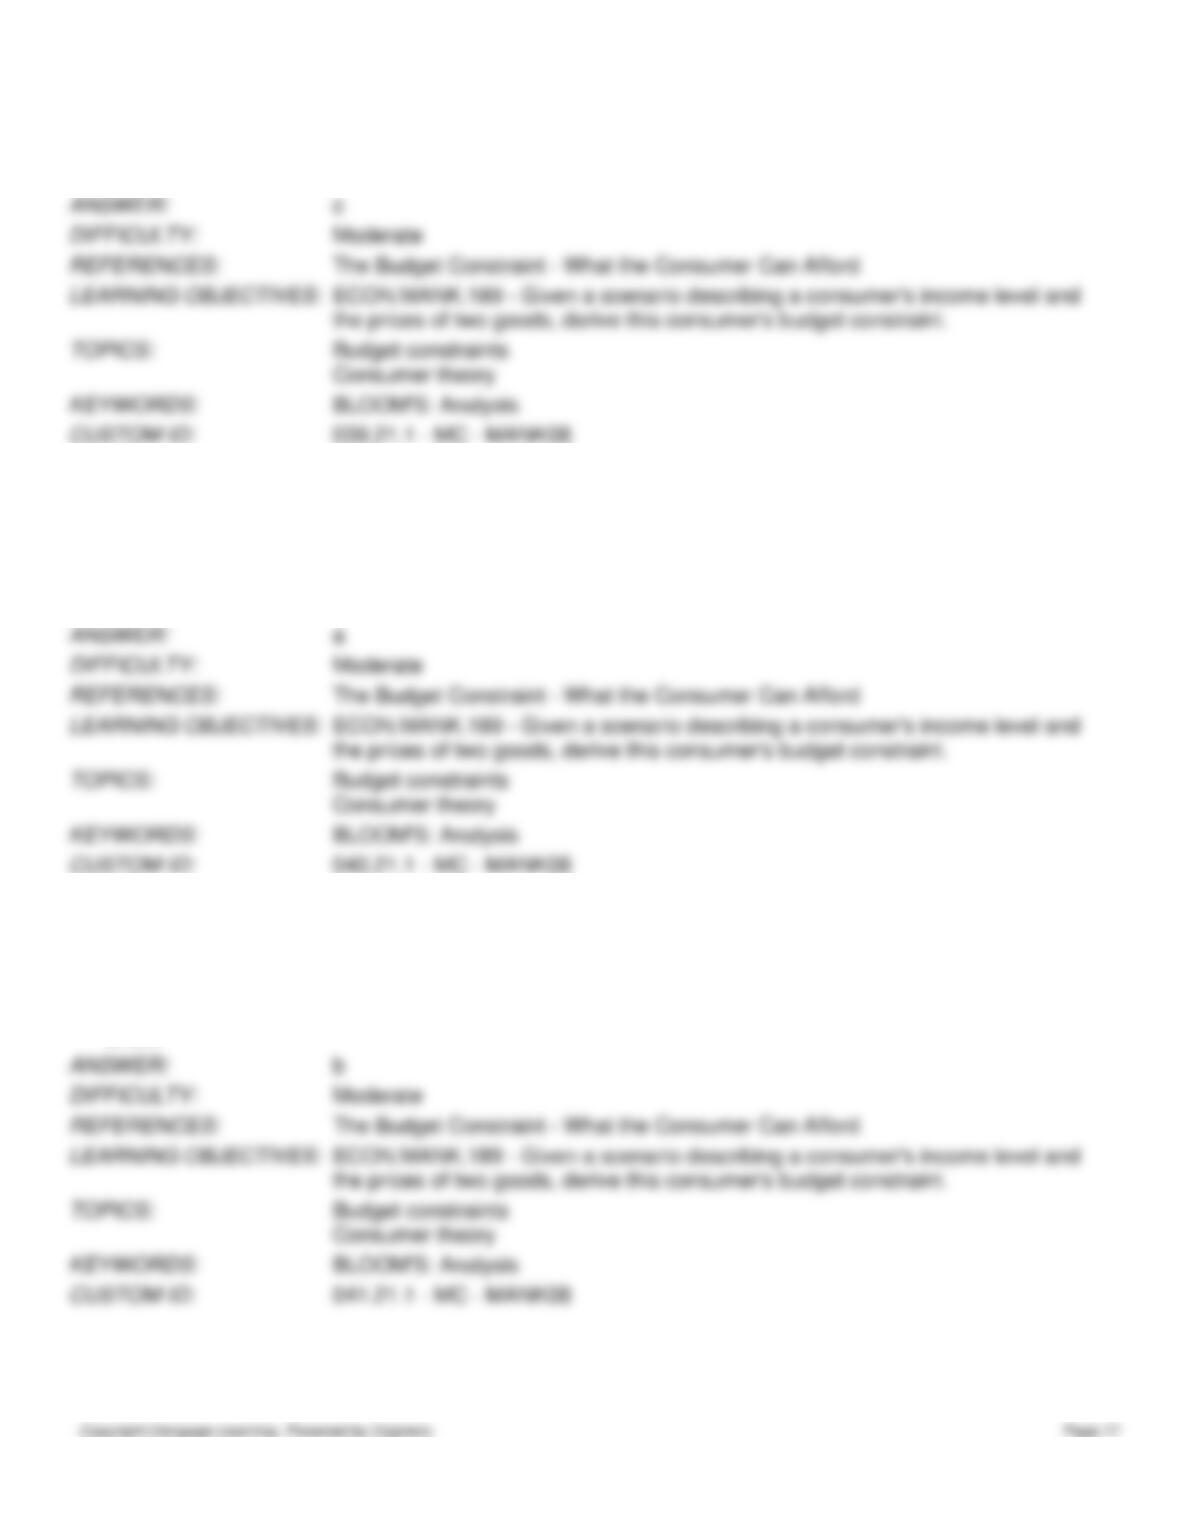
Figure 21-1 The downward-sloping line on the figure represents a consumer’s budget
constraint.
1. Refer to Figure 21-1. If the consumer’s income is $140, then what is the price of a CD?
a.
$3
b.
$5
c.
$7
d.
$9
2. Refer to Figure 21-1. If the price of a CD is $12, then the consumer’s income amounts to
a.
$140.
b.
$180.
c.
$210.
d.
$240.
3. Refer to Figure 21-1. A consumer who chooses to spend all of her income could be at which point(s) on the figure?
a.
A only
b.
E only
c.
B, C, or D only
d.
A, B, C, or D only
4. Refer to Figure 21-1. All of the points identified on the figure represent affordable consumption options with the
exception of
a.
A.
b.
E.
c.
A and E.
d.
None of the above are correct. All of the points identified on the figure are affordable.
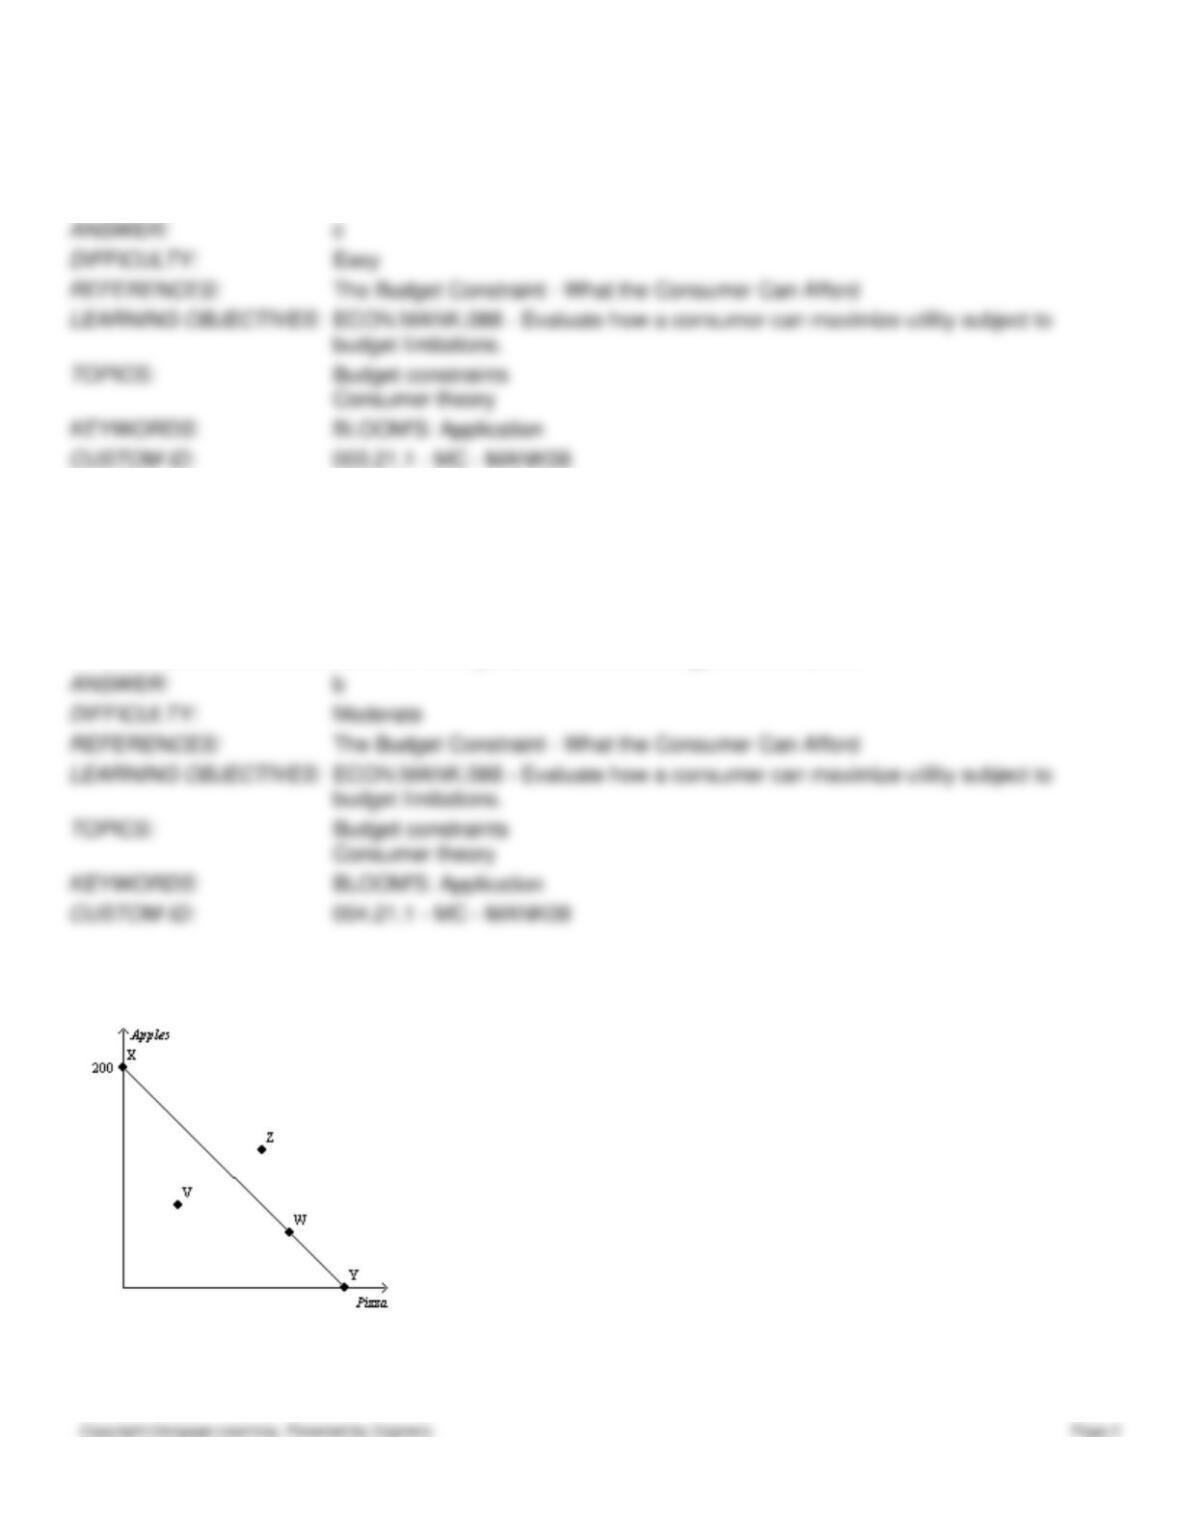
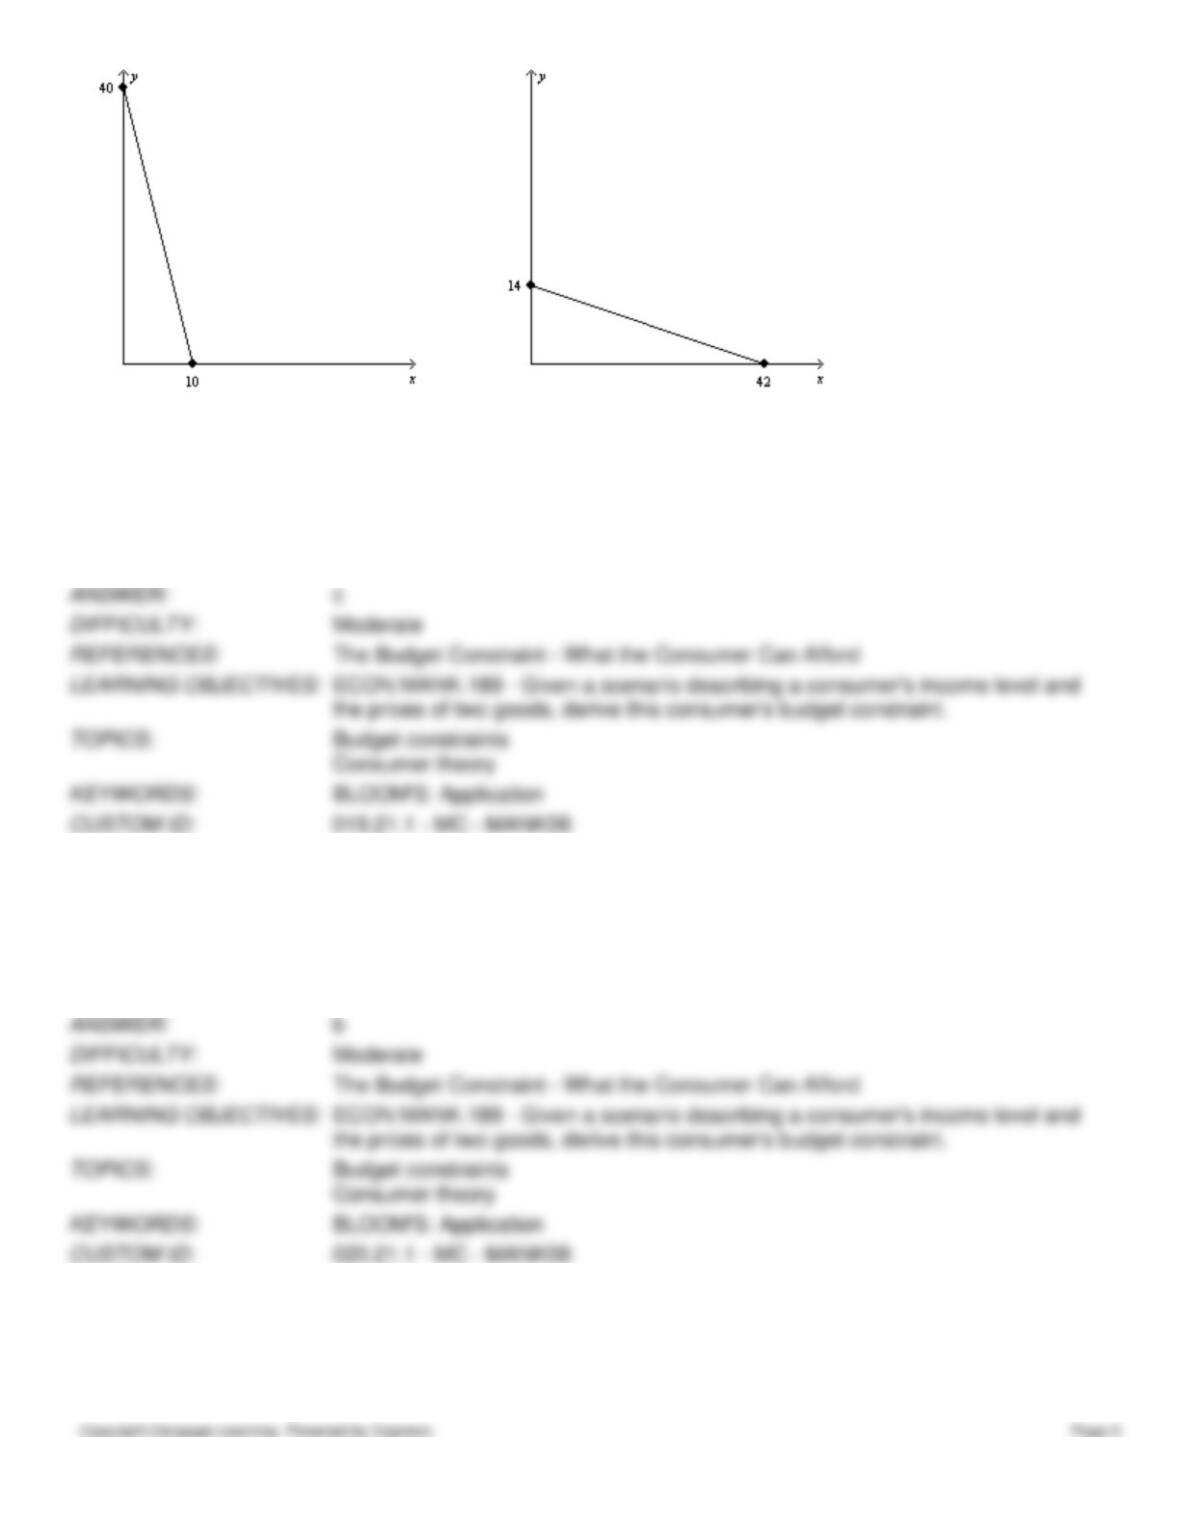
Figure 21-2 The downward-sloping line on the figure represents a consumer’s budget
constraint.
5. Refer to Figure 21-2. A consumer who chooses to spend all of her income could be at which point(s) on the figure?
a.
V only
b.
Z only
c.
V, W, X, or Y only
d.
W, X, or Y only
6. Refer to Figure 21-2. Which points are affordable?
a.
W, X, and Y only
b.
Z only
c.
V, W, X, and Y only
d.
V, W, X, Y, and Z
7. Refer to Figure 21-2. If the consumer’s income is $100, then what is the price of an apple?
a.
$0.50
b.
$0.75
c.
$1.00
d.
$1.25
8. Refer to Figure 21-2. Which of the following statements is not necessarily correct?
a.
Points W, X, and Y all cost the consumer the same amount of money.
b.
Point Z is unaffordable for the consumer given his budget constraint.
c.
Point V costs less than point Z.
d.
Points W, X, and Y give the consumer the same level of satisfaction.
9. Refer to Figure 21-2. Which of the following statements is correct?
a.
Points W, X, and Y all cost the consumer the same amount of money.
b.
Point V is unaffordable for the consumer given his budget constraint.
c.
Point Z costs less than point V.
d.
Points W, X, and Y give the consumer the same level of satisfaction.
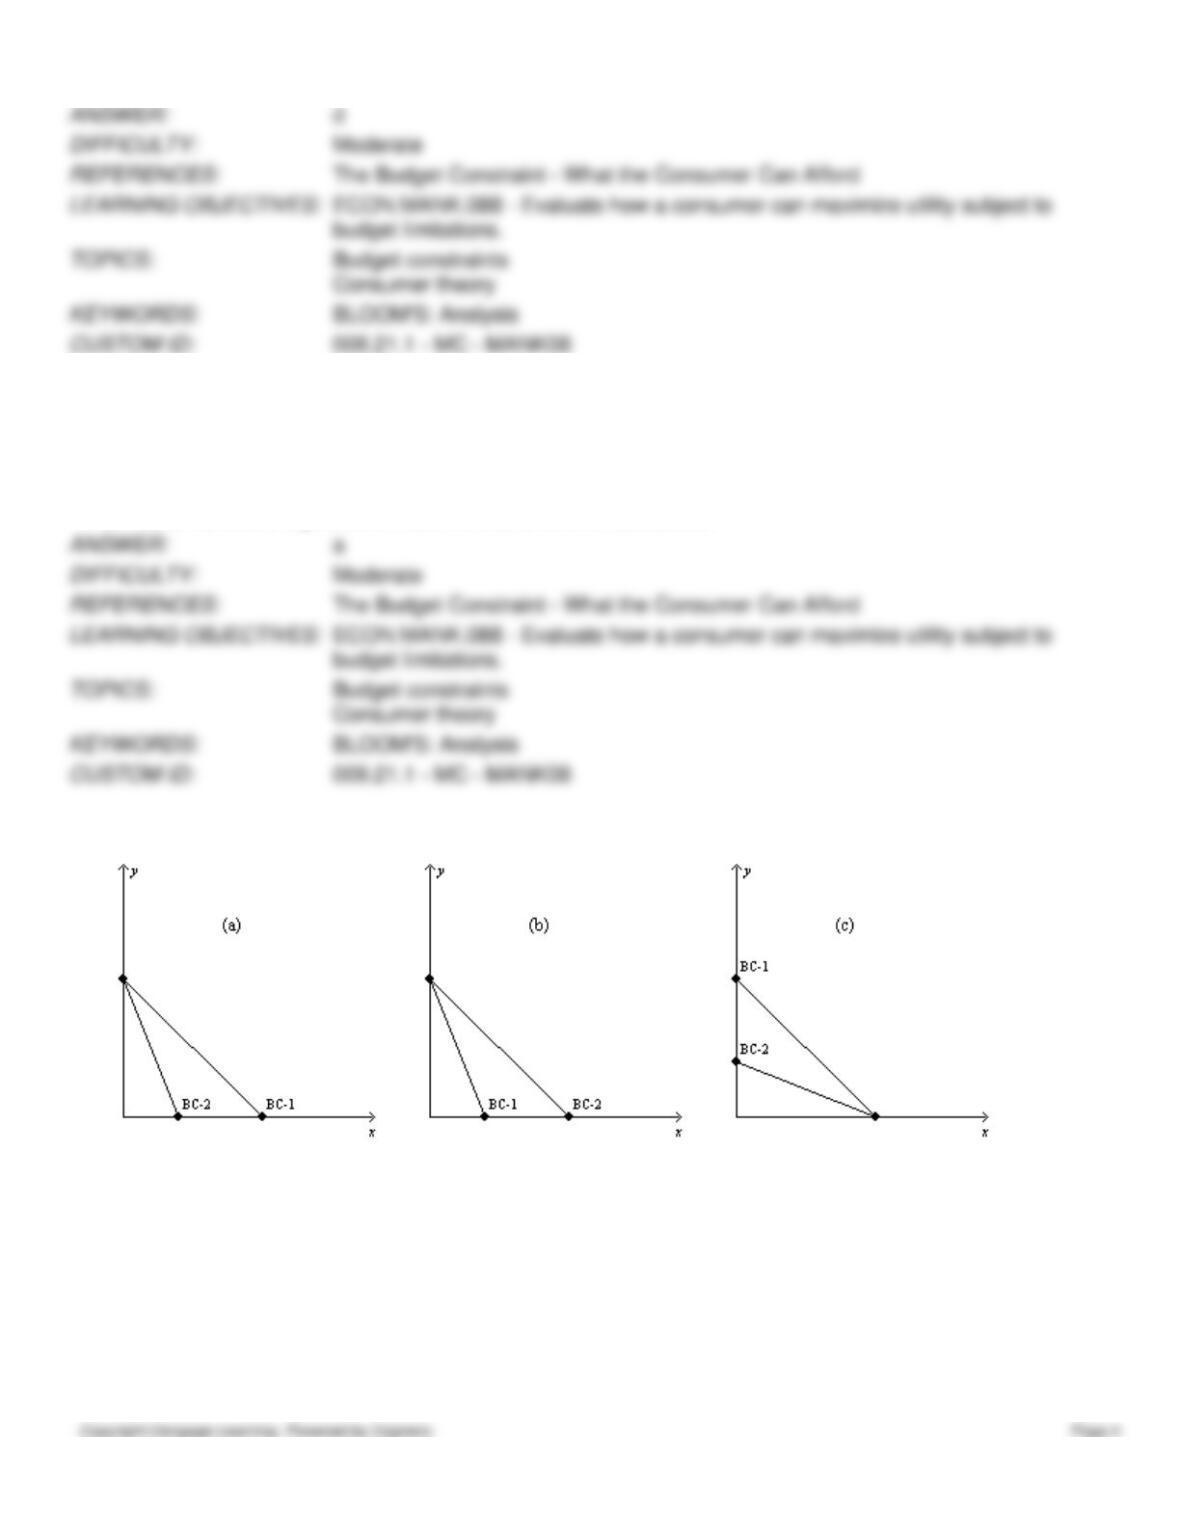
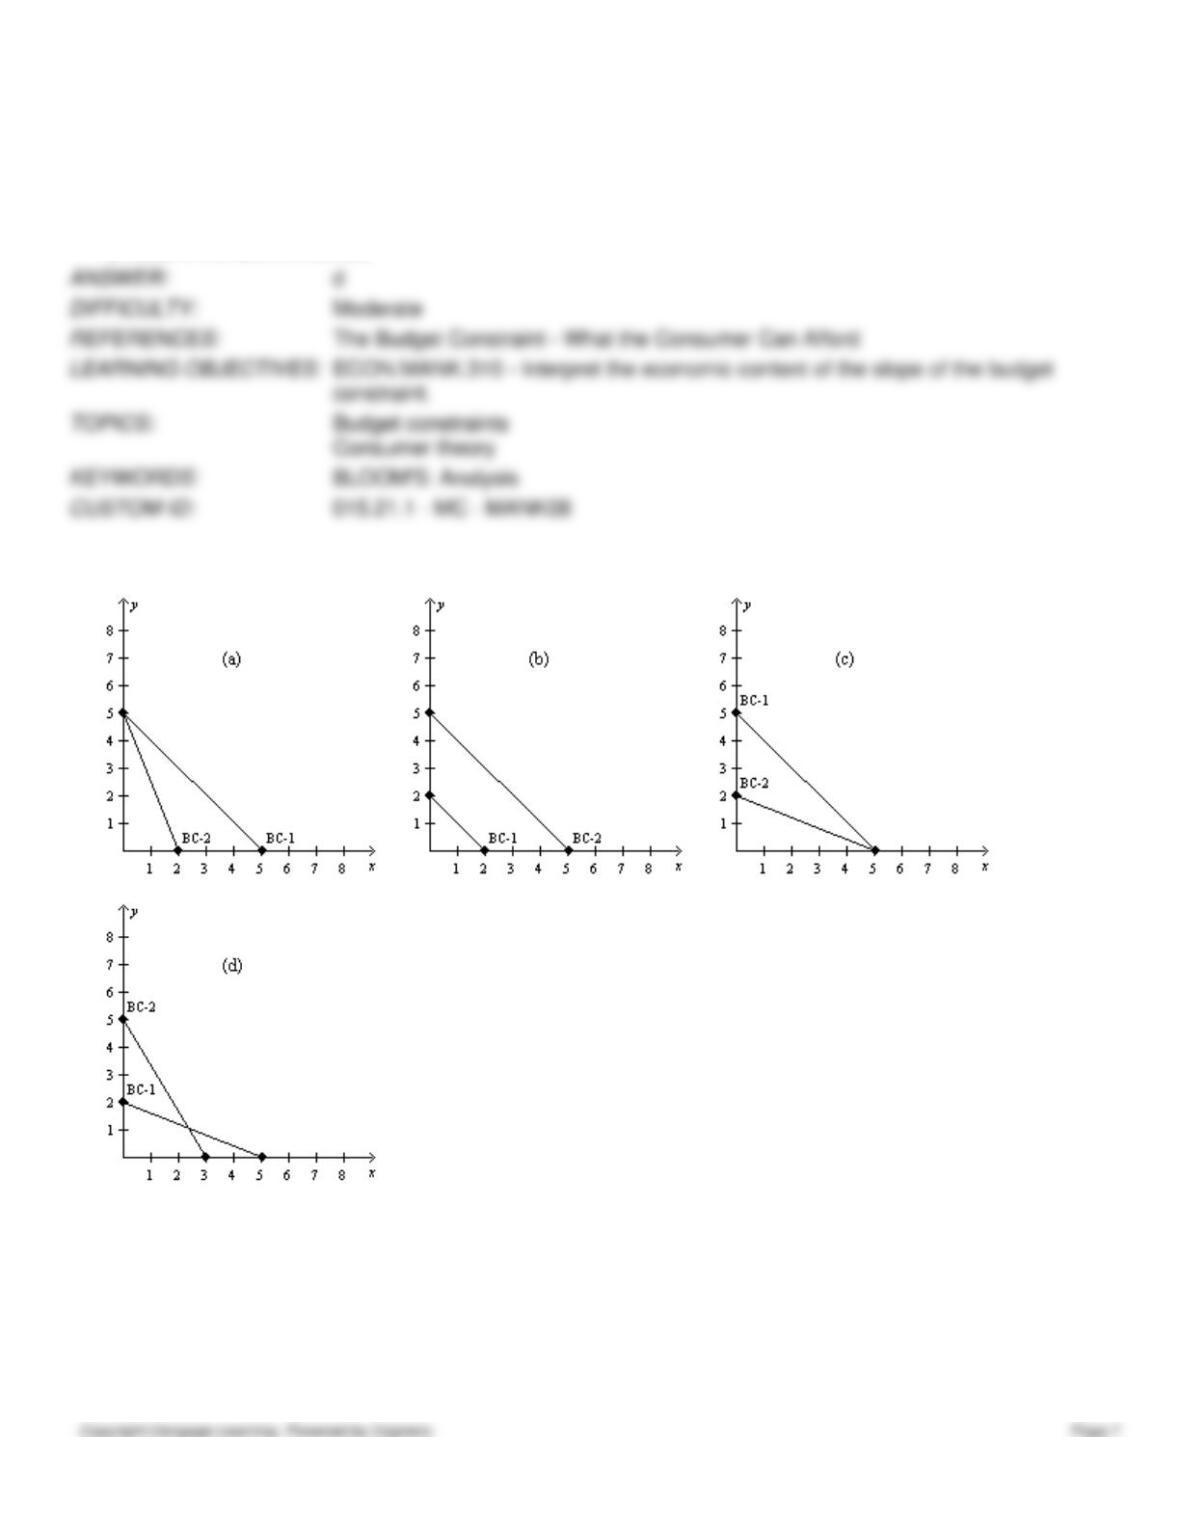
Figure 21-3
In each case, the budget constraint moves from BC-1 to BC–2.
10. Refer to Figure 21-3. Which of the graphs in the figure reflects a decrease in the price of good X only?
a.
graph a
b.
graph b
c.
graph c
d.
graph d
11. Refer to Figure 21-3. Which of the graphs in the figure reflects an increase in the price of good X only?
a.
graph a
b.
graph b
c.
graph c
d.
graph d
12. Refer to Figure 21-3. Which of the graphs in the figure reflects a decrease in the price of good Y only?
a.
graph a
b.
graph b
c.
graph c
d.
graph d
13. Refer to Figure 21-3. Which of the graphs in the figure reflects an increase in the price of good Y only?
a.
graph a
b.
graph b
c.
graph c
d.
graph d
14. Refer to Figure 21-3. Which of the graphs in the figure could reflect a simultaneous decrease in the prices of both
goods?
(i)
graph a
(ii)
graph b
(iii)
graph c
(iv)
graph d
a.
(i) only
b.
(iv) only
c.
(ii) or (iii) only
d.
None of the above is correct.
15. Refer to Figure 21-3. Which of the graphs in the figure could reflect a simultaneous decrease in the price of good X
and increase in the price of good Y?
(i)
graph a
(ii)
graph b
(iii)
graph c
(iv)
graph d
a.
(ii) only
b.
(iii) only
c.
(ii) or (iv) only
d.
None of the above is correct.
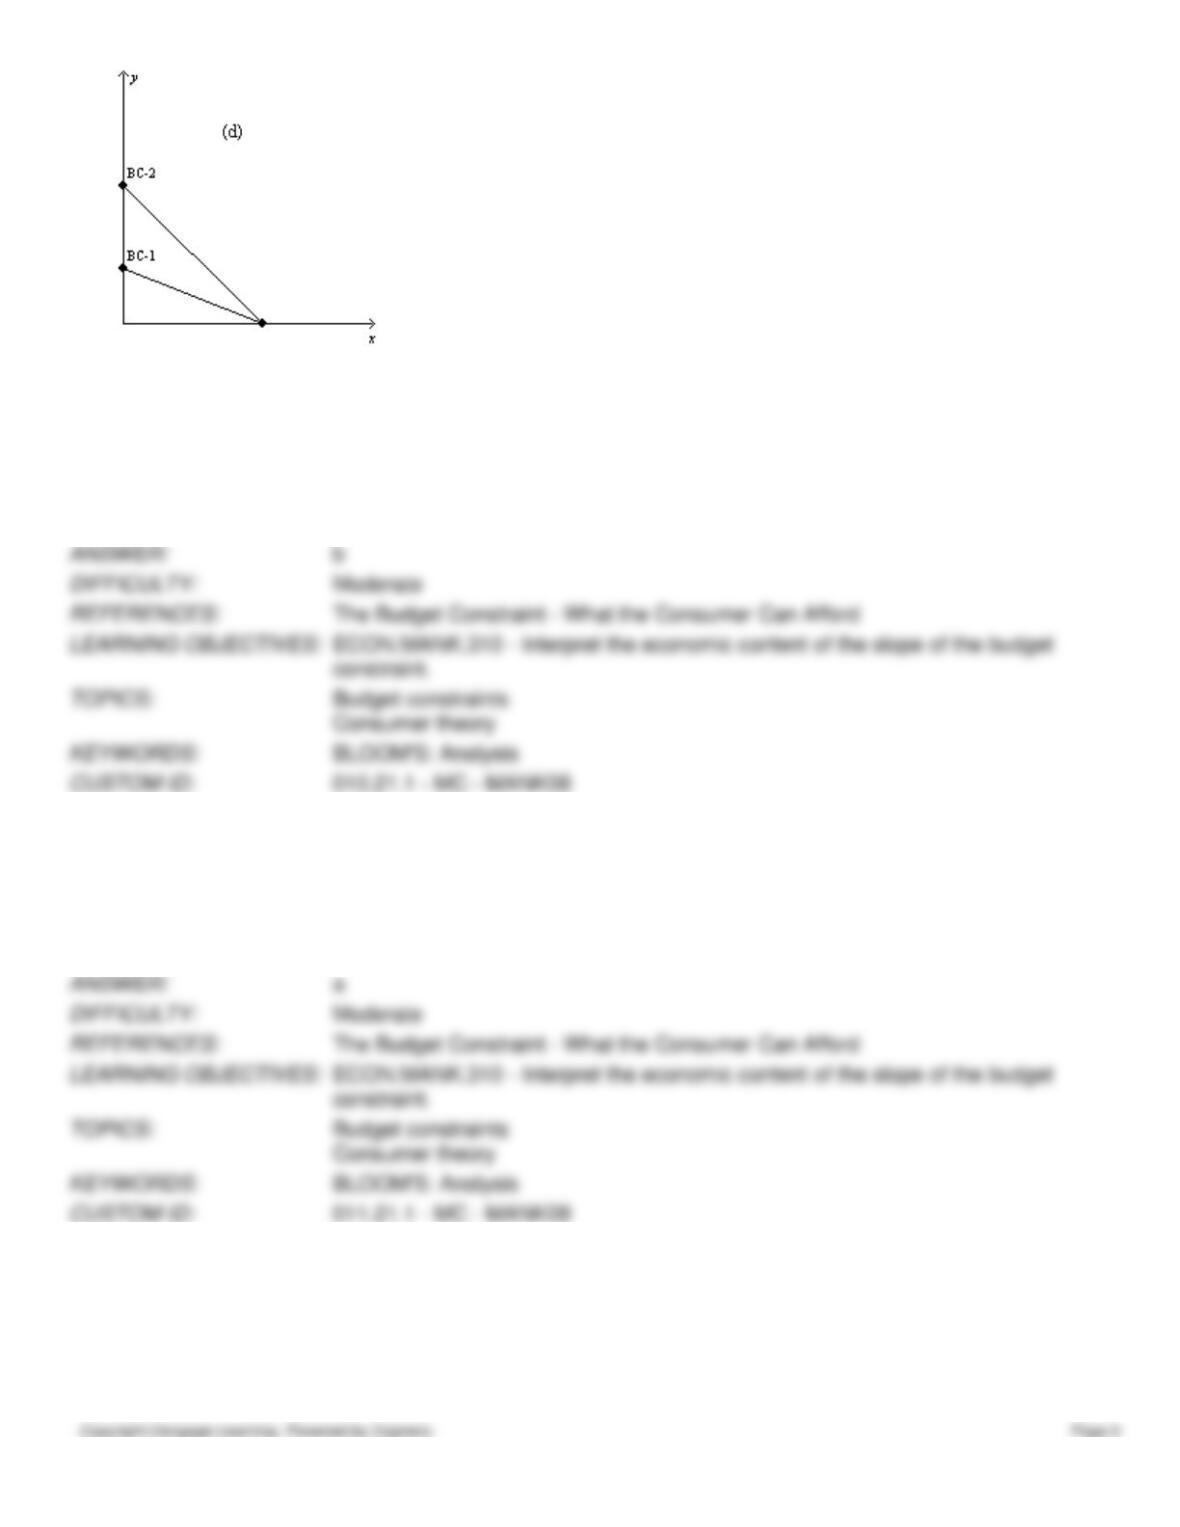
Figure 21-4
In each case, the budget constraint moves from BC-1 to BC–2.
16. Refer to Figure 21-4. Which of the graphs in the figure could reflect a simultaneous increase in the price of good X
and decrease in the price of good Y?
a.
graph a
b.
graph b
c.
graph c
d.
graph d
17. Refer to Figure 21-4. Which of the graphs in the figure could reflect an increase in income?
a.
graph a
b.
graph b
c.
graph d
d.
None of the above is correct.
18. Refer to Figure 21-4. Which of the graphs in the figure could reflect a decrease in income?
a.
graph a
b.
graph b
c.
graph d
d.
None of the above is correct.
Figure 21-5
(a)
(b)
19. Refer to Figure 21-5. In graph (a), if income is equal to $200, then the price of good X is
a.
$12.
b.
$16.
c.
$20.
d.
$24.
20. Refer to Figure 21-5. In graph (a), if income is equal to $200, then the price of good Y is
a.
$3.
b.
$5.
c.
$7.
d.
$10.
21. Refer to Figure 21-5. In graph (a), what is the price of good X relative to the price of good Y (i.e., PX/PY)?
a.
1/4
b.
1/3
c.
3
d.
4
22. Refer to Figure 21-5. In graph (a), what is the price of good Y relative to the price of good X (i.e., Py/Px)?
a.
1/4
b.
1/3
c.
3
d.
4
23. Refer to Figure 21-5. In graph (b), if income is equal to $420, then the price of good X is
a.
$1.
b.
$3.
c.
$10.
d.
$30.
24. Refer to Figure 21-5. In graph (b), if income is equal to $420, then the price of good Y is
a.
$1.
b.
$3.
c.
$10.
d.
$30.
25. Refer to Figure 21-5. In graph (b), what is the price of good X relative to the price of good Y (i.e., Px/Py)?
a.
1/3
b.
1
c.
3
d.
10
26. Refer to Figure 21-5. In graph (b), what is the price of good Y relative to the price of good X (i.e., PY/PX)?
a.
1/3
b.
1
c.
3
d.
10
27. Refer to Figure 21-5. Assume that a consumer faces the budget constraint shown in graph (a) in January and the
budget constraint shown in graph (b) in February. If the consumer’s income has remained constant, then what has
happened to prices between January and February?
a.
The price of X has fallen, but there could not have been a change in the price of Y.
b.
The price of Y has fallen, but there could not have been a change in the price of X.
c.
The price of X has fallen, and the price of Y has risen.
d.
The price of Y has fallen, and the price of X has risen.
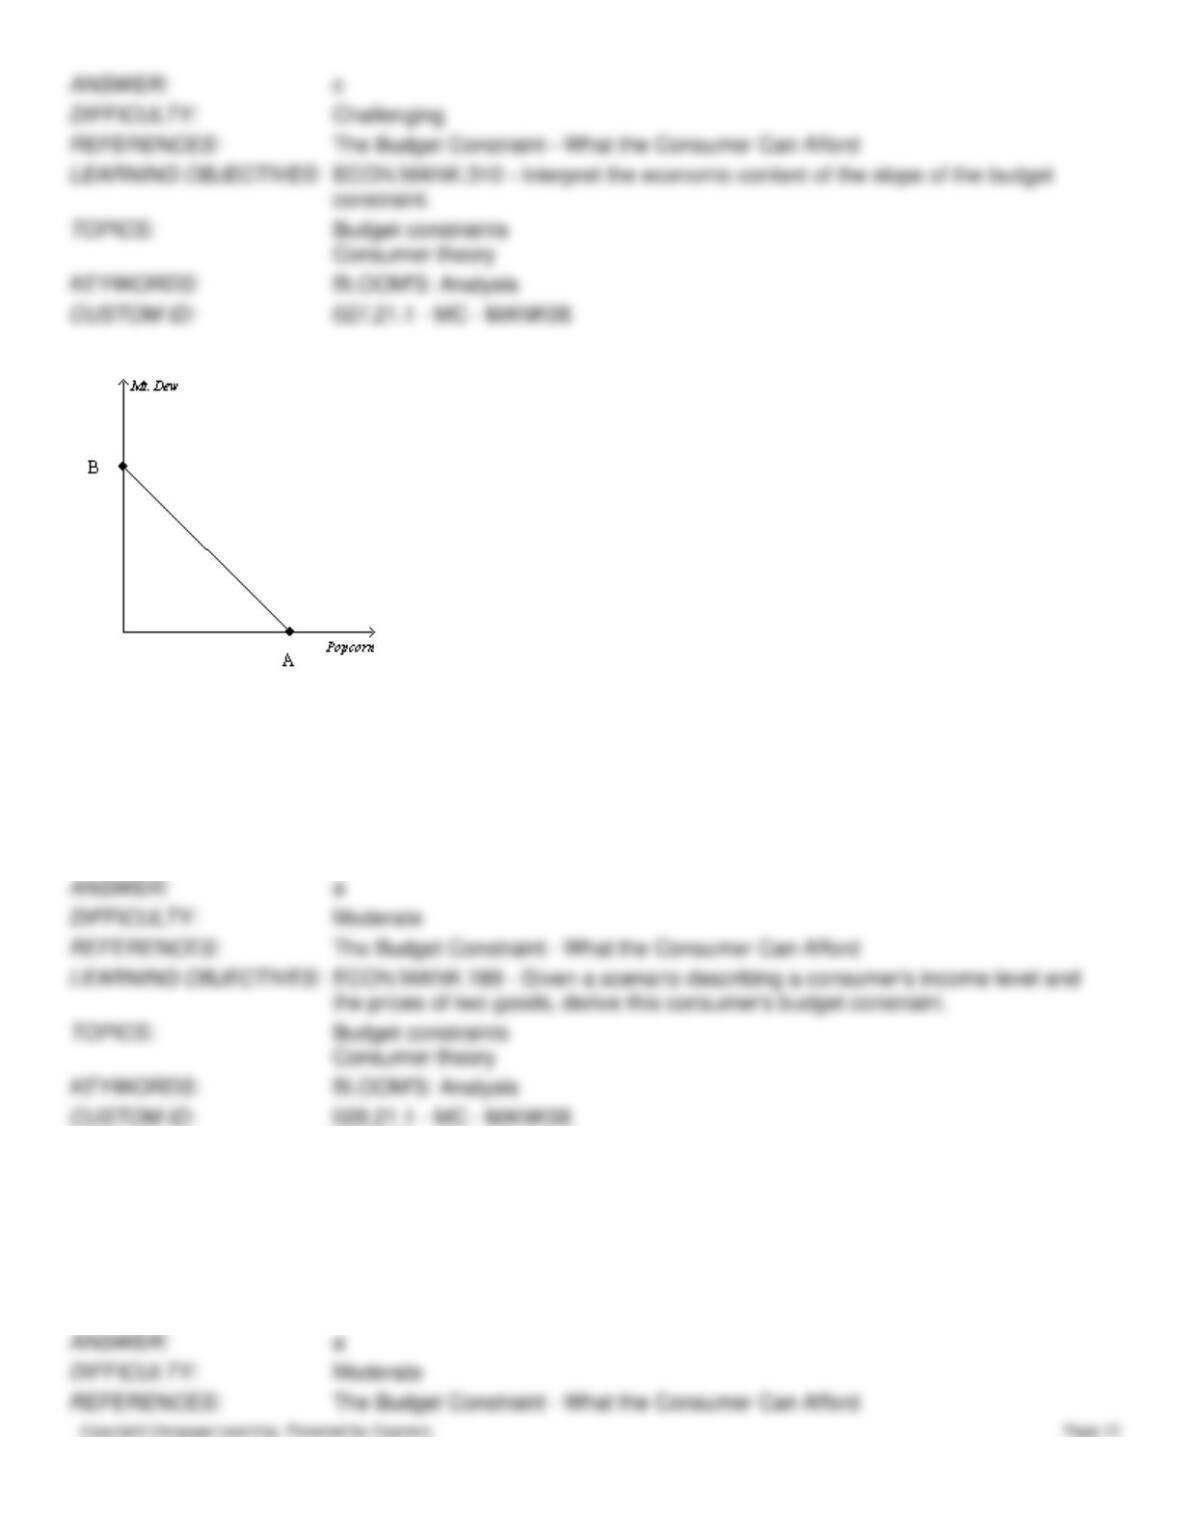
Figure 21-6
28. Refer to Figure 21–6. Suppose a consumer has $100 in income, the price of popcorn is $2, and the value of B is 100.
What is the price of Mt. Dew?
a.
$1
b.
$2
c.
$5
d.
$100
29. Refer to Figure 21–6. Suppose a consumer has $100 in income, the price of Mt. Dew is $2, and the value of A is 200.
What is the price of popcorn?
a.
$0.50
b.
$1
c.
$2
d.
$4
30. Refer to Figure 21–6. Suppose a consumer has $200 in income, the price of popcorn is $1, and the price of Mt. Dew
is $2. What is the value of A?
a.
200
b.
100
c.
50
d.
25
31. Refer to Figure 21–6. Suppose a consumer has $200 in income, the price of popcorn is $1, and the price of Mt. Dew
is $2. What is the value of B?
a.
200
b.
100
c.
50
d.
25
32. Refer to Figure 21–6. Suppose the price of popcorn is $2, the price of Mt. Dew is $4, the value of A is 30, and the
value of B is 15. How much income does the consumer have?
a.
$120
b.
$80
c.
$60
d.
$30
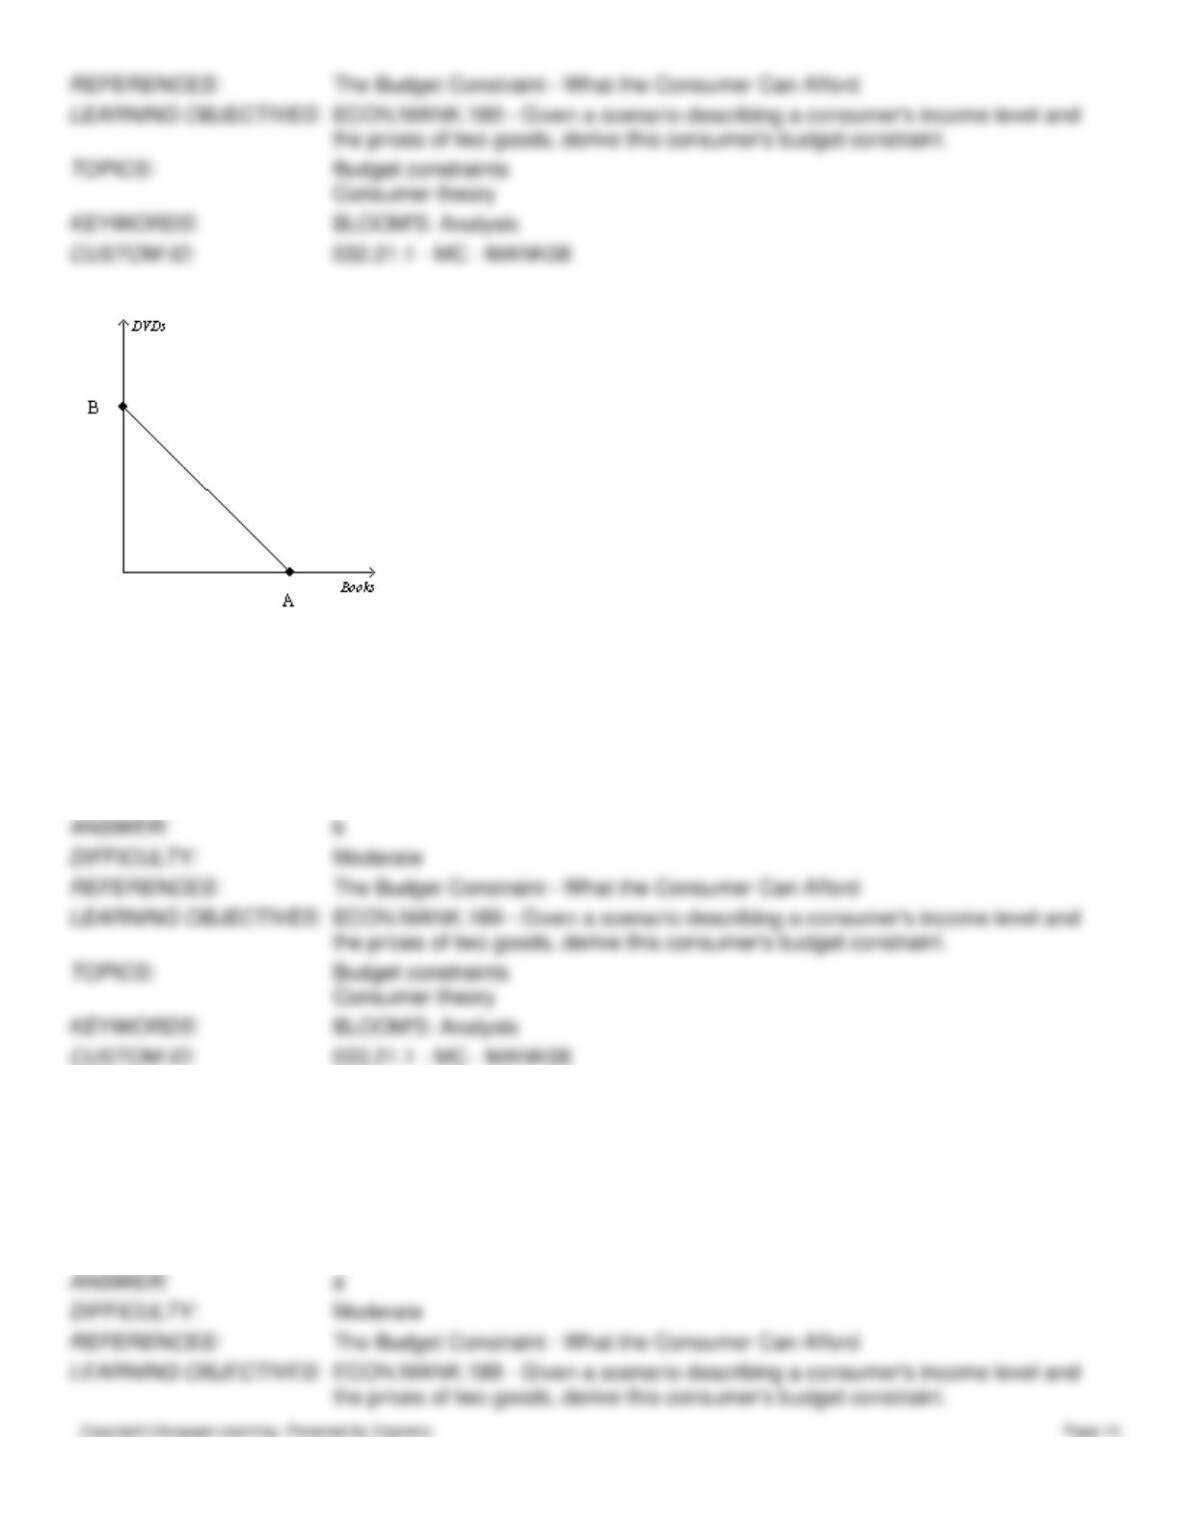
Figure 21-7
33. Refer to Figure 21–7. Suppose a consumer has $500 in income, the price of a book is $10, and the value of B is 50.
What is the price of a DVD?
a.
$5
b.
$10
c.
$50
d.
$100
34. Refer to Figure 21–7. Suppose a consumer has $200 in income, the price of a book is $5, and the price of a DVD is
$10. What is the value of A?
a.
40
b.
20
c.
10
d.
2
35. Refer to Figure 21–7. Suppose a consumer has $200 in income, the price of a book is $5, and the price of a DVD is
$10. What is the value of B?
a.
40
b.
20
c.
10
d.
2
36. Refer to Figure 21–7. Suppose the price of a book is $15, the price of a DVD is $10, the value of A is 5, and the value
of B is 7.5. How much income does the consumer have?
a.
$150
b.
$100
c.
$75
d.
$37.50
Figure 21-8
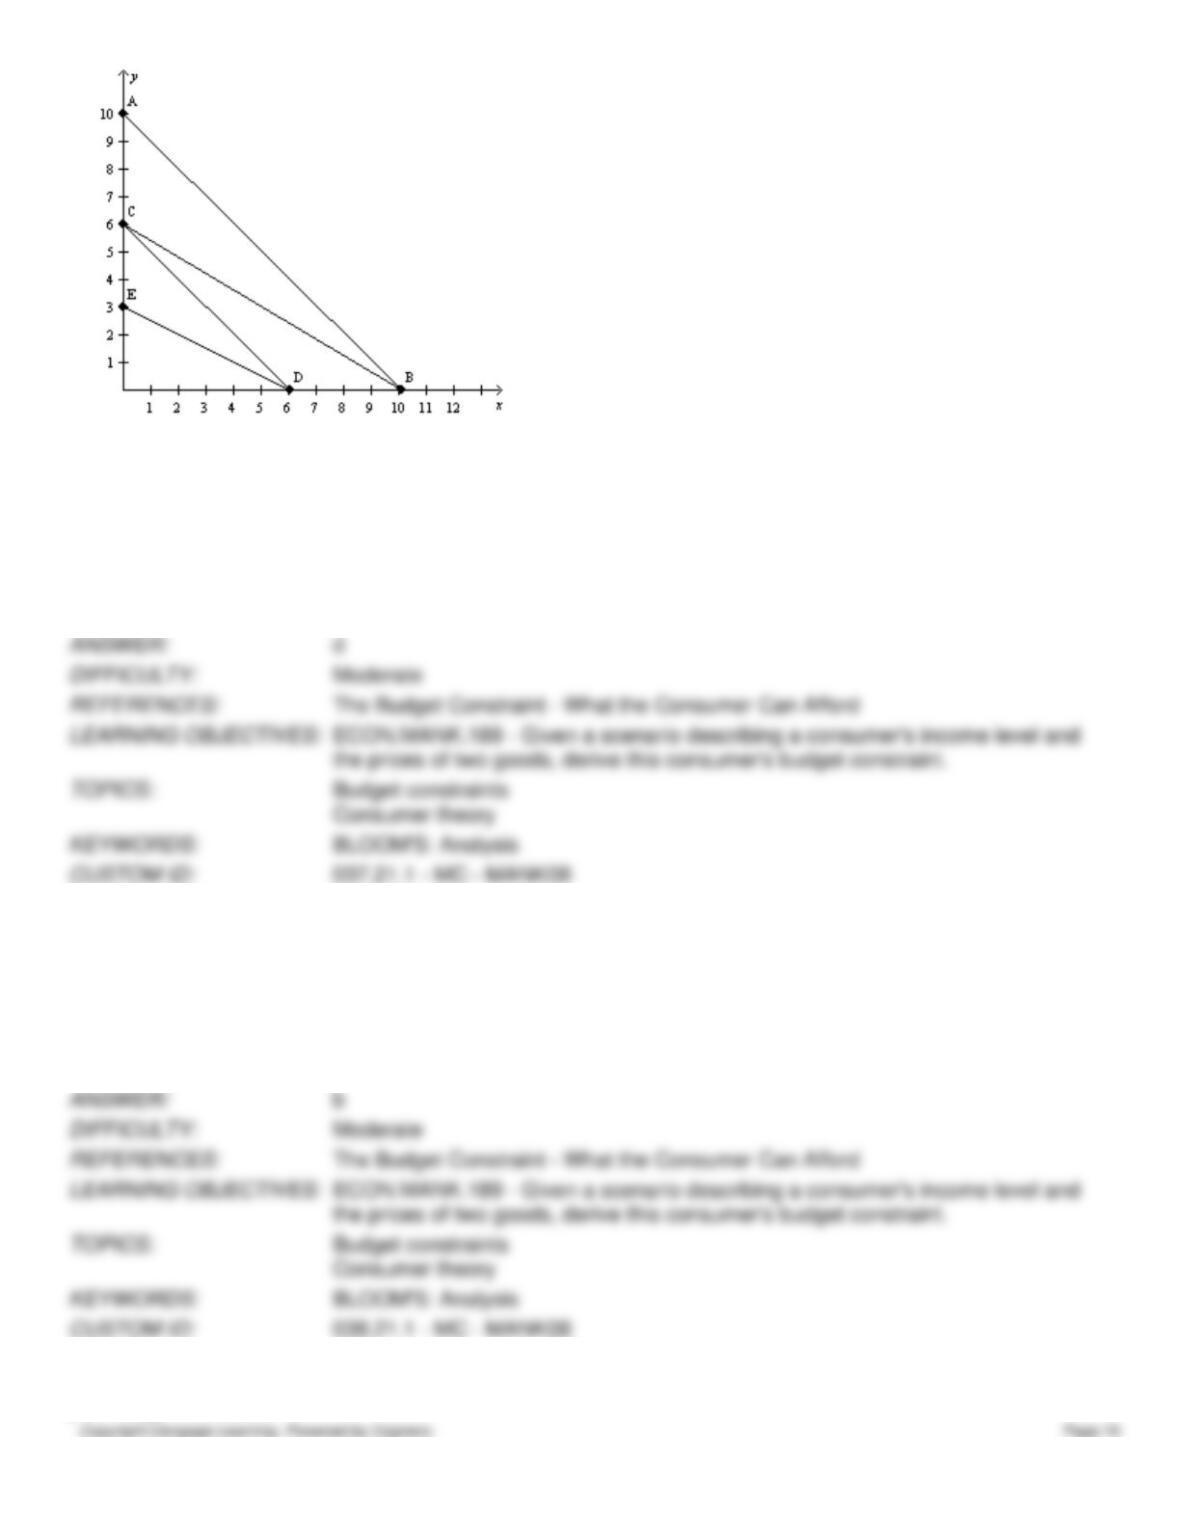
37. Refer to Figure 21–8. You have $36 to spend on good X and good Y. If good X costs $6 and good Y costs $12, your
budget constraint is
a.
AB.
b.
BC.
c.
CD.
d.
DE.
38. Refer to Figure 21–8. You have $300 to spend on good X and good Y. If good X costs $30 and good Y costs $50,
your budget constraint is
a.
AB.
b.
BC.
c.
CD.
d.
DE.
39. Refer to Figure 21–8. You have $600 to spend on good X and good Y. If good X costs $100 and good Y costs $100,
your budget constraint is
a.
AB.
b.
BC.
c.
CD.
d.
DE.
40. Refer to Figure 21–8. If the price of good X is $5, and your budget constraint is DE, what is the price of good Y?
a.
$10
b.
$5
c.
$2.50
d.
$1.67
41. Refer to Figure 21–8. If the price of good X is $3, and your budget constraint is BC, what is the price of good Y?
a.
$3.33
b.
$5
c.
$15
d.
$30
Figure 21-9
42. Refer to Figure 21–9. If the consumer has $600 in income, what is the price of good X?
a.
$20
b.
$6
c.
$3
d.
$0.33
43. Refer to Figure 21–9. If the consumer has $600 in income, what is the price of good Y?
a.
$20
b.
$6
c.
$3
d.
$0.33
44. Refer to Figure 21–9. If the price of good Y is $5, what is the price of good X?
a.
$500
b.
$150
c.
$16.67
d.
$1.50
45. Refer to Figure 21–9. If the price of good X is $15, what is the price of good Y?
a.
$1,500
b.
$50
c.
$5
d.
$0.50
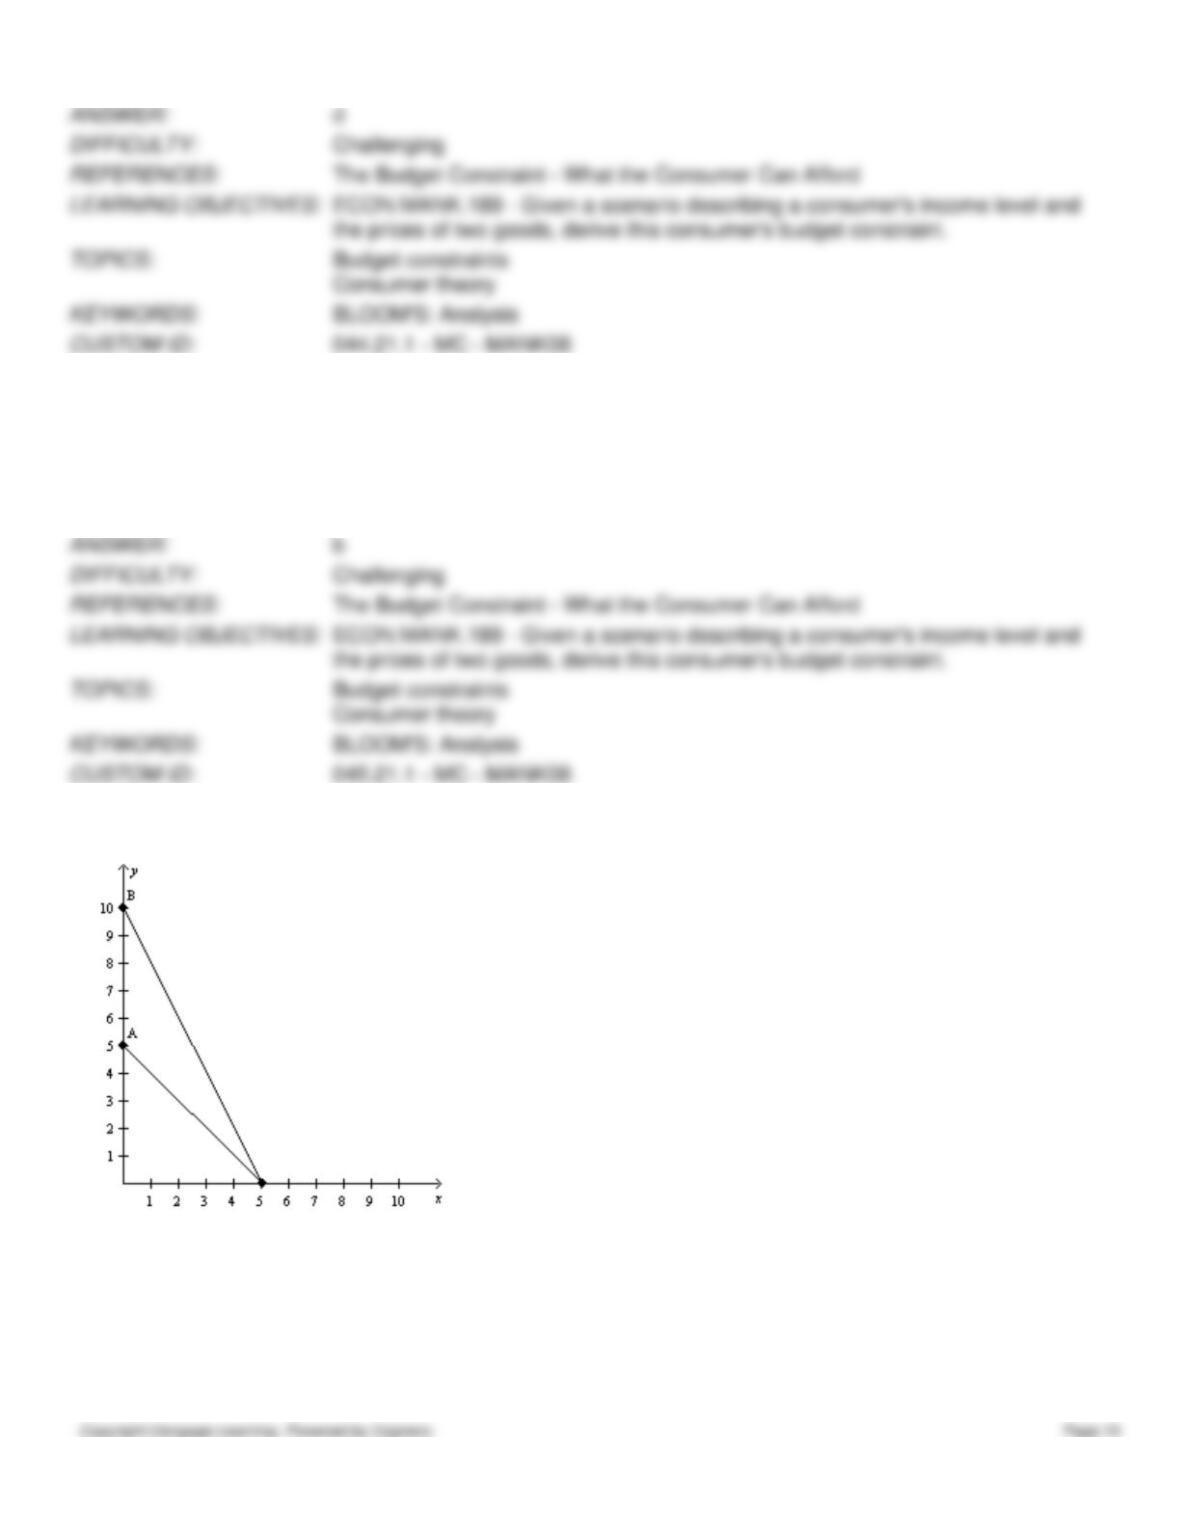
46. The following diagram shows two budget lines: A and B.
Which of the following could explain the change in the budget line from A to B?
a.
a decrease in the price of X
b.
an increase in the price of Y
c.
a decrease in the price of Y
d.
More than one of the above could explain this change.
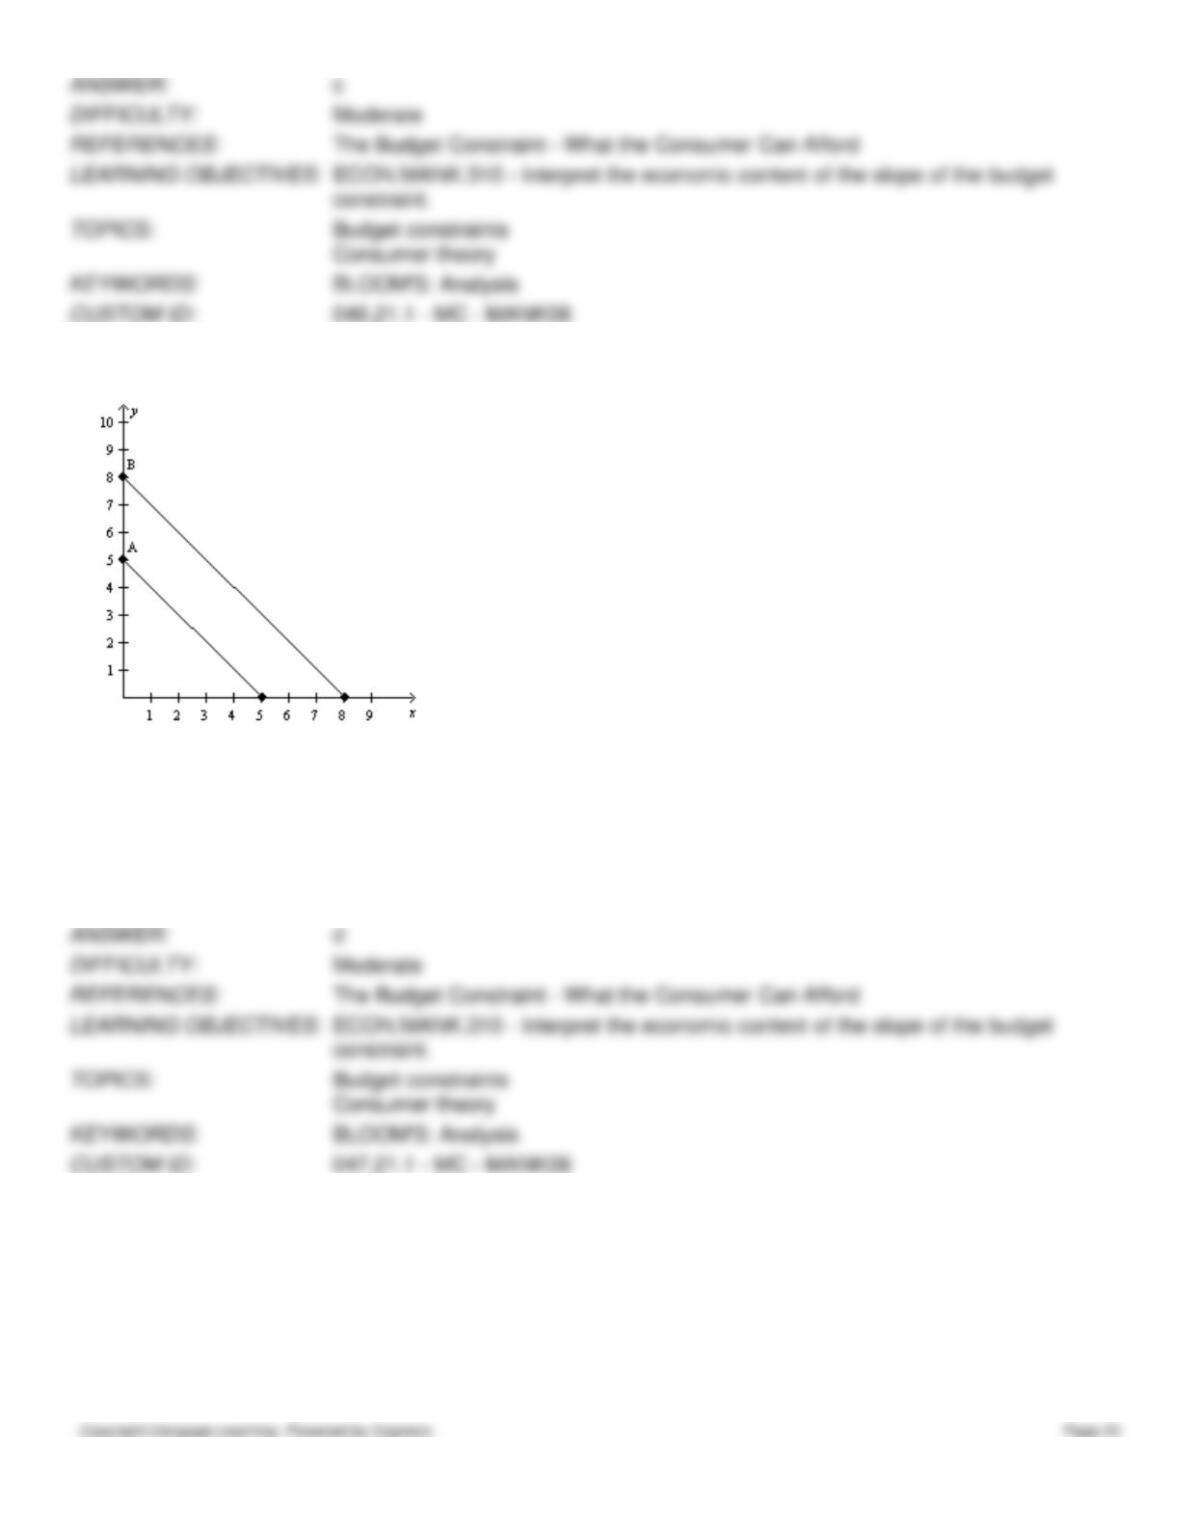
47. The following diagram shows two budget lines: A and B.
Which of the following could explain the change in the budget line from A to B?
a.
a simultaneous decrease in the price of X and the price of Y
b.
an increase in income
c.
a decrease in income and a decrease in the price of Y
d.
Both a and b are correct.
48. The following diagram shows two budget lines: A and B.