Chapter 20 – Income Inequality and Poverty
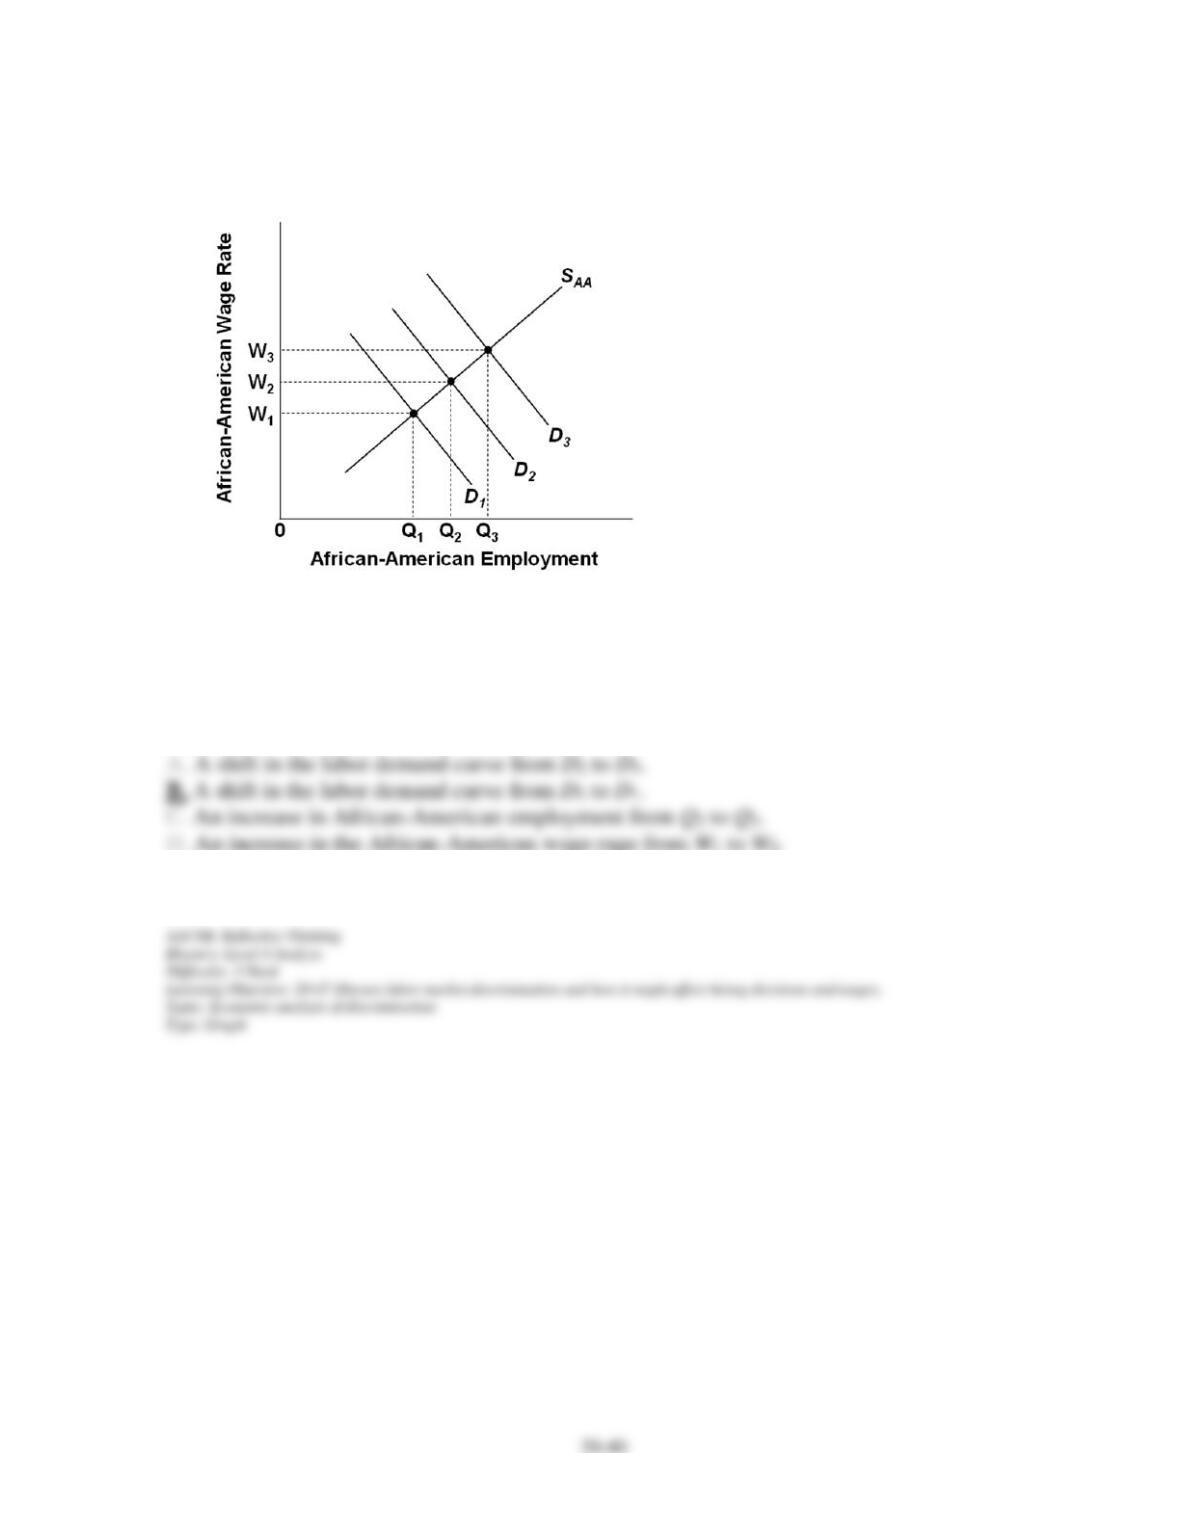
108. Refer to the above diagram. Which of the following would be consistent with an increase
in racial prejudice against African-Americans and thus an increase in the discrimination
coefficients of employers, taken as a group?
Chapter 20 – Income Inequality and Poverty
109. Refer to the above diagram. Which of the following would be consistent with a decrease
in racial prejudice against African-Americans and thus a decrease in the discrimination
coefficients of employers, taken as a group?
110. In the taste-for-discrimination model:
111. An implication of the taste-for-discrimination model is that:
Chapter 20 – Income Inequality and Poverty
112. An employer is prejudiced, prefers to hire white rather than Hispanic workers, and is
willing to pay higher wages to obtain white workers. This illustrates:
113. Statistical discrimination refers to:
114. Statistical discrimination:
115. Insurance companies require male drivers under age 25 to pay higher insurance rates
than female drivers under age 25. Craig Raymond, however, is a safer driver than the average
female driver under age 25. Craig’s higher insurance rate reflects:
116. Statistical discrimination:
117. Which of the following is an example of statistical discrimination?
Chapter 20 – Income Inequality and Poverty
118. Suppose Gigantic Health Cooperative doesn’t hire Mandy Morrison solely because she is
a graduate of a particular foreign medical school, which is not known for the high quality of
its graduates. Yet, Mandy is actually more qualified than the average graduate of American
medical schools. This is an example of:
119. Suppose Copernicus Corporation hires Damon Danielson rather than Elmer Ellison,
simply because Damon is a graduate of an Ivy League school while Elmer is a graduate of a
small public university. Elmer is actually more qualified than Damon. This is an example of:
120. A particular woman is denied on-the-job training because women on average are more
likely to drop out of the workforce than men. This illustrates:
Chapter 20 – Income Inequality and Poverty
121. The crowding model of discrimination suggests that:
122. The crowding of women and minorities into a restricted number of occupations:
123. Minority workers are underrepresented and have less access to certain high paying
occupations. This illustrates:
Chapter 20 – Income Inequality and Poverty
124. The crowding model is primarily concerned with explaining:
Chapter 20 – Income Inequality and Poverty
125. Refer to the above diagram and list of assumptions. Under these circumstances 9 million
women will be employed in occupation Z:
126. Refer to the above diagram and list of assumptions. With women confined to occupation
Z and men free to choose occupations, how will this affect the wages paid?
127. Refer to the above diagram and list of assumptions. If discrimination is ended:
Chapter 20 – Income Inequality and Poverty
128. Refer to the above diagram and list of assumptions. If discrimination is ended, women:
129. Refer to the above diagram and list of assumptions. The elimination of gender
discrimination:
130. As applied to gender discrimination, the crowding model of occupational segregation:
Chapter 20 – Income Inequality and Poverty
131. Discrimination creates a:
132. Discrimination:
133. Economic discrimination puts the economy inside its production possibilities curve
because discrimination:
Chapter 20 – Income Inequality and Poverty
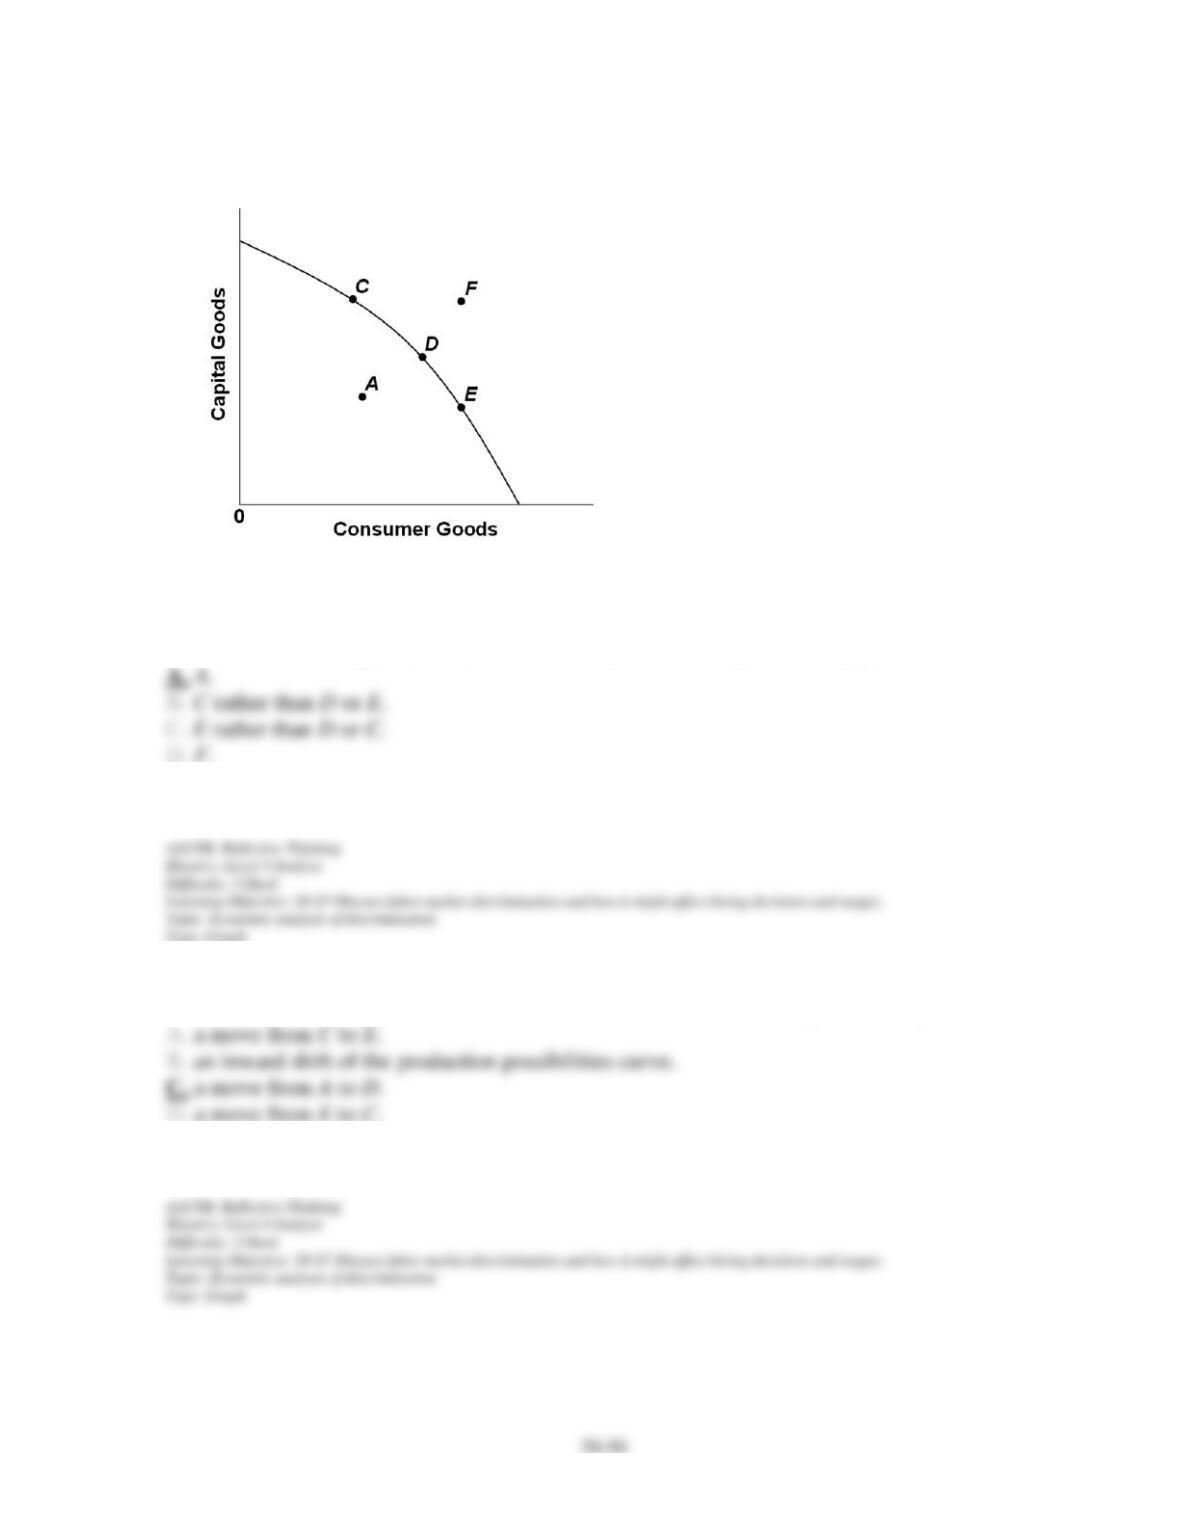
134. In the above diagram, economic discrimination is best represented by point:
135. In the above diagram, the elimination of discrimination is best represented by:
Chapter 20 – Income Inequality and Poverty
136. (Consider This) According to economists Krueger and Perri:
137. (Consider This) According to The Economist magazine, growing income inequality is
less of a concern because:
138. (Consider This) In “Slicing the Pizza” the shrinkage of the pizza refers to the:
Chapter 20 – Income Inequality and Poverty
139. (Consider This) The main focus of the vignette “Slicing the Pizza” is the:
140. (Last Word) Between 1995 and 2007 in the United States:
141. (Last Word) In 2007, the wealthiest 1 percent of U.S. households held ____ percent of
U.S. household wealth.
Chapter 20 – Income Inequality and Poverty
142. Government transfer programs result in a U.S. Lorenz Curve that is closer to the
diagonal line than would be the case without the programs.
143. The closer the Lorenz curve is to the diagonal, the greater is the degree of income
inequality.
144. The standard data on income distribution do not include the value of noncash transfers as
income.
145. A curve showing the quintile distribution of a nation’s income is called the Gini Curve.
Chapter 20 – Income Inequality and Poverty
146. In the United States since 1970, the poor have gotten poorer and the rich have gotten
richer in both relative and absolute terms.
147. The top 20 percent of U.S. income earners receive nearly 80 percent of total U.S.
income.
148. Currently over 90 percent of all workers in the United States are covered by Social
Security.
149. Unemployment compensation is financed by taxes levied on employers.
Chapter 20 – Income Inequality and Poverty
150. TANF stands for Temporary Assistance for Needy Families.
151. After the implementation of TANF, the U.S. welfare rolls fell by more than one-half
between 1996 and 2007.
152. The U.S. poverty rate for the elderly (65 and over) is higher than for the general
population.
153. The U.S. poverty rate was considerably lower in 2008 than in 1960.
Chapter 20 – Income Inequality and Poverty
154. Labor market discrimination increases the size of the nation’s GDP by promoting
specialization on the basis of race.
155. An employer (biased against African-Americans) whose discrimination coefficient is $5
will hire only whites if the actual African-American-white wage gap is $7.
156. A reduction in the collective discrimination coefficients of employers will increase the
wage rate of those discriminated against, but reduce their employment.
157. Statistical discrimination is also known as occupational discrimination.
Chapter 20 – Income Inequality and Poverty
158. The crowding model of occupational segregation predicts that domestic output will
increase if occupational segregation is ended.