Chapter 20 – Income Inequality and Poverty
1. The average household income in the United States in 2008 was:
2. Based on 2008 data on the distribution of personal income in the U.S., about:
Chapter 20 – Income Inequality and Poverty
3. In 2008, the portion of the U.S. population that lived in poverty was:
4. In 2008, about what percentage of U.S. households had personal incomes of less than
$10,000?
5. The percentage of total before-tax income received by the lowest 20 percent of households
in 2008 was about:
Chapter 20 – Income Inequality and Poverty
6. The percentage of total before-tax income received by the top 20 percent of households in
2008 was about:
7. Refer to the above table. What percentage of households made less than $15,000?
Chapter 20 – Income Inequality and Poverty
8. Refer to the above table. What percentage of households made $25,000 or more?
9. Refer to the above table. What percentage should be reported in blank A of column 2?
10. Refer to the above table. What percentage should be reported in blank B of column 2?
11. Refer to the above table. What percentage should be reported in blank C of column 3?
12. Refer to the above table. What percentage of households made $50,000 or more?
13. A Lorenz curve showing perfect equality in the distribution of income:
Chapter 20 – Income Inequality and Poverty
14. A Lorenz curve is a graph that shows:
15. The Gini ratio or Gini coefficient is a measure of the:
16. The greater the degree of inequality in the distribution of income, the more bowed will be
the Lorenz curve toward the:
Chapter 20 – Income Inequality and Poverty
17. The degree of inequality in the distribution of income in an economy is depicted in a(n):
18. The Lorenz curve is helpful in visualizing the:
19. The Gini ratio is calculated by dividing the area between the Lorenz curve and the
diagonal by the:
Chapter 20 – Income Inequality and Poverty
20. As the area between the Lorenz curve and diagonal gets larger, the Gini ratio:
21. Perfect income equality would yield a Gini ratio of:
22. A kingdom where only the king earns all income would have a Gini ratio of:
Chapter 20 – Income Inequality and Poverty
23. Which of the following Gini ratios would indicate the least amount of income inequality?
24. A progressive income tax would cause the after-tax Lorenz curve, compared with the
before-tax Lorenz curve, to be:
Chapter 20 – Income Inequality and Poverty
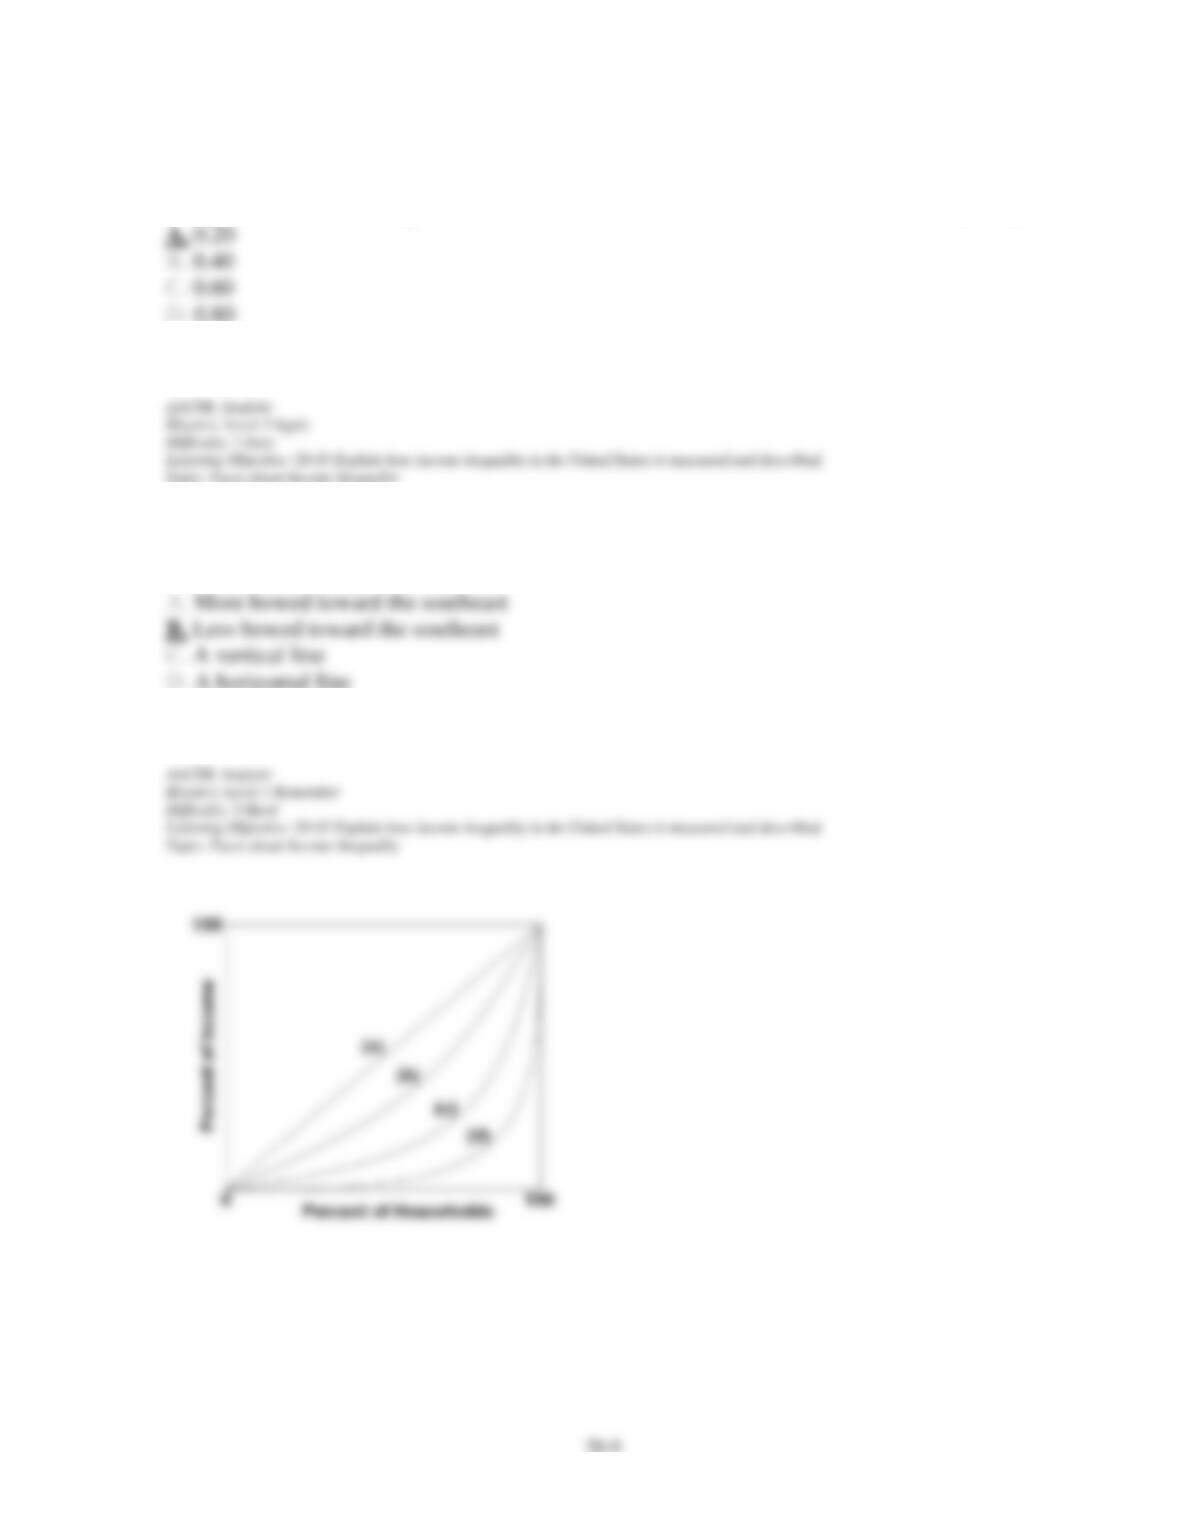
25. Refer to the figure above. In Venezuela, there is a very small number of extremely
wealthy households and an extremely large number of very poor households. If the United
States is represented by Lorenz curve c above, which curve would represent Venezuela?
26. Refer to the figure above. A nation that has an income distribution of perfect equality
would be represented by the above curve:
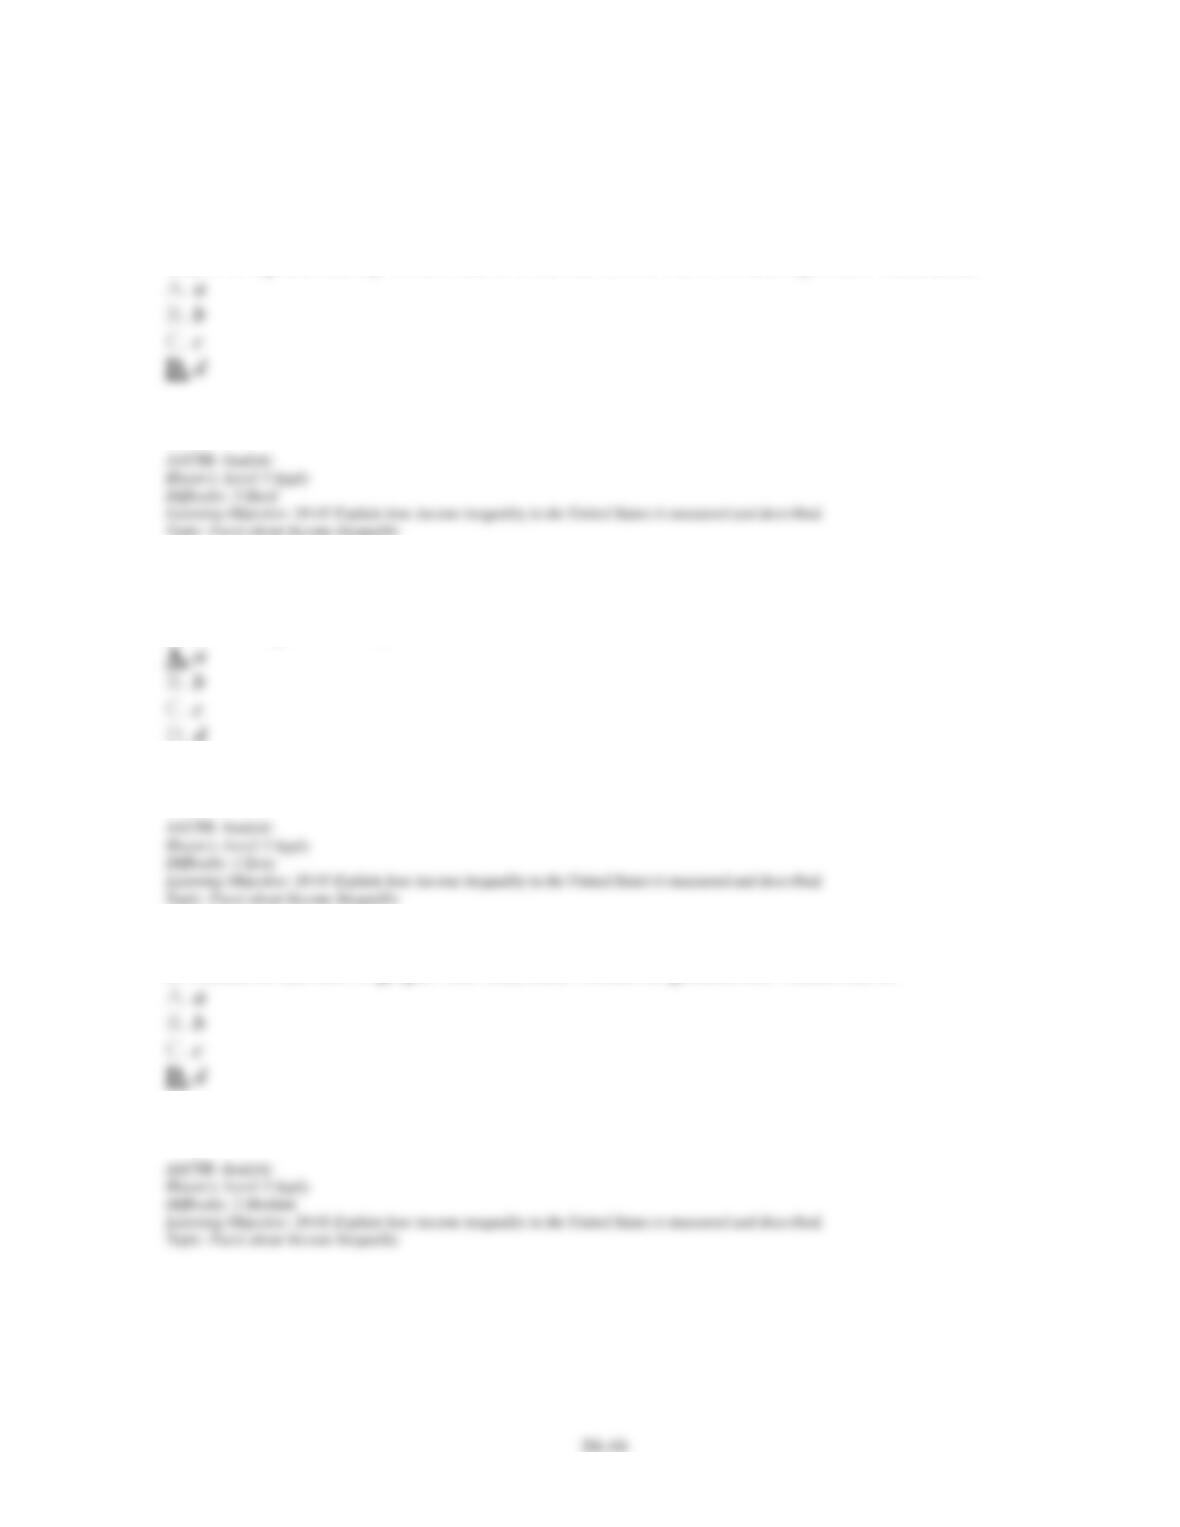
27. Refer to the above graph. The Gini ratio would be greatest for which curve?
Chapter 20 – Income Inequality and Poverty
28. Refer to the figure above. The Gini ratio would be 0 for which curve?
29. Refer to the above graph. If the Lorenz curve shifted from (d) to (b), then the Gini ratio
would:
Chapter 20 – Income Inequality and Poverty
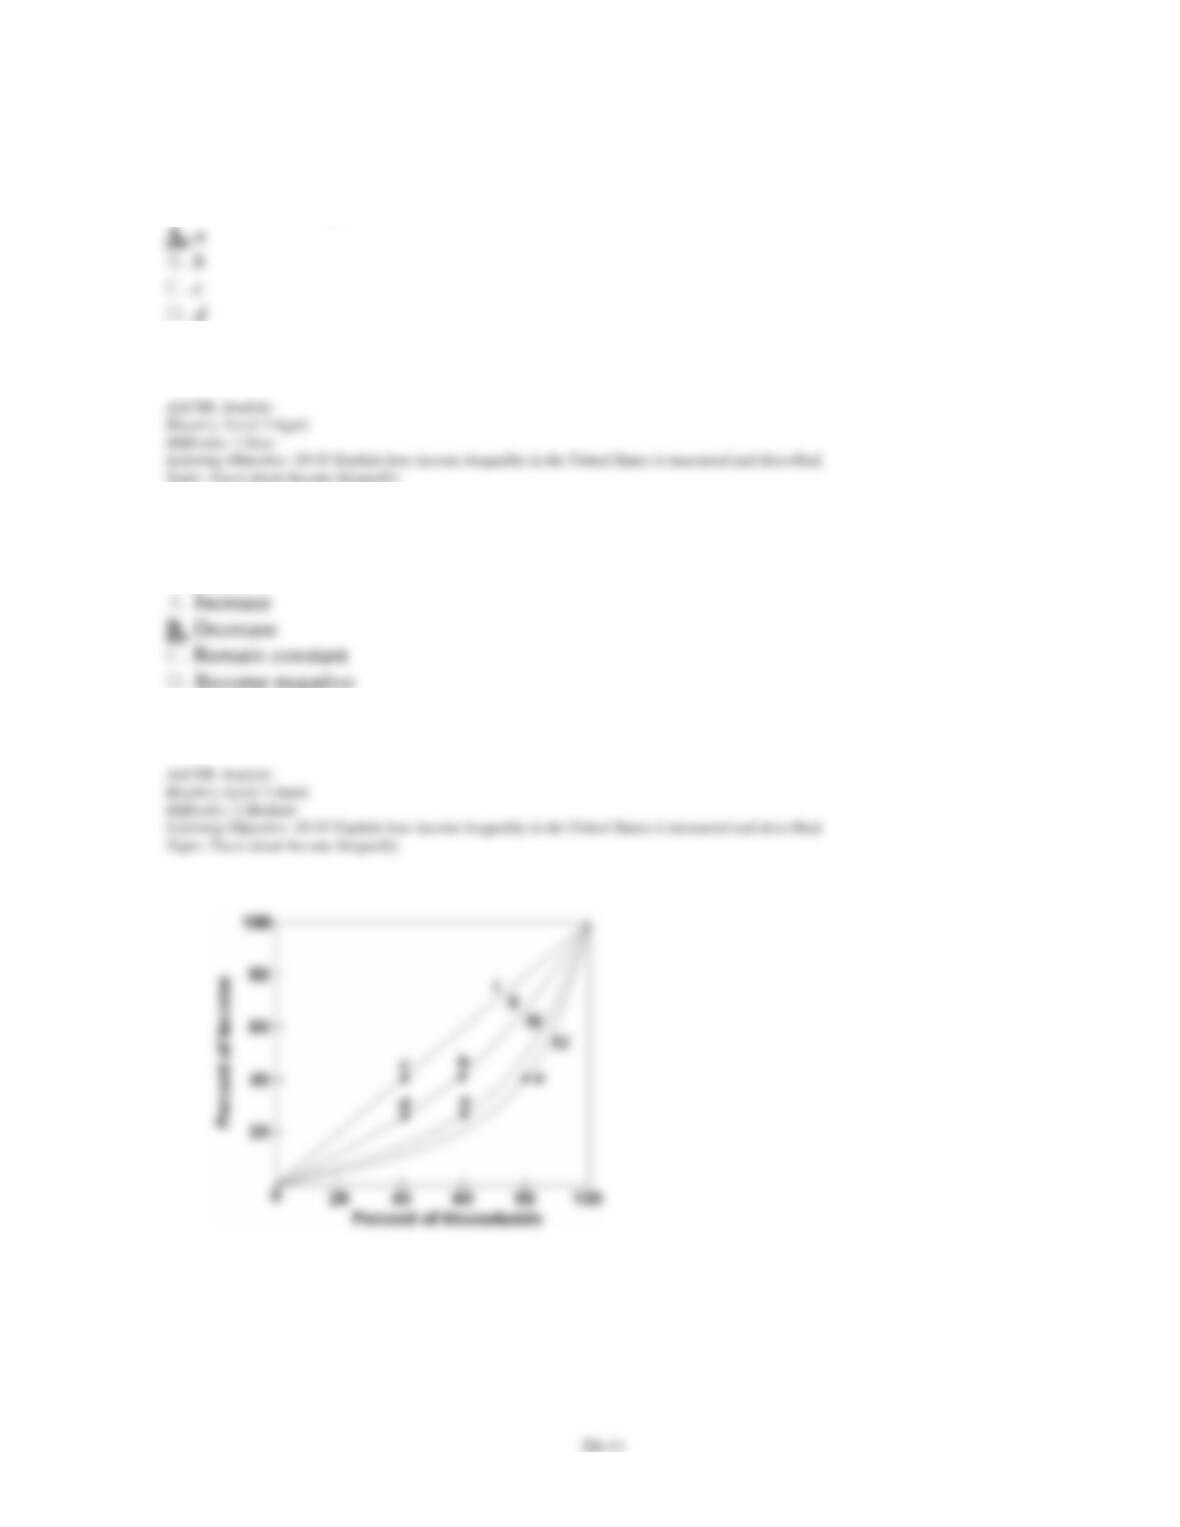
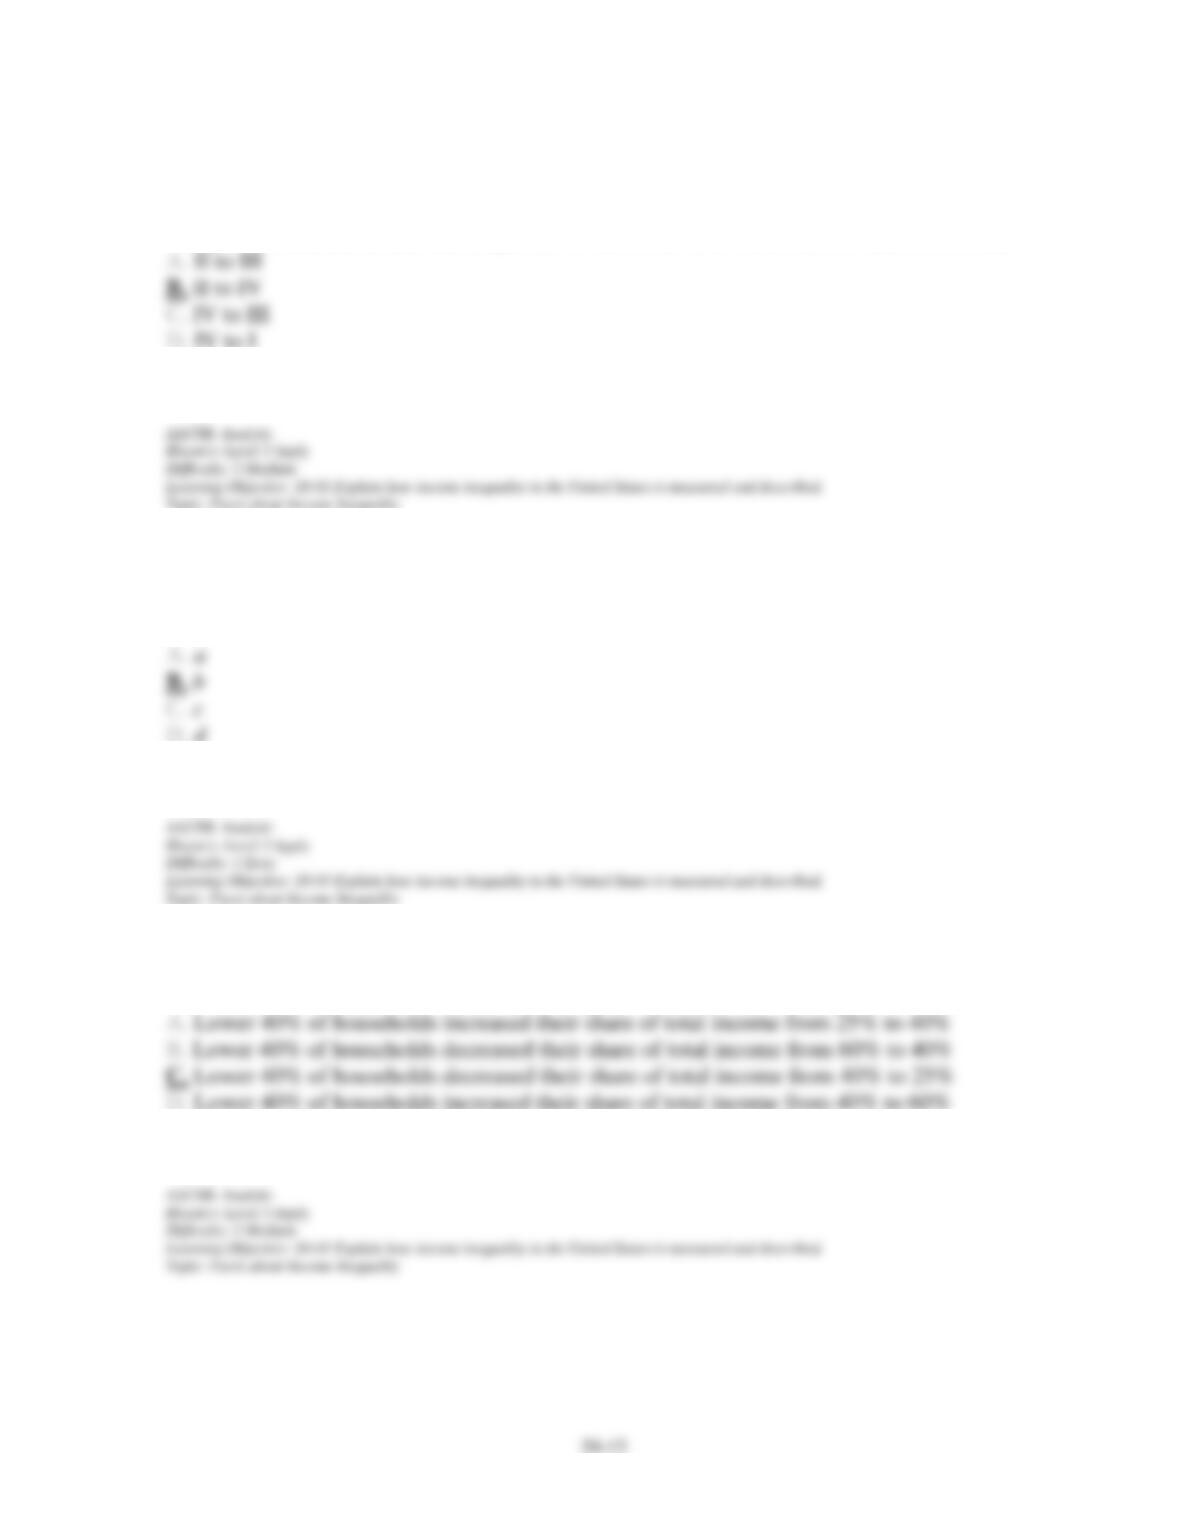
30. Refer to the figure above, which shows four different Lorenz curves (I, II, III, and IV).
The greatest increase in income inequality would occur with a shift in a Lorenz curve from:
31. Refer to the figure above, which shows four different Lorenz curves (I, II, III, and IV).
What point indicates that the lower 60 percent of the households receive only 40 percent of
the nation’s total income?
32. Refer to the figure above, which shows four different Lorenz curves (I, II, III, and IV).
The movement from point b to point a in the graph would indicate that the:
Chapter 20 – Income Inequality and Poverty
33. Refer to the figure above, which shows four different Lorenz curves (I, II, III, and IV).
Which point would indicate that the top 40% of households earned 60% of the nation’s total
income?
34. Which of the following is an example of a noncash transfer that is typically not included
in the income-distribution data?
35. When the distribution of income is adjusted for noncash transfers, the income distribution
shows:
Chapter 20 – Income Inequality and Poverty
36. Which of the following contributes most to the reduction in income inequality?
37. Suppose that Jane earns $10,000 in year 1 and $15,000 in year 2, while Jim earns $15,000
in year 1 and $10,000 in year 2. Is there income equality for the two individuals?
38. The empirical data indicate that the tax system and the transfer programs of the
government:
Chapter 20 – Income Inequality and Poverty
39. Two major criticisms of the Bureau of Census data as a portrayal of the degree of income
inequality are that the income concept employed is too:
40. When taxes and transfer payments are taken into account, the distribution of income in the
United States:
41. The degree of inequality in income distribution based on single-year data is:
Chapter 20 – Income Inequality and Poverty
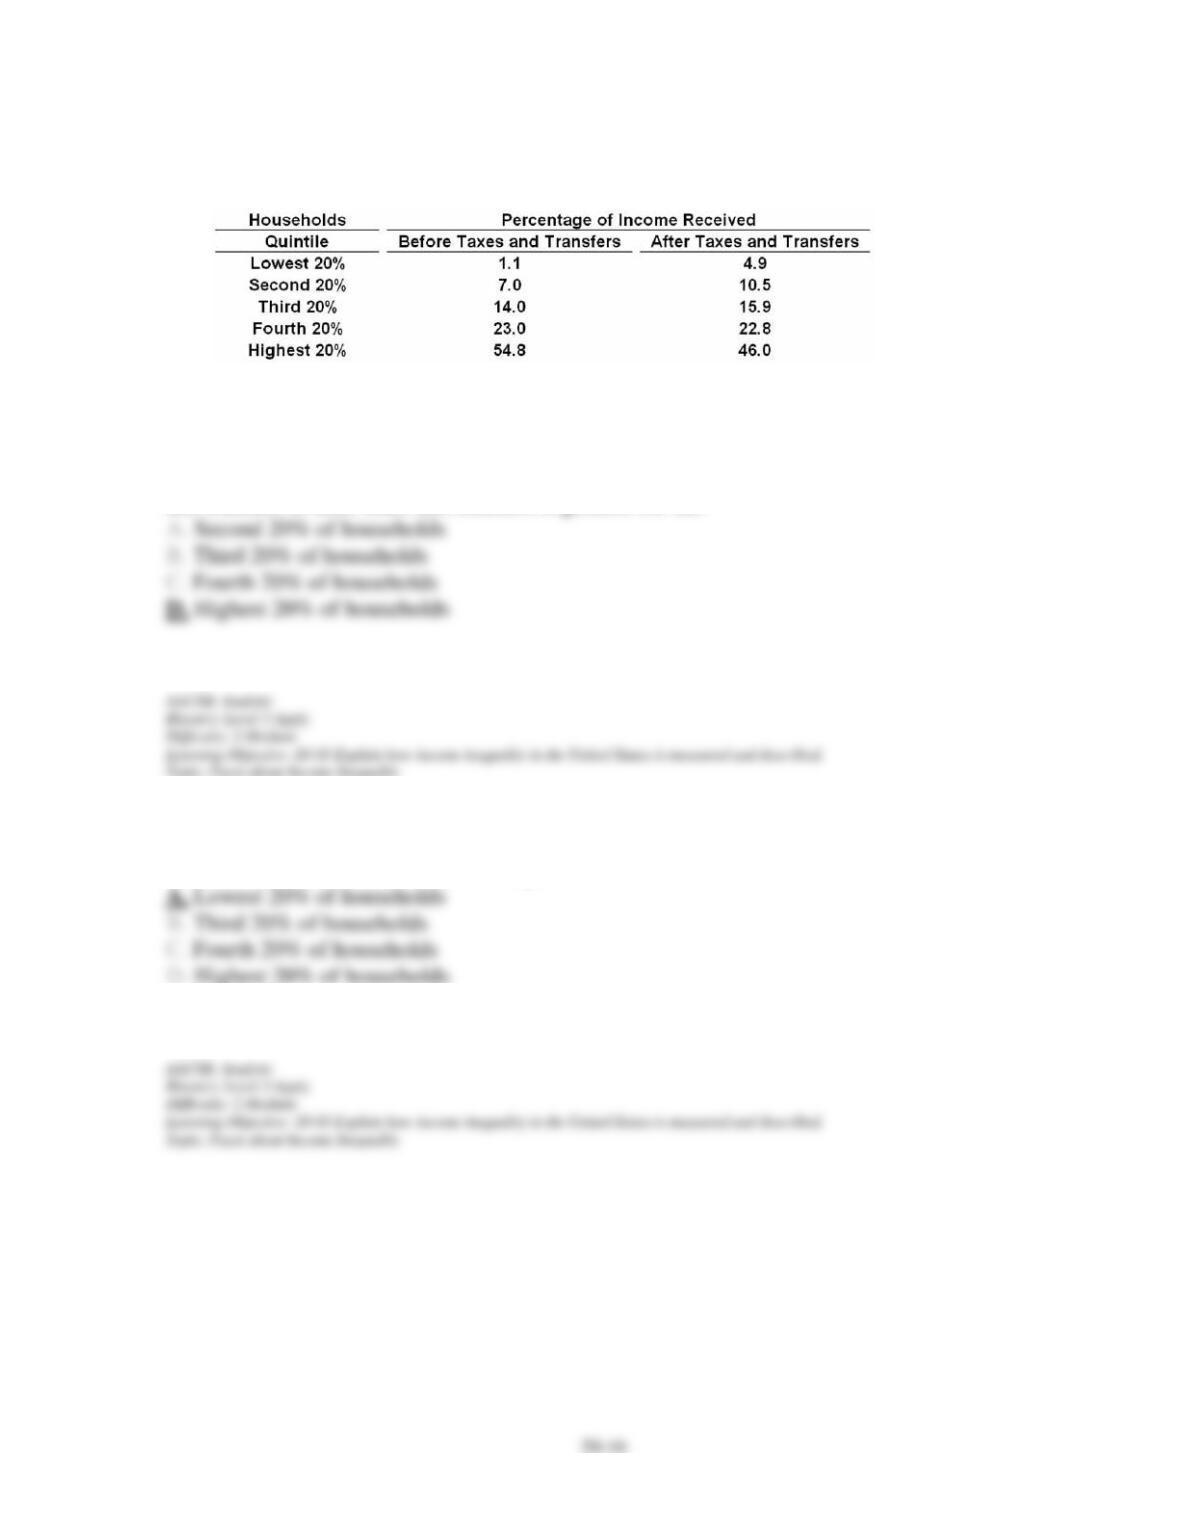
42. Refer to the above table. The decline in percentage of income received from before taxes
43. Refer to the above table. The rise in percentage of income received from before taxes and
transfers to after taxes and transfers is greatest for the:
Chapter 20 – Income Inequality and Poverty
44. One of the major causes of income inequality is differences in:
45. A cause of the unequal distribution of income in the United States is:
46. Which of the following would be a significant cause of income inequality in the United
States?
Chapter 20 – Income Inequality and Poverty
47. Earnings received from wealth:
48. The wages and salaries that people earn differ partly because of differences in:
49. Which of the following would be an example of how pure luck contributes to income
inequality?
Chapter 20 – Income Inequality and Poverty
50. Which of the following is not one of the causes of the unequal distribution of income in
the United States?
51. The difference between income and wealth is that income:
52. Which of the following would be considered part of income?
Chapter 20 – Income Inequality and Poverty
53. Which of the following would be considered part of wealth?
54. Since 1970, the distribution of personal income in the United States has:
55. Which of the following is a cause of growing income inequality in the United States since
1970?