Chapter 20 – Income Inequality and Poverty
1. In 2008, the average income for households in the United States was about:
2. In the quintile distribution of income, the term “quintile” represents:
Chapter 20 – Income Inequality and Poverty
3. In 2008, a household with an annual income of $95,000 would find itself in the:
4. In 2008, a household with an annual income of $20,000 would find itself in the:
5. The lowest quintile of households in the income distribution receives about:
Chapter 20 – Income Inequality and Poverty
6. The highest quintile of households in the income distribution:
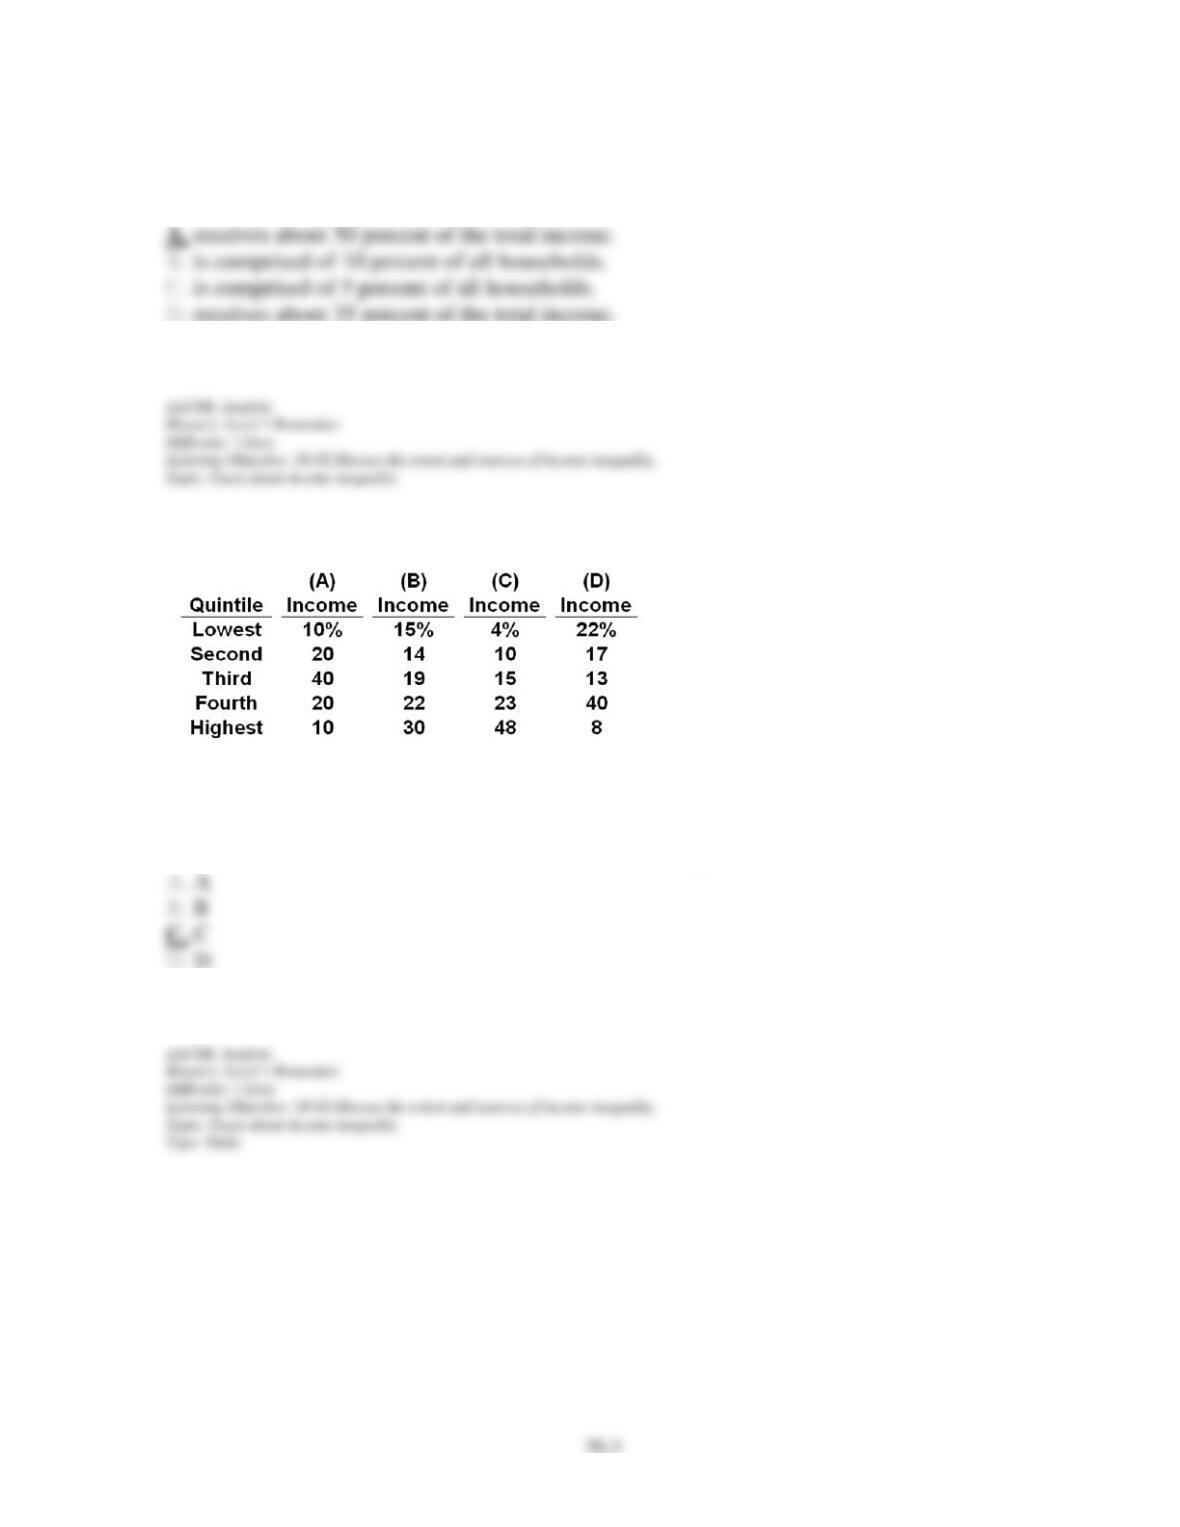
Answer the Question on the basis of the following Census data.
7. Which of the above distributions is closest to describing the United States?
Chapter 20 – Income Inequality and Poverty
8. In 2008, the highest quintile of households in the U.S. income distribution received about:
9. Census data indicate that, as of 2008, the top fifth of all households receive about ________
times as much income as the bottom fifth.
10. The Lorenz curve:
Chapter 20 – Income Inequality and Poverty
11. The Lorenz curve portrays:
12. The Gini ratio:
13. The Gini ratio of income inequality ranges between:
Chapter 20 – Income Inequality and Poverty
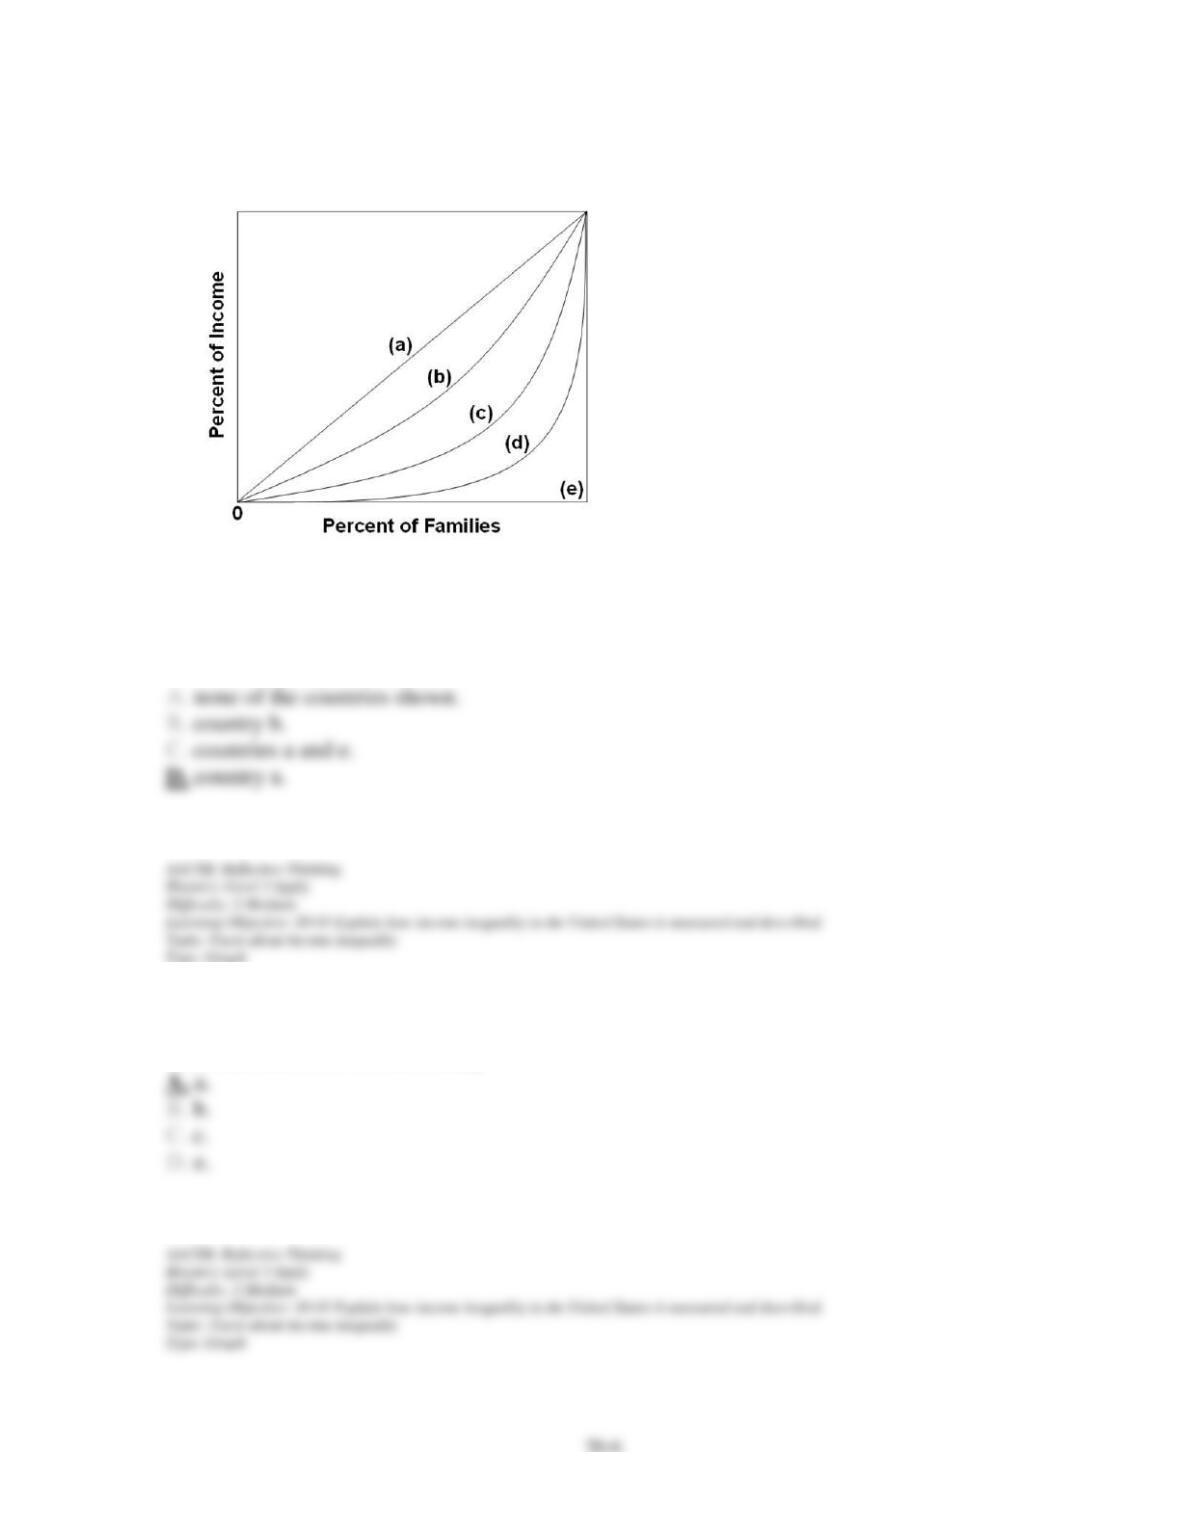
14. Refer to the above diagram where curves (a) through (e) are for five different countries.
Income is equally distributed in:
15. Refer to the above diagram where curves (a) through (e) are for five different countries.
The Gini ratio is lowest in country:
Chapter 20 – Income Inequality and Poverty
16. Refer to the above diagram where curves (a) through (e) are for five different countries.
Of the countries listed below, income is most unequally distributed in country:
17. Refer to the above diagram where curves (a) through (e) are for five different countries.
The Gini ratio is:
Chapter 20 – Income Inequality and Poverty
18. Refer to the above information. What percentage of total income is received by the richest
quintile?
19. Refer to the above information. What percentage of total income is received by the lowest
60 percent of the income receivers in population A?
20. Refer to the above information. Population B, consisting of Fred, George, Holly, Irma,
and Joan, receive incomes of $4,000, $3,000, $1,250, $950, and $800, respectively. We:
Chapter 20 – Income Inequality and Poverty
21. The greater the area between the Lorenz curve and the diagonal in the Lorenz Curve
diagram, the:
22. Which of the following Gini ratios indicates the highest degree of income inequality?
23. Which of the following Gini ratios indicates the lowest degree of income inequality?
Chapter 20 – Income Inequality and Poverty
24. Which of the following countries has the highest Gini ratio, as of 2008?
25. The movement of individuals and households from one income quintile to another over
time is called:
26. Income mobility:
Chapter 20 – Income Inequality and Poverty
27. Income mobility:
28. In the United States, The lifetime distribution of income is more equal than the annual
distribution. This statement is:
29. People’s incomes are relatively low when they are young, reach a peak in middle age, and
then decline. This fact helps explain:
Chapter 20 – Income Inequality and Poverty
30. Some economists have criticized standard government figures on income inequality,
arguing that these data:
31. In the United States:
32. Housing subsidies for low-income households:
Chapter 20 – Income Inequality and Poverty
33. Standard Census data on the distribution of income:
34. Which of the following is a noncash transfer?
Chapter 20 – Income Inequality and Poverty
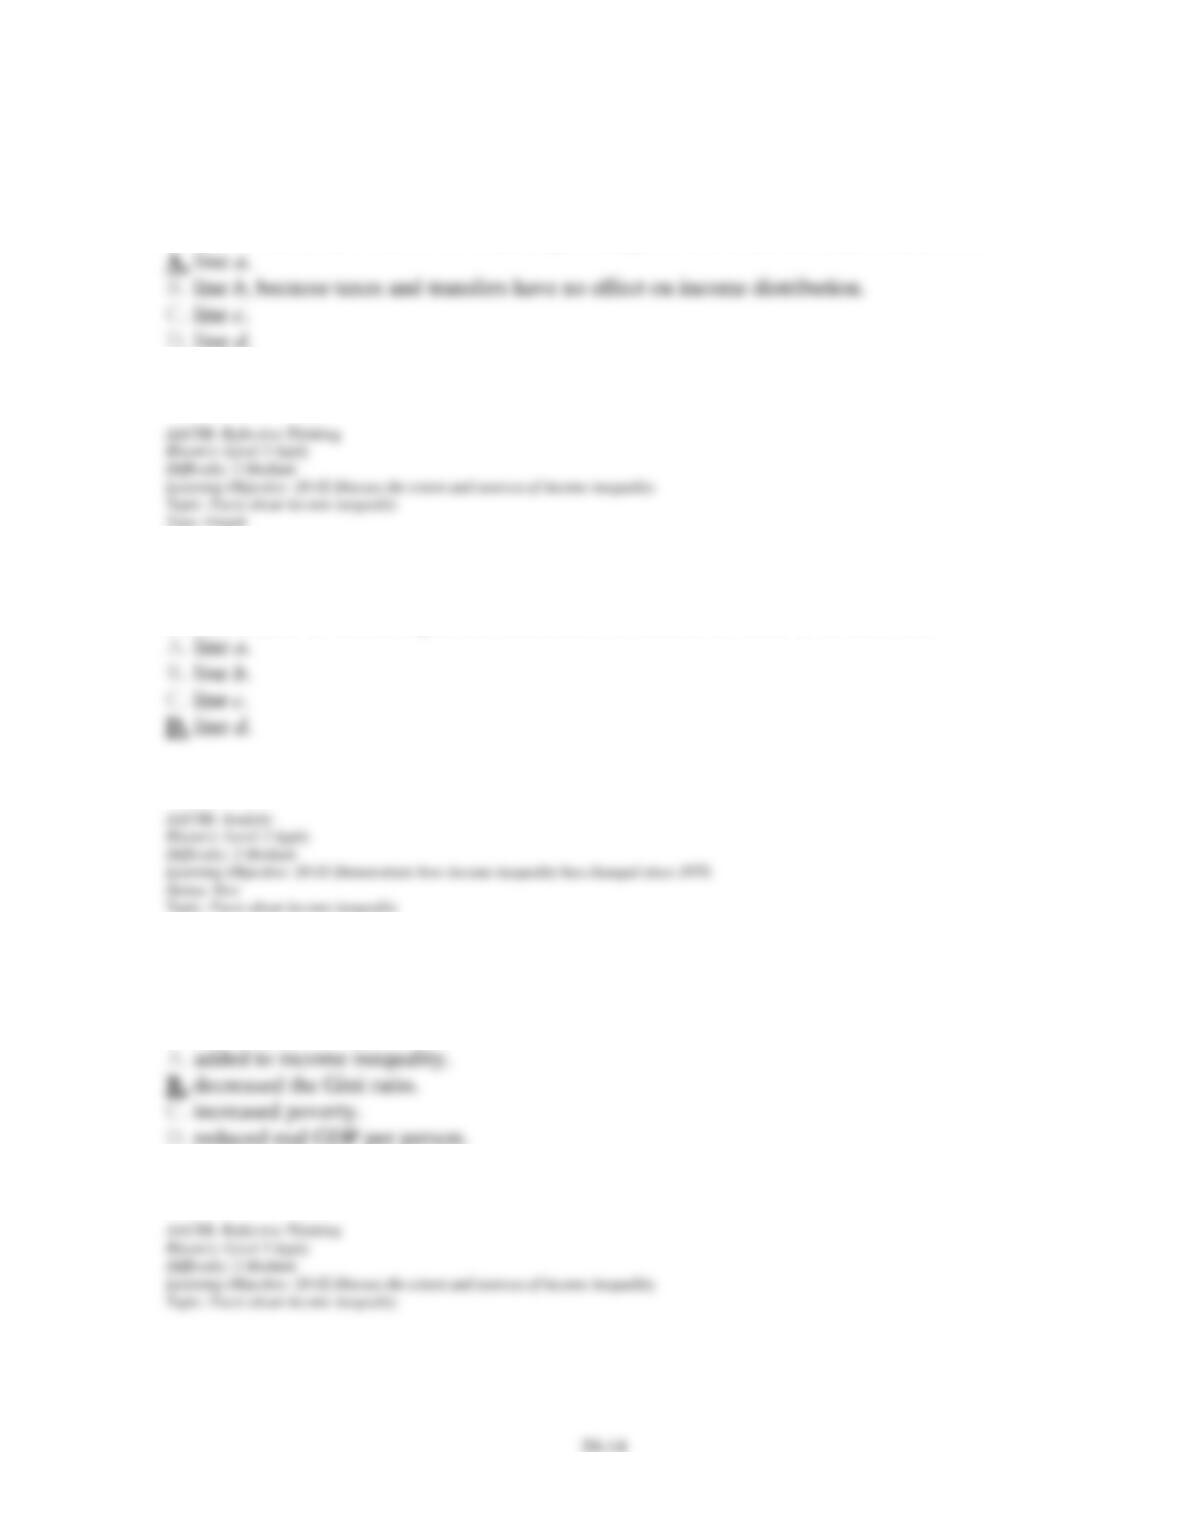
35. Refer to the above diagram. If line b represents the pretax and transfer distribution of
income in the United States, we would expect the post-tax and transfer distribution to be:
36. Refer to the above diagram. If line c represents the distribution of income in 1970 in the
United States, we would expect the distribution of income for 2008 to be more like:
37. Refer to the above diagram. If line c represents the distribution of income before taxes and
transfers and line b represents the distribution after taxes and transfers, then taxes and
transfers have:
Chapter 20 – Income Inequality and Poverty
38. Each of the following contributes to income inequality except:
39. If discrimination based on gender and race was eliminated, we would expect the:
40. Differences in the amounts and quality of education and training:
Chapter 20 – Income Inequality and Poverty
41. One cause of income inequality in the United States is:
42. Which of the following would likely reduce income inequality?
43. Income:
Chapter 20 – Income Inequality and Poverty
44. Wealth:
45. Which of the following is correct?
46. Wealth in the United States is:
Chapter 20 – Income Inequality and Poverty
47. The distribution of wealth in the United States is such that it:
48. Which is correct?
49. The exercise of market power by suppliers in resource markets tends to:
Chapter 20 – Income Inequality and Poverty
50. Each of the following has contributed to growing income inequality in the United States
since 1970 except:
51. Which of the following would most likely increase income inequality?
52. Since 1970 the distribution of income has:
Chapter 20 – Income Inequality and Poverty
53. Which of the following helps explain growing income inequality in the United States in
recent years?
54. The term “growing income inequality” implies that the:
55. Since 1980 the difference between the earnings of college graduates and high school
graduates has: