Chapter 20/Income Inequality and Poverty ❖ 21
81. The distribution of income for Danville is as follows:
Number of Families
Income
500
less than $15,000
600
between $15,000 and $20,000
1,000
between $20,000 and $25,000
700
between $25,000 and $30,000
500
over $30,000
If the poverty rate in Danville is 33.3 percent, what is the poverty line in Danville?
a.
$15,000.
b.
$20,000.
c.
$25,000.
d.
$30,000.
82. The poverty line in the country of Abbyville is $15,000. The distribution of income for Abbyville is as fol-
lows:
Number of Families
Income
300
less than $15,000
500
between $15,000 and $20,000
900
between $20,000 and $25,000
600
between $25,000 and $30,000
200
over $30,000
The poverty rate in Abbyville is
a.
12 percent.
b.
32 percent.
c.
50 percent.
d.
68 percent.
83. The distribution of income for Abbyville is as follows:
Number of Families
Income
300
less than $15,000
500
between $15,000 and $20,000
900
between $20,000 and $25,000
600
between $25,000 and $30,000
200
over $30,000
If the poverty rate in Abbyville is 12 percent, what is the poverty line in Abbyville?
a.
$15,000.
b.
$20,000.
c.
$25,000.
d.
$30,000.
22 ❖ Chapter 20/Income Inequality and Poverty
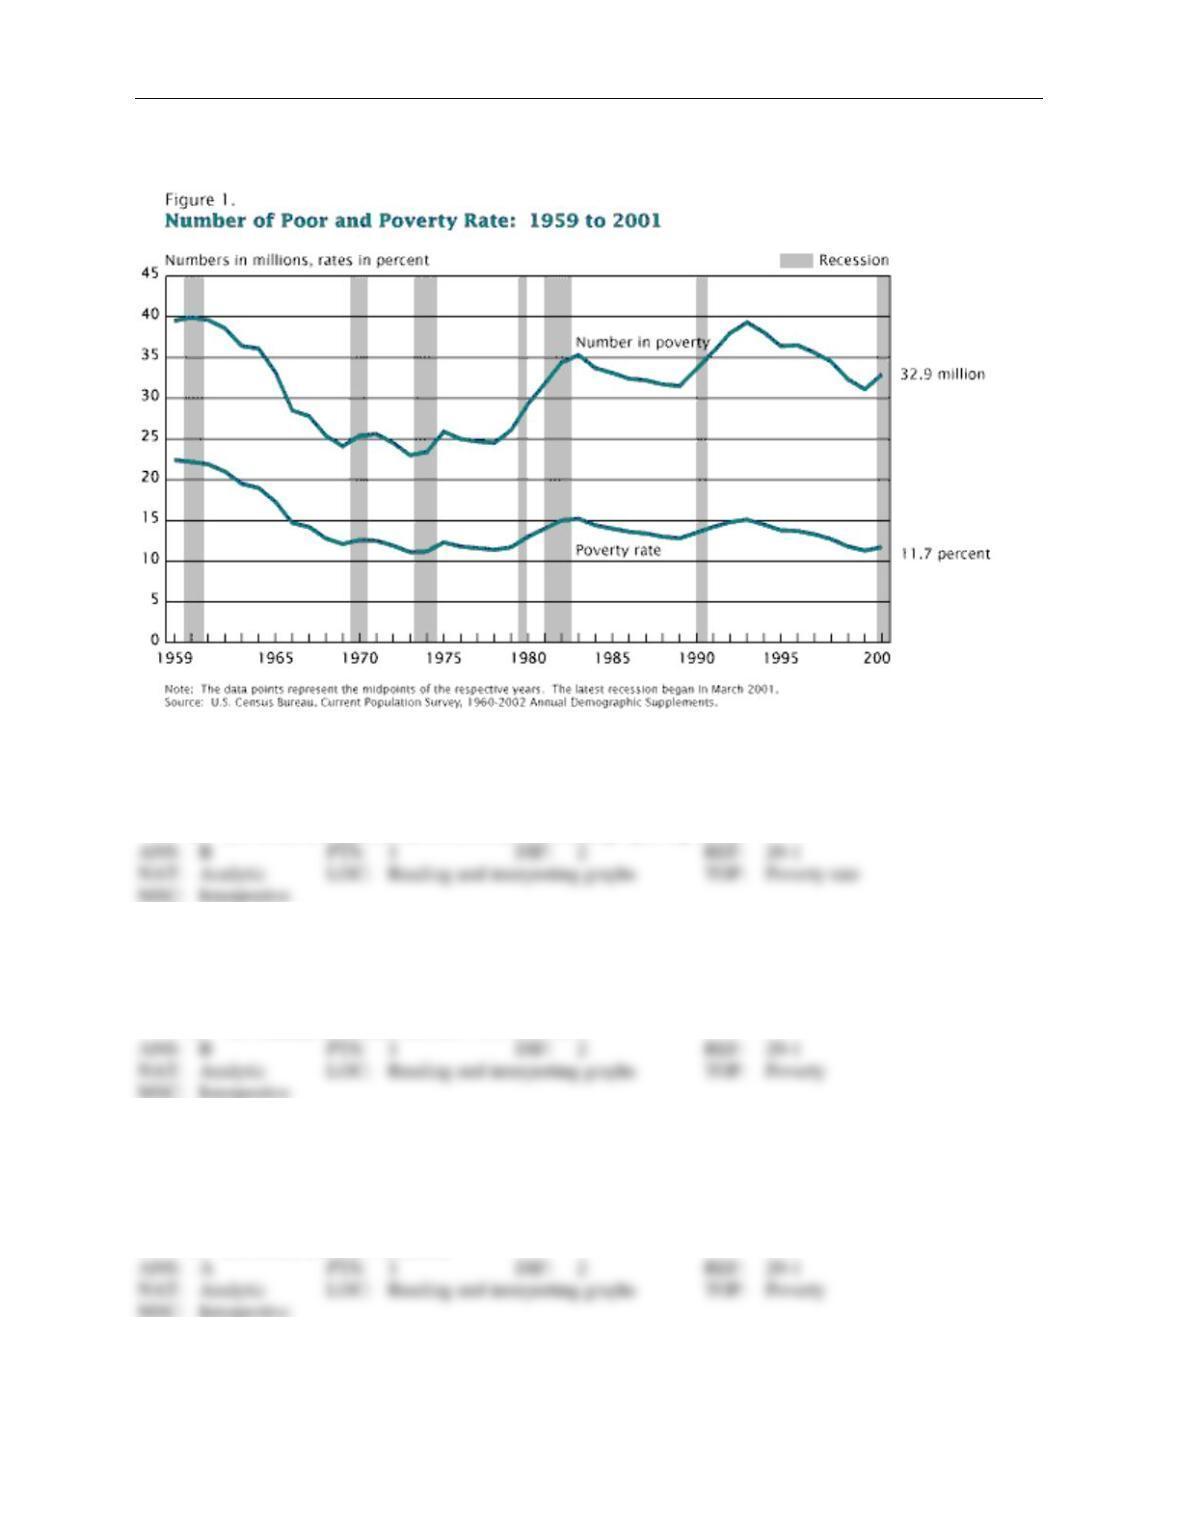
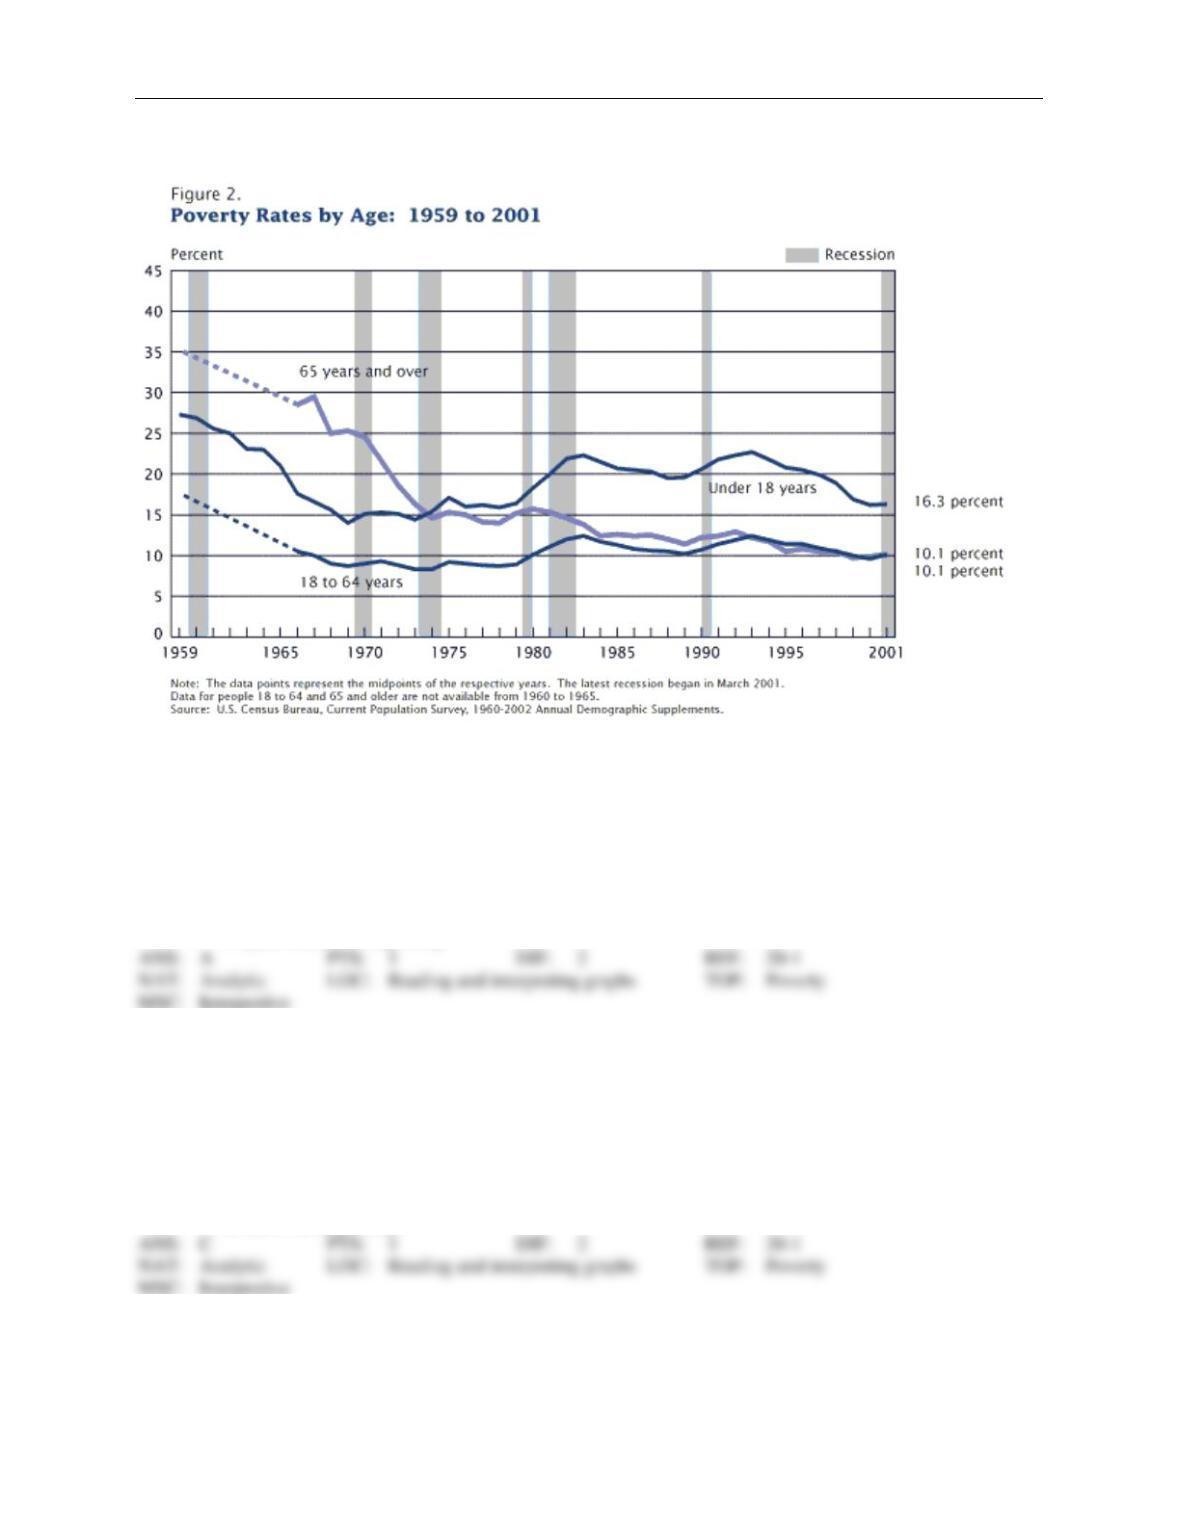
Figure 20-2
Number of Poor
84. Refer to Figure 20-2. Between 1959 and 2001 the poverty rate has
a.
increased overall.
b.
decreased overall.
c.
stayed the same overall.
d.
moved in the opposite direction of the number of people in poverty.
85. Refer to Figure 20-2. The absolute number of people in poverty
a.
is higher in 2001 than in 1959.
b.
is lower in 2001 than in 1959.
c.
has not changed between 1959 and 2001.
d.
has steadily decreased between 1959 and 2001.
86. Refer to Figure 20-2. Between 1965 and 2001, during recessions (the shaded bars) the number of individuals
in poverty has
a.
increased.
b.
decreased.
c.
not changed.
d.
decreased and then increased.
Chapter 20/Income Inequality and Poverty ❖ 23
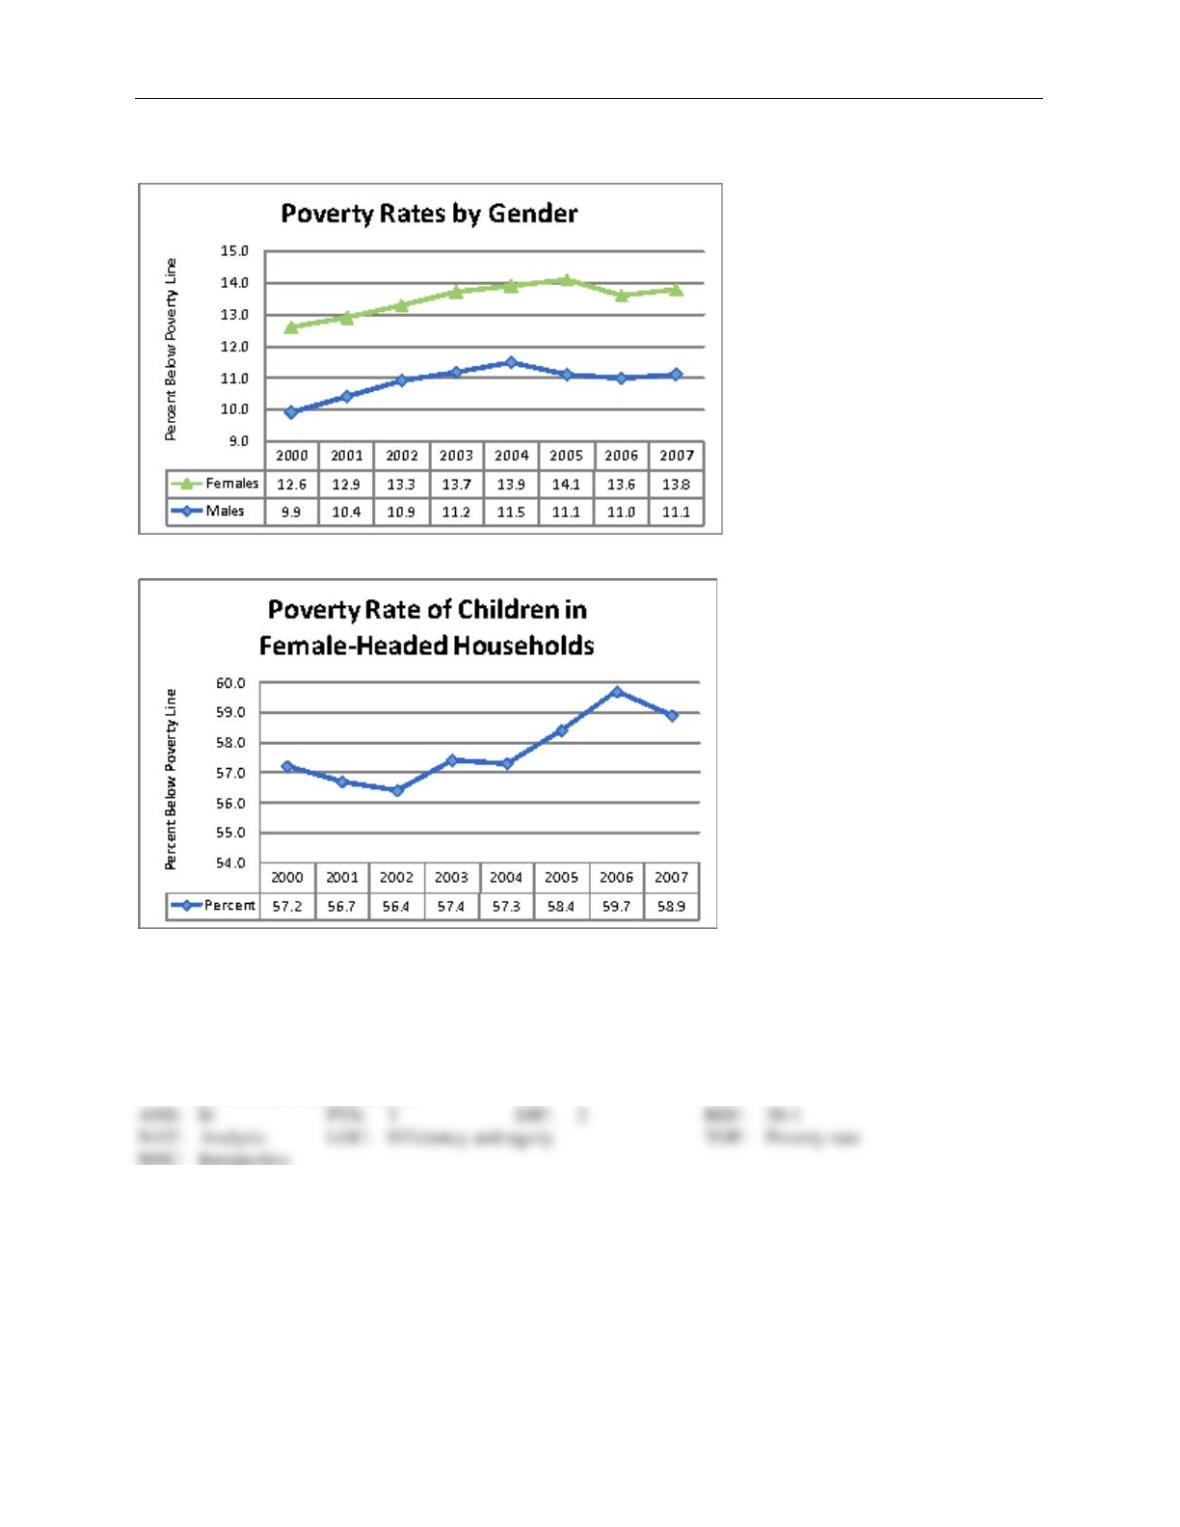
Figure 20-3
Panel A
Source: U.S. Bureau of the Census
Panel B
Source: U.S. Bureau of the Census
87. Refer to Figure 20-3. Which of the following would be consistent with the data reported in Panel A?
a.
Policies that attempted to reduce female poverty rates were relatively successful.
b.
Policies that attempted to narrow the gap between male and female poverty rates were relatively
successful.
c.
Both a and b are correct.
d.
Neither a nor b is correct.
88. Refer to Figure 20-3. Panel B focuses on children who live in female-headed households. It illustrates the
percentage of those children who live in poverty. For example, in 2000, slightly over 57 percent of all
24 ❖ Chapter 20/Income Inequality and Poverty
children who lived in a female-headed household lived below the poverty line. How is this information re-
lated to the graph illustrated in Panel A?
a.
The high prevalence of poverty in households headed by women is inversely related to male
poverty rates.
b.
The poverty rates shown in Panel B are found by multiplying the female poverty rates shown in
Panel A by 450%.
c.
The high prevalence of poverty in households headed by women likely explains why female
poverty rates are higher than male poverty rates.
d.
Both b and c are correct.
89. In 2008, the poverty line for a family of four in the U.S. was
a.
$56,194.
b.
$22,025.
c.
$19,971.
d.
$12,603.
90. The poverty line is adjusted each year to reflect changes in the
a.
number of people currently on public assistance.
b.
level of prices.
c.
nutritional content of an “adequate” diet.
d.
size of a family.
91. The federal government sets the poverty line at roughly
a.
five times the cost of providing an adequate diet.
b.
four times the cost of providing an adequate diet.
c.
three times the cost of providing an adequate diet.
d.
two times the cost of providing an adequate diet.
92. The income level below which families are said to be poor is known as the
a.
income maintenance threshold.
b.
poverty line.
c.
bottom quintile of the income distribution.
d.
minimum wage.
93. The poverty rate is the percentage of the population that have a family income level below the
a.
income maintenance threshold.
b.
poverty line.
c.
bottom quintile of the income distribution.
d.
minimum wage.
Chapter 20/Income Inequality and Poverty ❖ 25
94. If the U.S. government determines that the cost of feeding an urban family of six is $6,000 per year, then the
official poverty line for a family of that type is
a.
$6,000.
b.
$12,000.
c.
$18,000.
d.
$36,000.
95. If the U.S. government determines that the cost of feeding an urban family of four is $5,200 per year, then the
official poverty line for a family of that type is
a.
$10,400.
b.
$15,600.
c.
$20,800.
d.
$26,000.
96. The US government sets the poverty line equal to approximately
a.
three times the cost of providing subsidized housing.
b.
three times the cost of providing an adequate diet.
c.
the minimum wage for a single person working 40 hours per week and 50 weeks per year.
d.
the cost of providing food, shelter, and health care expenses for a family of four.
97. The calculation of the poverty line includes adjustments for
a.
energy costs.
b.
child care costs.
c.
the level of prices.
d.
the Earned Income Tax Credit.
98. Which of the following statements is not correct?
a.
The poverty line is an absolute level of income set by the federal government below which a family
is considered to be in poverty.
b.
The poverty line is approximately equal to three times the cost of providing an adequate diet.
c.
The poverty line is adjusted annually to reflect changes in price levels.
d.
The poverty line is adjusted semiannually to reflect changes in fuel prices.
26 ❖ Chapter 20/Income Inequality and Poverty
Table 20-9
Poverty Thresholds in 2002, by Size of Family and Number of Related Children Under 18 Years
[Dollars]
Related children under 18 years
Size of family unit
None
One
Two
Three
Four
Five
Six
Seven
Eight or
more
One person (unrelated individual)
Under 65 years
9,359
65 years and over
8,628
Two persons
Householder under 65 years
12,047
12,400
Householder 65 years and over
10,874
12,353
Three persons
14,072
14,480
14,494
Four persons
18,556
18,859
18,244
18,307
Five persons
22,377
22,703
22,007
21,469
21,141
Six persons
25,738
25,840
25,307
24,797
24,038
23,588
Seven persons
29,615
29,799
29,162
28,718
27,890
26,924
25,865
Eight persons
33,121
33,414
32,812
32,285
31,538
30,589
29,601
29,350
Nine persons or more
39,843
40,036
39,504
39,057
38,323
37,313
36,399
36,173
34,780
Source: U. S. Bureau of the Census, Current Population Survey.
99. Refer to Table 20-9. What is the poverty line for a family of six with three children?
a.
$21,469
b.
$24,797
c.
$25,738
d.
$28,718
100. Refer to Table 20-9. What is the poverty line for a family of eight with two children?
a.
$14,494
b.
$32,812
c.
$33,121
d.
$34,780
101. Refer to Table 20-9. What is the poverty line for a family of three with one child?
a.
$12,072
b.
$12,400
c.
$14,480
d.
$14,494
102. Refer to Table 20-9. What is the poverty line for a 75-year-old individual?
a.
$8,628
b.
$9,359
c.
$12,353
d.
$12,400
Chapter 20/Income Inequality and Poverty ❖ 27
103. Refer to Table 20-9. What is the poverty line for a family with one 35-year-old adult and one child?
a.
$8,628
b.
$9,359
c.
$12,353
d.
$12,400
104. Refer to Table 20-9. What is the poverty line for a family with one 68-year-old adult and one child?
a.
$8,628
b.
$9,359
c.
$12,353
d.
$12,400
105. The poverty line is
a.
established by the federal government.
b.
approximately equivalent to three times the cost of providing an adequate diet.
c.
an absolute level of income below which a family is deemed to be in poverty.
d.
All of the above are correct.
106. Poverty is found to be correlated with
a.
age and race but not family composition.
b.
race only.
c.
race and family composition but not age.
d.
age, race, and family composition.
107. Measuring poverty using an absolute income scale like the poverty line can be misleading because
a.
income measures do not include the value of in-kind transfers.
b.
money is more highly valued by the rich than by the poor.
c.
the poor are not likely to participate in the labor market.
d.
income measures are not adjusted for the effects of labor–market discrimination.
108. Which of the following statements is correct?
a.
The poverty line is a relative standard.
b.
More families are pushed above the poverty line as economic growth pushes the entire income
distribution upward.
c.
Increasing income inequality reduces poverty.
d.
Economic growth, by definition, affects all families equally.
28 ❖ Chapter 20/Income Inequality and Poverty
109. Which of the following groups has the highest poverty rate?
a.
blacks
b.
Asians
c.
children (under age 18)
d.
female households, no spouse present
110. Which of the following groups has the lowest poverty rate?
a.
blacks
b.
Asians
c.
children (under age 18)
d.
female households, no spouse present
111. Which of the following is not correct?
a.
Poverty is correlated with race.
b.
Poverty is correlated with age.
c.
Poverty is correlated with family composition.
d.
All of the above are correct.
112. In comparison to the average poverty rate,
a.
children and the elderly are more likely to be poor.
b.
children and the elderly are less likely to be poor.
c.
children are more likely to be poor, but the elderly are less likely to be poor.
d.
children are less likely to be poor, but the elderly are more likely to be poor.
Chapter 20/Income Inequality and Poverty ❖ 29
Figure 20-4
Poverty Rates by Age
113. Refer to Figure 20-4. In 2001, the percent of children under age 18 in poverty is
a.
higher than both the percentage of adults aged 18 to 64 and the percentage of elderly aged 65 years
and over in poverty.
b.
higher than the percentage of adults aged 18 to 64 but is lower than the percentage of elderly aged
65 years and over in poverty.
c.
lower than both the percentage of adults aged18 to 64 and the percentage of elderly aged 65 years
and over in poverty.
d.
lower than the percentage of adults aged 18 to 64 but is higher than the percentage of elderly aged
65 years and over in poverty.
114. Refer to Figure 20-4. In 1968, the percent of adults aged 18 to 64 years in poverty is
a.
higher than both the percentage of children under age 18 and the percentage of elderly aged 65 and
over in poverty.
b.
higher than the percentage of children under age 18 but is lower than the percentage of elderly aged
65 and over in poverty.
c.
lower than both the percentage of children under age 18 and the percentage of elderly aged 65 and
over in poverty.
d.
lower than the percentage of children under age 18 but is higher than the percentage of elderly aged
65 and over in poverty.
30 ❖ Chapter 20/Income Inequality and Poverty
115. Refer to Figure 20-4. In 2001, the percent of adults between ages 18 and 64 in poverty is
a.
higher than both the percentage of children under age 18 and the percentage of elderly aged 65 and
over in poverty.
b.
higher than the percentage of children under age 18 but is lower than the percentage of elderly aged
65 and over in poverty.
c.
is lower than both the percentage of children under age 18 and the percentage of elderly aged 65
and over in poverty.
d.
is lower than the percentage of children under age 18 and is equal to the percentage of elderly aged
65 and over in poverty.
116. Refer to Figure 20-4. In 1968, the percent of children under age 18 in poverty is
a.
higher than both the percentage of adults aged 18 to 64 and the percentage of elderly aged 65 and
over in poverty.
b.
higher than the percentage of adults aged 18 to 64 but is lower than the percentage of elderly aged
65 and over in poverty.
c.
lower than both the percentage of adults aged 18 to 64 and the percentage of elderly aged 65 and
over in poverty.
d.
lower than the percentage of adults aged 18 to 64 but is higher than the percentage of elderly aged
65 and over in poverty.
117. Refer to Figure 20-4. In 1968, the percent of elderly aged 65 and over in poverty is
a.
higher than both the percentage of adults aged 18 to 64 and the percentage of children under age 18
in poverty.
b.
higher than the percentage of adults aged 18 to 64 but is lower than the percentage of children
under age 18 in poverty.
c.
lower than both the percentage of adults aged 18 to 64 and the percentage of children under age 18
in poverty.
d.
is lower than the percentage of adults aged 18 to 64 but is higher than the percentage of children
under age 18 in poverty.
118. Refer to Figure 20-4. In 2001, the percent of elderly aged 65 and over in poverty is
a.
higher than both the percentage of adults aged 18 to 64 and the percentage of children under age 18
in poverty.
b.
higher than the percentage of adults aged 18 to 64 but is lower than the percentage of children
under age 18 in poverty.
c.
lower than both the percentage of adults aged 18 to 64 and the percentage of children under age 18
in poverty.
d.
lower than the percentage of children under age 18 but is equal to the percentage of adults aged 18
to 64 in poverty.
Chapter 20/Income Inequality and Poverty ❖ 31
119. Refer to Figure 20-4. From 1969 to 2001, the percent of elderly aged 64 and over in poverty has
a.
declined, while the percentage of children under age 18 in poverty has also declined.
b.
declined, while the percentage of children under age 18 in poverty has increased.
c.
increased, while the percentage of children under age 18 in poverty has declined.
d.
increased, while the percentage of children under age 18 in poverty has also increased.
120. If the value of in-kind transfers are taken into account, the number of families living in poverty in the United
States would
a.
increase by about 1 percent.
b.
decrease by about 1 percent.
c.
decrease by about 5 percent.
d.
decrease by about 10 percent.
121. In-kind transfers are
a.
obtained only by those who have political connections.
b.
provided only by the U. S. government.
c.
non-monetary items given to the poor.
d.
obtained primarily through soup kitchens and private charities.
122. Government vouchers to purchase food, also known as food stamps, are an example of
a.
an in-kind transfer.
b.
life-cycle income.
c.
a negative income tax.
d.
permanent income.
123. In-kind transfers are transfers to the poor
a.
in the form of goods and services rather than cash.
b.
in the form of goods, services, and cash.
c.
from private charitable organizations only.
d.
from the federal government only.
124. The statement that “measures of the distribution of income are based on money income” relates to which prob-
lem in measuring inequality?
a.
in-kind transfers
b.
economic life cycle
c.
transitory versus permanent income
d.
economic mobility
32 ❖ Chapter 20/Income Inequality and Poverty
125. When considering a person’s standard of living, data on the income distribution and the poverty rate may pro-
vide an incomplete picture because the poor may
a.
receive in-kind transfers.
b.
be lending in order to smooth their income over their life cycle.
c.
be saving in order to smooth their income due to a drop in transitory income.
d.
under-report their income.
126. Suppose the average value of in-kind transfers increases by $2,000 from 2010 to 2011. The poverty rate
a.
is more likely to understate the true level of poverty.
b.
is more likely to overstate the true level of poverty.
c.
will increase by $2,000 divided by the poverty level.
d.
Both b and c are correct.
127. The normal life cycle pattern of income
a.
contributes to more inequality in the distribution of annual income and to more inequality in living
standards.
b.
contributes to more inequality in the distribution of annual income, but it does not necessarily
contribute to more inequality in living standards.
c.
contributes to less inequality in the distribution of annual income and to less inequality in living
standards.
d.
has no effect on either the distribution of annual income or on living standards.
128. In the United States, a typical worker’s income peaks around age
a.
70.
b.
60.
c.
50.
d.
40.
129. People have their highest saving rates when they are
a.
retired.
b.
middle-aged.
c.
married with young children.
d.
young and single.
130. The regular pattern of income variation over a person’s life is called
a.
the earned income cycle.
b.
the substitution effect.
c.
the life cycle.
d.
the pattern of change.
Chapter 20/Income Inequality and Poverty ❖ 33
131. A family’s ability to buy goods and services depends largely on the family’s
a.
economic mobility.
b.
place in the economic life cycle.
c.
transitory income.
d.
permanent income.
132. Susan won $2,000 at the blackjack tables on her birthday. Her winnings are an example of
a.
permanent income.
b.
life-cycle income.
c.
transitory income.
d.
an in-kind transfer.
133. Which of the following statements is correct?
a.
The distribution of annual income accurately reflects the distribution of living standards.
b.
Permanent incomes are more equally distributed than annual incomes.
c.
Transitory changes in income generally have a significant impact on a family’s standard of living.
d.
Annual income is more equally distributed than permanent income.
134. Which of the following is correct?
a.
Incomes tend to be high for young workers.
b.
Incomes tend to rise sharply at retirement.
c.
Incomes tend to peak at around age 50.
d.
Current income is more equally distributed than permanent income.
135. The life cycle effect characterizes a lifetime income profile in which income
a.
tends to follow a seasonal pattern.
b.
rises as a worker gains maturity and experience.
c.
rises and falls in conjunction with the business cycle.
d.
falls during the early years of market activity and peaks at retirement.
136. Because people can borrow when they are young, the life cycle theory would suggest that one’s standard of
living depends on
a.
lifetime income rather than annual income.
b.
aggregate income rather than annual personal income.
c.
annual extended-family income rather than annual personal income.
d.
income averaged across seasons rather than across years.
34 ❖ Chapter 20/Income Inequality and Poverty
137. An example of a transitory change in income is the
a.
annual cost of living adjustment to your salary.
b.
increase in income that results from a job promotion linked to your education.
c.
increase in income of California orange growers that results from an orange-killing frost in Florida.
d.
All of the above are correct.
138. Saving and borrowing is indicative of a family that
a.
is most likely to be poor.
b.
has a difficult time balancing its standard of living.
c.
does not adjust its standard of living to reflect transitory changes in income.
d.
is most likely millionaires.
139. Suppose that a family saves and borrows to buffer itself against changes in income. These actions relate to
which problem in measuring inequality?
a.
in-kind transfers
b.
negative income tax
c.
transitory versus permanent income
d.
economic mobility
140. Suppose that young people often borrow and then repay the loans when they are older. These actions relate to
which problem in measuring inequality?
a.
in-kind transfers
b.
the economic life cycle
c.
a negative income tax
d.
economic mobility
141. Suppose that Family A borrows money when its car breaks down and saves money when the wife receives a
holiday bonus from her employer. Suppose that Family B borrows money to buy elaborate birthday presents
for the children and spends the husband’s holiday bonus on a vacation to Florida. Which of the following is
correct?
a.
Both Family A’s and Family B’s spending habits suggest that they base their purchasing decisions
on transitory income.
b.
Family A’s spending habits suggest that it bases its purchasing decisions on transitory income
rather than permanent income. Family B’s spending habits suggest that it bases its purchasing
decisions on permanent income rather than transitory income.
c.
Family A’s spending habits suggest that it bases its purchasing decisions on permanent income
rather than transitory income. Family B’s spending habits suggest that it bases its purchasing
decisions on transitory income rather than permanent income.
d.
Both Family A’s and Family B’s spending habits suggest that they base their purchasing decisions
on permanent income.
Chapter 20/Income Inequality and Poverty ❖ 35
142. Suppose that Jake and Abby each win $1,000 in a state lottery. Jake spends his winnings on a new television.
Abby saves her winnings for a “rainy day.” Which of the following is correct?
a.
Both Jake’s and Abby’s behavior suggest that they base their purchasing decisions on transitory
income.
b.
Jake’s behavior suggests that he bases his purchasing decisions on transitory income rather than
permanent income. Abby’s behavior suggest that she bases her purchasing decisions on permanent
income rather than transitory income.
c.
Jake’s behavior suggests that he bases his purchasing decisions on permanent income rather than
transitory income. Abby’s behavior suggests that she bases her purchasing decisions on transitory
income rather than permanent income.
d.
Both Jake’s and Abby’s behavior suggest that they base their purchasing decisions on permanent
income.
143. Which of the following statements is not correct?
a.
The percentage of the population that suffers from long-term poverty is far smaller than the
percentage of the population that suffers from short–term poverty because there is a high level of
economic mobility in the United States.
b.
Permanent income is a better measure of a family’s ability to buy the necessities of life than is
transitory income.
c.
The economic life cycle theory explains why gifts of goods and services reduce poverty for the very
young and the very old.
d.
Because people can borrow and save to smooth out changes in income, their standard of living in
any one year depends more on lifetime income than on a particular year’s income.
144. The typical economic life cycle illustrates how people tend to
a.
borrow more when they are younger and save more when they are middle-aged.
b.
earn their peak incomes immediately prior to the typical retirement age of 65.
c.
adjust their consumption based on changes in their transitory income.
d.
All of the above are correct.
145. The Callaway family owns a small bait and tackle shop in a resort town in Wisconsin. An economic recession
reduces the number of tourists for one summer, which reduces the family’s income for that year. For the
Callaway family, their
a.
transitory income for the year of the recession likely exceeds their permanent income.
b.
permanent income likely exceeds their transitory income for the year of the recession.
c.
permanent income will be more affected by the recession than their transitory income.
d.
Both a and c are correct.
36 ❖ Chapter 20/Income Inequality and Poverty
146. The Smith family owns an apple orchard in Illinois. The Jones family owns an apple orchard in Wisconsin. A
late frost destroys half of the Smith family’s harvest for one year. For the Smith family, their
a.
transitory income for the year of the frost likely exceeds their permanent income.
b.
permanent income likely exceeds their transitory income for the year of the frost.
c.
permanent income will be more affected by the frost than their transitory income.
d.
Both a and c are correct.
147. The Smith family owns an apple orchard in Illinois. The Jones family owns an apple orchard in Wisconsin. A
late frost destroys half of the Smith family’s harvest for one year. For the Jones family, their
a.
transitory income for the year of the frost likely exceeds their permanent income.
b.
permanent income likely exceeds their transitory income for the year of the frost.
c.
permanent income will be more affected by the frost than their transitory income.
d.
Both a and c are correct.
148. For a typical worker, her income will be lower when she is younger, peak around age 50, and decrease drasti-
cally when she retires. This pattern of changes in income for a typical worker is called
a.
the life cycle.
b.
permanent income.
c.
transitory income.
d.
in-kind transfers.
149. A family’s ability to buy goods and services depends largely on its
a.
permanent income, which is its normal, or average, income.
b.
permanent income, which is the lowest annual income the family has received over a 10-year
period.
c.
transitory income, which is the measure of income used by the government to analyze the
distribution of income and the poverty rate.
d.
transitory income, which is its money income plus any in-kind transfers it receives.
150. A typical worker’s normal or average income is called
a.
the life cycle.
b.
permanent income.
c.
transitory income.
d.
in-kind transfers.
Chapter 20/Income Inequality and Poverty ❖ 37
151. Economists who study economic mobility have found that, if a father earns 20 percent above his generation‘s
average income, his son will most likely earn
a.
an income equal to his generation’s average income.
b.
8 percent above his generation’s average income.
c.
5 percent below his generation’s average income.
d.
3 percent above his generation’s average income.
152. What percentage of millionaires in the United States are self-made?
a.
about 20 percent
b.
about 40 percent
c.
about 60 percent
d.
about 80 percent
153. Economic mobility in the United States is
a.
uncommon. Over 50 percent of poor families remain poor for 8 or more years.
b.
uncommon. Over 75 percent of poor families remain poor for 8 or more years.
c.
common. Fewer than 3 percent of poor families remain poor for 8 or more years.
d.
common. Fewer than 1 percent of poor families remain poor for 8 or more years.
154. Economists who study economic mobility have found that the income of a grandfather and his grandson’s in-
come are
a.
not closely related.
b.
negatively related.
c.
directly related.
d.
equal.
155. What percent of families are poor for eight or more years?
a.
more than 20 percent
b.
between 15 and 20 prcent
c.
approximately 10 percent
d.
less than 3 percent
156. Data for the United States suggests that about how many millionaires inherited their fortunes?
a.
one in seven
b.
one in five
c.
one in three
d.
one in two
38 ❖ Chapter 20/Income Inequality and Poverty
157. Income mobility studies suggest that poverty
a.
cannot be alleviated by privately sponsored anti-poverty programs.
b.
cannot be alleviated by government sponsored anti-poverty programs.
c.
is a long-term problem for a relatively large number of families.
d.
is not a long-term problem for most families.
158. Economic mobility in the United States is so great that fewer than
a.
3 percent of families are poor for 8 or more years.
b.
5 percent of families are poor for 8 or more years.
c.
8 percent of families are poor for 8 or more years.
d.
10 percent of families are poor for 8 or more years.
159. Economic mobility refers to the
a.
government’s attempt to distribute monetary assistance to areas most in need.
b.
ability of families to freely relocate to find good jobs.
c.
movement of people among income classes.
d.
movement of resources from one country to another.
160. In the United States approximately 80 percent of millionaires did not inherit their wealth. This illustrates the
a.
amount of transitory income in the United States.
b.
effectiveness of government anti-poverty programs in the United States.
c.
great economic mobility in the United States.
d.
level of permanent income in the United States.
161. Which of the following statements is correct?
a.
Less than three percent of families are categorized as poor for eight years or more.
b.
In the United States, the grandson of a millionaire is much more likely to be rich than the grandson
of an average-income person.
c.
The majority of millionaires in the United States inherited their wealth.
d.
Most workers have about the same income (adjusted for inflation) when they are young as when
they are middle-aged.
162. Which of the following does not explain why data on income distribution and the poverty rate give an incom-
plete picture of inequality?
a.
in-kind transfers
b.
economic life cycle
c.
transitory income
d.
All of the above contribute to an incomplete picture of inequality.
Chapter 20/Income Inequality and Poverty ❖ 39
163. In the United States, long-term poverty, defined as a family having an income below the poverty line for eight
or more years, is
a.
common, affecting approximately 25 percent of all American families.
b.
common, affecting approximately 15 percent of all American families.
c.
uncommon, affecting approximately 8 percent of all American families.
d.
rare, affecting approximately 3 percent of all American families.
164. In the United States, long-term poverty affects
a.
more families than short-term poverty.
b.
an equal number of families as short-term poverty.
c.
slightly fewer families than short-term poverty.
d.
many fewer families than short-term poverty.
165. Economic mobility in the United States is
a.
great, so many of those below the poverty line are there only temporarily.
b.
rare, so most of those below the poverty line are there for decades.
c.
rare, yet many of those below the poverty line are there only temporarily.
d.
unrelated to poverty.
INCOME INEQUALITY AND POVERTY
1. Whether or not policymakers should try to make our society more egalitarian is largely a matter of
a.
economic efficiency.
b.
political philosophy.
c.
egalitarian principles.
d.
enhanced opportunity.
2. Which political philosophy believes that the government should equalize the incomes of all members of soci-
ety?
a.
Utilitarianism.
b.
Liberalism.
c.
Libertarianism.
d.
None of the above is correct.
3. When the government taxes income as part of a redistribution program,
a.
the poor pay higher taxes.
b.
the rich always benefit more than the poor.
c.
the poor are encouraged to work.
d.
incentives to earn income are diminished.
40 ❖ Chapter 20/Income Inequality and Poverty
4. When incentives to earn income are distorted by income redistribution programs,
a.
losses can exceed potential gains from greater equality of income.
b.
total income in an economy can fall.
c.
total utility in society can fall.
d.
All of the above are correct.
5. Which of the following will not occur when government policies are enacted to make the distribution of in-
come more equitable?
a.
People will alter their behaviors.
b.
Incentives will be distorted.
c.
Total utility will likely remain constant.
d.
The allocation of resources will be less efficient .
6. A utilitarian government has to balance the gains from greater income equality against the losses from dis-
torted work incentives. To maximize total utility, therefore, the government
a.
would never tax labor income.
b.
must always achieve a fully egalitarian society.
c.
enacts policies that only benefit the middle class.
d.
stops short of a fully egalitarian society.
7. Raising total utility is the prime objective of which political philosophy?
a.
utilitarianism
b.
liberalism
c.
libertarianism
d.
None of the above is correct.
8. “The government should choose policies to maximize the total utility of society.” This statement is
most closely associated with which political philosophy?
a.
liberalism
b.
utilitarianism
c.
libertarianism
d.
welfarism