153. A typical worker’s normal or average income is called
a.
the life cycle.
b.
permanent income.
c.
transitory income.
d.
in-kind transfers.
154. Pietro is 40 years old and is laid off from his job at the paper plant and borrows from his savings for 8 months until
he finds a new job. Pietro’s
a.
transitory income likely exceeds his permanent income for that year.
b.
borrowing is representative of a normal economic life cycle.
c.
permanent income is largely unaffected by this one time change to his income.
d.
economic mobility during this year is highly unusual, as US workers tend to stay in a particular income class.
155. Miguel is a 20 year old college student who works part-time and earns an annual income of $12,000. To smooth out
his life cycle changes in income, Miguel can
a.
save his earnings to use when he is middle-aged.
b.
lend money to a friend to purchase a new car.
c.
borrow money to pay for college, which he will later repay when his income rises.
d.
attempt to pay for college from his current earnings.
156. The study by economists Cox and Alm found that the 2006 pre-tax income of the richest fifth of U.S. households is
a.
5 times the pre-tax income of the poorest fifth.
b.
10 times the pre-tax income of the poorest fifth.
c.
15 times the pre-tax income of the poorest fifth.
d.
20 times the pre-tax income of the poorest fifth.
157. The study by economists Cox and Alm found that the 2006 after-tax income of the richest fifth of U.S. households is
a.
equal to the after-tax income of the poorest fifth.
b.
7 times the after-tax income of the poorest fifth.
c.
14 times the after-tax income of the poorest fifth.
d.
21 times the after-tax income of the poorest fifth.
158. The study by economists Cox and Alm found
a.
inequality in consumption is much smaller than inequality in annual income.
b.
inequality in consumption is slightly smaller than inequality in annual income.
c.
inequality in consumption is slightly larger than inequality in annual income.
d.
inequality in consumption is much larger than inequality in annual income.
159. The study by economists Cox and Alm found
a.
the gap between rich and poor shrinks greatly if using after-tax income compared with pre-tax income.
b.
the gap between rich and poor shrinks slightly if using after-tax income compared with pre-tax income.
c.
the gap between rich and poor widens slightly if using after-tax income compared with pre-tax income.
d.
the gap between rich and poor widens greatly if using after-tax income compared with pre-tax income.
160. Which of the following is not a finding of Cox and Alm regarding the gap between rich and poor?
a.
The gap shrinks if taxes are taken into account.
b.
The gap shrinks if consumption, rather than income, is compared.
c.
The gap shrinks if the number of people in the household is taken into account.
d.
The gap shrinks if the state of residence is taken into account.
161. Economists who study economic mobility have found that, if a father earns 20 percent above his generation’s average
income, his son will most likely earn
a.
an income equal to his generation’s average income.
b.
8 percent above his generation’s average income.
c.
5 percent below his generation‘s average income.
d.
3 percent above his generation’s average income.
162. What percentage of millionaires in the United States are self-made?
a.
about 20 percent
b.
about 40 percent
c.
about 60 percent
d.
about 80 percent
163. Economic mobility in the United States is
a.
uncommon. Over 50 percent of poor families remain poor for 8 or more years.
b.
uncommon. Over 75 percent of poor families remain poor for 8 or more years.
c.
common. Fewer than 3 percent of poor families remain poor for 8 or more years.
d.
common. Fewer than 1 percent of poor families remain poor for 8 or more years.
164. Economists who study economic mobility have found that the income of a grandfather and his grandson’s income are
a.
not closely related.
b.
negatively related.
c.
directly related.
d.
equal.
165. What percent of families are poor for eight or more years?
a.
more than 20 percent
b.
between 15 and 20 percent
c.
approximately 10 percent
d.
less than 3 percent
166. Data for the United States suggests that about how many millionaires inherited their fortunes?
a.
one in seven
b.
one in five
c.
one in three
d.
one in two
167. Income mobility studies suggest that poverty
a.
cannot be alleviated by privately sponsored anti-poverty programs.
b.
cannot be alleviated by government sponsored anti-poverty programs.
c.
is a long-term problem for a relatively large number of families.
d.
is not a long-term problem for most families.
168. Economic mobility in the United States is so great that fewer than
a.
3 percent of families are poor for 8 or more years.
b.
5 percent of families are poor for 8 or more years.
c.
8 percent of families are poor for 8 or more years.
d.
10 percent of families are poor for 8 or more years.
169. Economic mobility refers to the
a.
government’s attempt to distribute monetary assistance to areas most in need.
b.
ability of families to freely relocate to find good jobs.
c.
movement of people among income classes.
d.
movement of resources from one country to another.
170. In the United States approximately 80 percent of millionaires did not inherit their wealth. This illustrates the
a.
amount of transitory income in the United States.
b.
effectiveness of government anti-poverty programs in the United States.
c.
great economic mobility in the United States.
d.
level of permanent income in the United States.
171. Which of the following statements is correct?
a.
Less than three percent of families are categorized as poor for eight years or more.
b.
In the United States, the grandson of a millionaire is much more likely to be rich than the grandson of an
average-income person.
c.
The majority of millionaires in the United States inherited their wealth.
d.
Most workers have about the same income (adjusted for inflation) when they are young as when they are
middle-aged.
172. Which of the following does not explain why data on income distribution and the poverty rate give an incomplete
picture of inequality?
a.
in-kind transfers
b.
economic life cycle
c.
transitory income
d.
All of the above contribute to an incomplete picture of inequality.
173. In the United States, long-term poverty, defined as a family having an income below the poverty line for eight or
more years, is
a.
common, affecting approximately 25 percent of all American families.
b.
common, affecting approximately 15 percent of all American families.
c.
uncommon, affecting approximately 8 percent of all American families.
d.
rare, affecting approximately 3 percent of all American families.
174. In the United States, long-term poverty affects
a.
more families than short-term poverty.
b.
an equal number of families as short-term poverty.
c.
slightly fewer families than short-term poverty.
d.
many fewer families than short-term poverty.
175. Economic mobility in the United States is
a.
great, so many of those below the poverty line are there only temporarily.
b.
rare, so most of those below the poverty line are there for decades.
c.
rare, yet many of those below the poverty line are there only temporarily.
d.
unrelated to poverty.
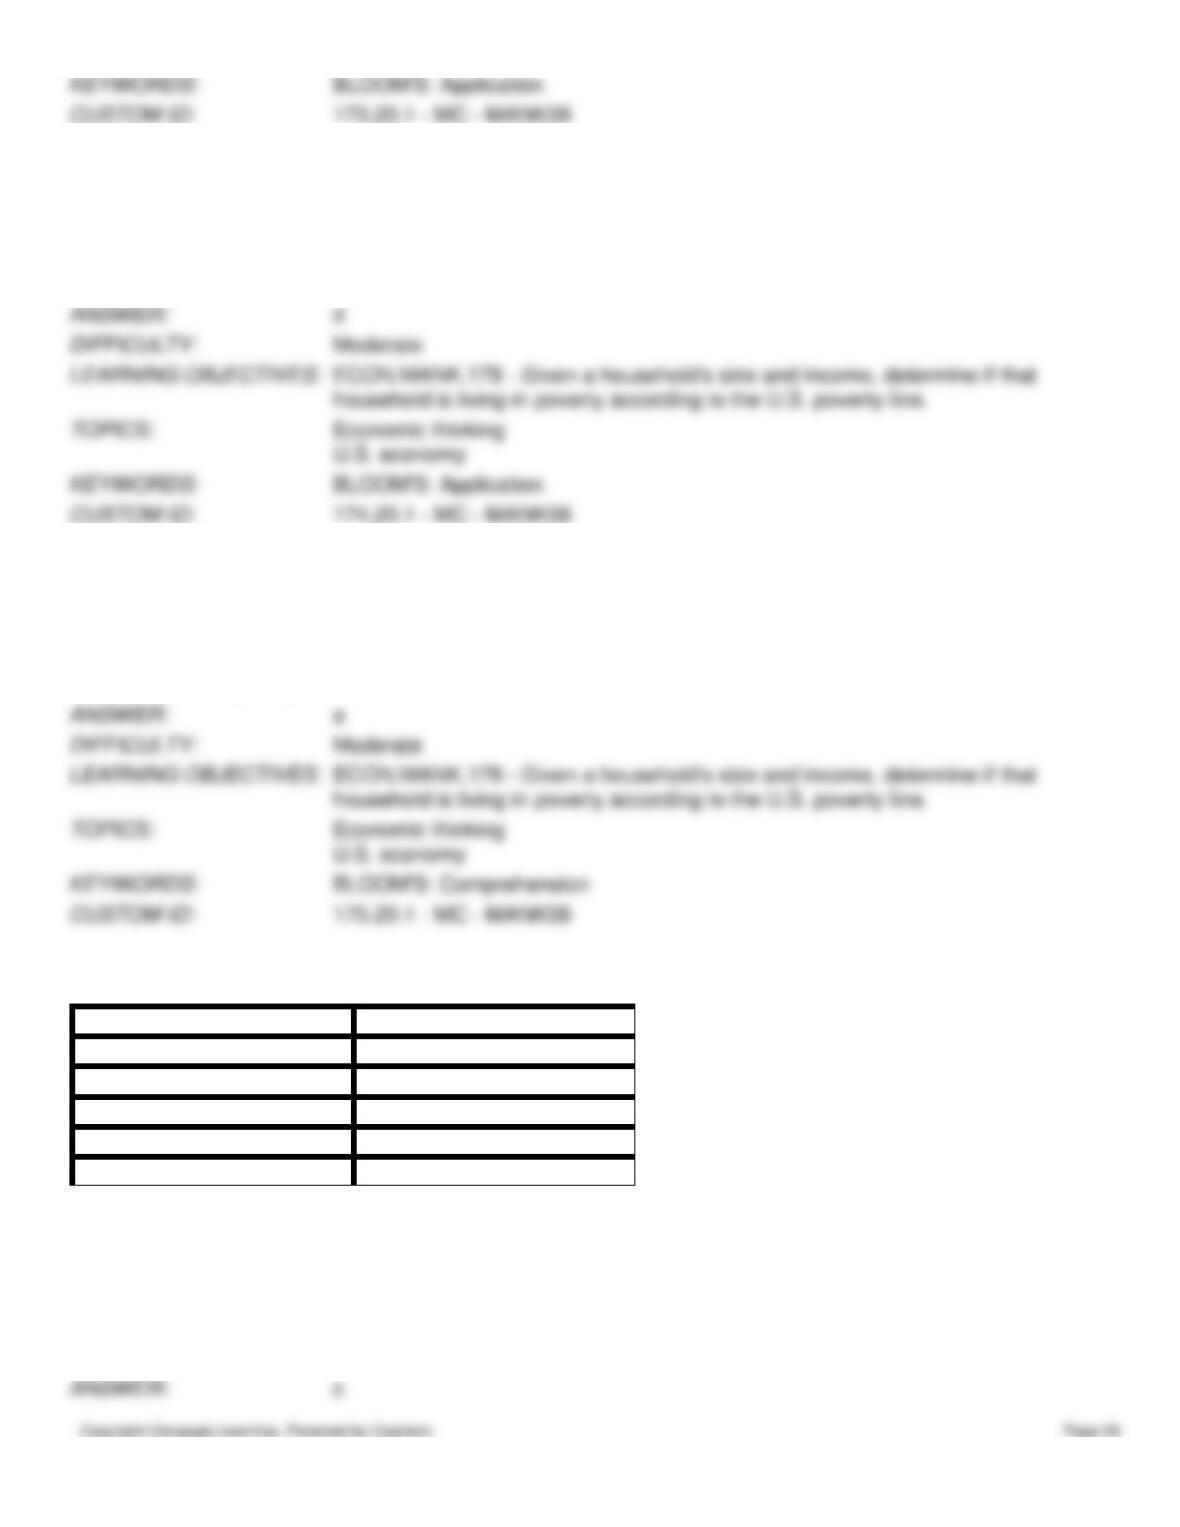
Table 20–13
The following table shows the distribution of income in Widgetapolis.
Quintile
Annual Family Income
Top Quintile (20%)
$110,000 and above
Second Quintile
$82,000 to $109,999
Third Quintile
$60,000 to $81,999
Fourth Quintile
$39,000 to $59,999
Bottom Quintile
Under $39,000
176. Refer to Table 20-13. Sixty percent of all families have incomes below what level?
a.
$39,000
b.
$60,000
c.
$82,000
d.
$110,000
177. Refer to Table 20-13. Twenty percent of all families have incomes above what level?
a.
$39,000
b.
$60,000
c.
$82,000
d.
$110,000
178. Refer to Table 20-13. Eighty percent of all families have incomes below what level?
a.
$39,000
b.
$60,000
c.
$82,000
d.
$110,000
179. Refer to Table 20-13. If the poverty line were $19,915, what would be the poverty rate?
a.
less than 20%
b.
between 20% and 40%
c.
between 40% and 60%
d.
between 60% and 80%
180. Refer to Table 20-13. If the poverty line were $45,141, what would be the poverty rate?
a.
less than 20%
b.
between 20% and 40%
c.
between 40% and 60%
d.
between 60% and 80%
181. Refer to Table 20-13. If the poverty rate is 19%, where is the poverty line in Widgetapolis?
a.
under $39,000
b.
between $39,000 and $59,999
c.
between $60,000 and $81,999
d.
between $82,000 and $109,999
182. Refer to Table 20-13. If the poverty rate is 33%, where is the poverty line in Widgetapolis?
a.
under $39,000
b.
between $39,000 and $59,999
c.
between $60,000 and $81,999
d.
between $82,000 and $109,999
Table 20–14
James, Luke, Peter, Micah, and Sarah are the only five inhabits of Marketsville. The following table shows their income.
Quintile
Annual Family Income
James
$80,014
Luke
$21,455
Peter
$121,253
Micah
$63,512
Sarah
$91,431
183. Refer to Table 20-14. According to the table, what percentage of individuals in Marketsville have an income above
$90,000?
a.
40 percent.
b.
60 percent.
c.
80 percent.
d.
100 percent.
184. Refer to Table 20-14. According to the table, what percentage of individuals in Marketsville have an income below
$64,000?
a.
20 percent
b.
40 percent
c.
60 percent
d.
80 percent
185. Refer to Table 20-14. Where would the government of Marketsville set the poverty line to have a poverty rate of 20
percent?
a.
$23,000
b.
$35,000
c.
$44,000
d.
$55,000