
Macroeconomics: Policy and Practice, 2e (Mishkin)
Chapter 20 The Labor Market, Employment, and Unemployment
20.1 Developments in the U.S. Labor Market
1) The employment ratio is the ________.
A) labor force divided by the population
B) proportion of the civilian working-age population that is employed
C) number of individuals employed divided by the size of the labor force
D) number of individuals employed divided by the number of the unemployed
2) The unemployment rate in the U.S. is equal to ________.
A) the number of individuals unemployed in the U.S. divided by the U.S. population
B) the number of individuals unemployed divided by the U.S. labor force
C) the size of the U.S. population divided by the number of individuals unemployed
D) the size of the U.S. labor force divided by the number of individuals unemployed
3) Over the last 50 years, the employment ratio has risen most significantly among ________.
A) men
B) women
C) blacks
D) Hispanics
4) Over the last 50 years, the employment ratio has fallen most significantly among ________.
A) men
B) women
C) blacks
D) Hispanics
5) In the U.S., the employment ratio is highest among ________, and lowest among ________.
A) women; both sexes combined
B) men; college-educated workers
C) women; men
D) men; women

6) Over the past five decades, the U.S. civilian unemployment rate has varied between, roughly,
________.
A) 3% and 11%
B) 55% and 60%
C) 6% and 8%
D) 0.2% to 0.4%
7) The highest unemployment rate recorded since World War II came in ________.
A) September 1929
B) January 1961
C) December 1982
D) October 2009
8) From 1965 to 2013, the average real wage for all workers has ________.
A) fallen
B) risen
C) remained essentially unchanged
D) risen in economic contractions and fallen in economic expansions
9) Over the past 50 years, the average real wage for males who do not have a college diploma
has ________.
A) fallen
B) risen
C) remained essentially unchanged
D) risen in economic contractions and fallen in economic expansions
10) Over the past 50 years, the largest increase in average real wage has occurred among
________.
A) male college graduates
B) female college graduates
C) males with post-college education
D) females with post-college education
11) The unemployment rate ________.
A) is essentially unchanged over the business cycle
B) rises in economic expansions and falls in economic contractions
C) falls consistently over both economic expansions and recessions
D) varies over the course of the business cycle
20.2 Supply and Demand in the Labor Market
1) The demand for labor schedule is the same as ________.
A) real wage line
B) supply of labor schedule
C) the minimum wage rate in that economy
D) the marginal product of labor schedule
2) The equation Y = A is known as the ________.
A) Cobb-Douglas production function
B) labor supply curve
C) marginal product of labor
D) capital-to-employment function
3) If the marginal product of labor exceeds that cost of hiring an additional worker, the firm
should ________.
A) fire some workers
B) raise the wage rate
C) add more workers
D) lower the wage rate
4) Moving along the supply curve for labor, increases in the quantity of labor result from
________.
A) diminishing returns to labor effort
B) a rising cost of leisure
C) a reduced preference for leisure
D) more efficient recruitment of workers
5) The upward-sloping character of the labor supply schedule assumes that the ________.
A) the substitution effect is equal to the income effect
B) the substitution effect is larger than the income effect
C) the substitution effect is smaller than the income effect
D) the ratio of real wages to the marginal product of labor is equal to the equilibrium nominal
wage
6) In the market for their services, workers face a trade-off between ________.
A) higher and lower wage jobs
B) equilibrium and non-equilibrium solutions
C) labor and leisure
D) diminishing and increasing marginal productivity
7) Suppose the marginal product of labor (MPL) is greater than the real wage. If the real wage
remains constant, then we should expect ________.
A) an increase in employment and decrease in the MPL
B) an increase in the supply of labor and decrease in the MPL
C) an increase in leisure and no change in the MPL
D) an increase in the supply of labor and no change in the MPL
8) Suppose the marginal product of labor is , where Y is 12, and L is the quantity of
workers. The supply of labor is given by L = 110 + 2.5 × w. If the real wage is 50, what is the
unemployment rate?
20.3 Response of Employment and Wages to Changes in Labor Demand and Labor Supply
1) An increase in output due to either a positive supply or demand shock to production will lead
to ________.
A) an increase in the demand for labor and higher real wages
B) a decrease in the demand for labor and higher real wages
C) an increase in the demand for labor and lower real wages
D) a decrease in the demand for labor and lower real wages
2) An increase in labor supply will cause, other things the same ________.
A) real wages and employment to rise
B) real wages to fall and employment to rise
C) real wages to rise and employment to fall
D) real wages and employment to fall
3) Among the causes of an increase in labor supply is ________.
A) a relaxation of restrictions on child labor
B) an increase in enrollment at colleges
C) an improvement in worker productivity
D) a contraction of economic activity
4) Among the causes of an increase in labor demand is ________.
A) a relaxation of restrictions on child labor
B) an increase in enrollment at colleges
C) an improvement in worker productivity
D) a contraction of economic activity
5) Among the causes of an increase in labor demand is ________.
A) improved availability and affordability of day care for children
B) an increase in enrollment at colleges
C) an increase in the college wage premium
D) an expansion of economic activity
6) Among the causes of an increase in labor supply is ________.
A) improved availability and affordability of day care for children
B) an increase in enrollment at colleges
C) an increase in the college wage premium
D) an expansion of economic activity
7) Having observed that both the real wage and the quantity of employment are increasing, we
may conclude that ________ is not ________.
A) demand; decreasing
B) supply; decreasing
C) demand; increasing
D) supply; increasing
8) Prior to the 1980s ________.
A) the hourly wage of women exceeded that of their male counterparts
B) the employment ratio for women was equal to that of men
C) a majority of women were not in the labor force
D) the majority of men were not in the labor force
9) The increased labor force participation rates for women since the 1970s led most directly to
________.
A) an increase in labor demand
B) a decrease in labor demand
C) a decrease in labor supply
D) an increase in labor supply
10) A decrease in discrimination against women after the 1970s led most directly to ________.
A) an increase in labor demand
B) a decrease in labor demand
C) a decrease in education
D) a decrease in labor supply
11) Which of these is not a good example of skill-biased technical change?
A) GPS navigation equipment in delivery trucks
B) web-enabled virtual classrooms
C) self-service check out scanners
D) use of robots in automobile assembly
12) Over the course of recent years, the college premium has ________.
A) remained essentially unchanged
B) risen
C) fallen
D) excluded civilians from calculations of the labor force
13) The percentage of hours worked by college educated workers since the 1960s has ________.
A) fallen
B) stayed essentially unchanged
C) increased
D) moved in the opposite direction of the college premium
14) The wage gap between high school and college graduates can be explained, other things the
same, by ________.
A) a greater increase in the demand for high school educated labor than college-educated labor
B) a greater increase in the supply of college-educated labor than high school educated labor
C) a greater increase in the demand for high school educated labor than in the supply of high
school educated labor
D) a greater increase in the demand for college-educated labor than high school educated labor
15) The skill-biased character of technological change in recent decades has tended to cause
________.
A) a decrease in the demand for college-educated labor
B) a higher rate of unemployment among college-educated labor
C) a lower rate of unemployment among unskilled labor
D) an increase in demand for college-educated labor
16) The process of globalization has ________.
A) decreased inequality
B) increased inequality
C) had little measurable effect on income inequality
D) has increased income inequality in developing countries but decreased inequality in
developed countries
17) Assume that college-educated labor and high school-educated labor are complements in
production. That is, the two types of labor work together, so that an increase in the quantity of
either type increases the productivity of the other type of labor. Is this consistent with the
observed increase in the college wage premium?
18) How might a decrease in the labor force participation of males be related to the increase in
the participation rate for females?

20.4 Dynamics of Unemployment
1) Those who just stop looking for employment are known as ________.
A) cyclically unemployed
B) discouraged workers
C) frictionally unemployed
D) chronically unemployed
2) During a recession, when unemployment is rising, the number of new jobs created is,
typically, ________.
A) large, but smaller than the number of jobs lost
B) small, and below the number of jobs lost
C) small, but higher than the number of jobs lost
D) large, but smaller than net entrants to the labor force
3) During a recession, when unemployment is rising, the number of new jobs created is,
typically, ________.
A) large, and higher than the number of jobs lost
B) small, and below the number of jobs lost
C) small, but higher than the number of jobs lost
D) large, and higher than net entrants to the labor force
4) Net entrants to the labor force is likely to be highest when the economy ________.
A) is entering a recession
B) nears the peak of an expansion
C) has passed the peak of an expansion
D) begins to recover from a recession
5) The principal cause of falling unemployment is ________.
A) an increase in net entrants to the labor force
B) a decrease in net entrants to the labor force
C) an increase in the number of new jobs created
D) a decrease in the number of jobs lost

6) The employment ratio is always ________ than labor force participation, because only the
latter ________
A) larger; omits discouraged workers
B) smaller; includes the unemployed
C) smaller; omits people too young to work
D) larger; includes people looking for work
7) The label “discouraged worker” refers to a change of status from ________.
A) employed to actively seeking employment
B) unemployed to employed
C) unemployed to not in the labor force
D) not in the labor force to unemployed
8) The largest number of individuals of working age in the U.S. population are ________.
A) discouraged workers
B) unemployed
C) employed
D) not in the U.S. labor force
9) For most of the unemployed, unemployment spells are ________.
A) longer than a year
B) longer than 10 years
C) permanent
D) shorter than three months
10) Individuals who suffer from unemployment spells lasting more than six months are
________.
A) chronically unemployed
B) frictionally unemployed
C) discouraged workers
D) no longer counted as part of the labor force
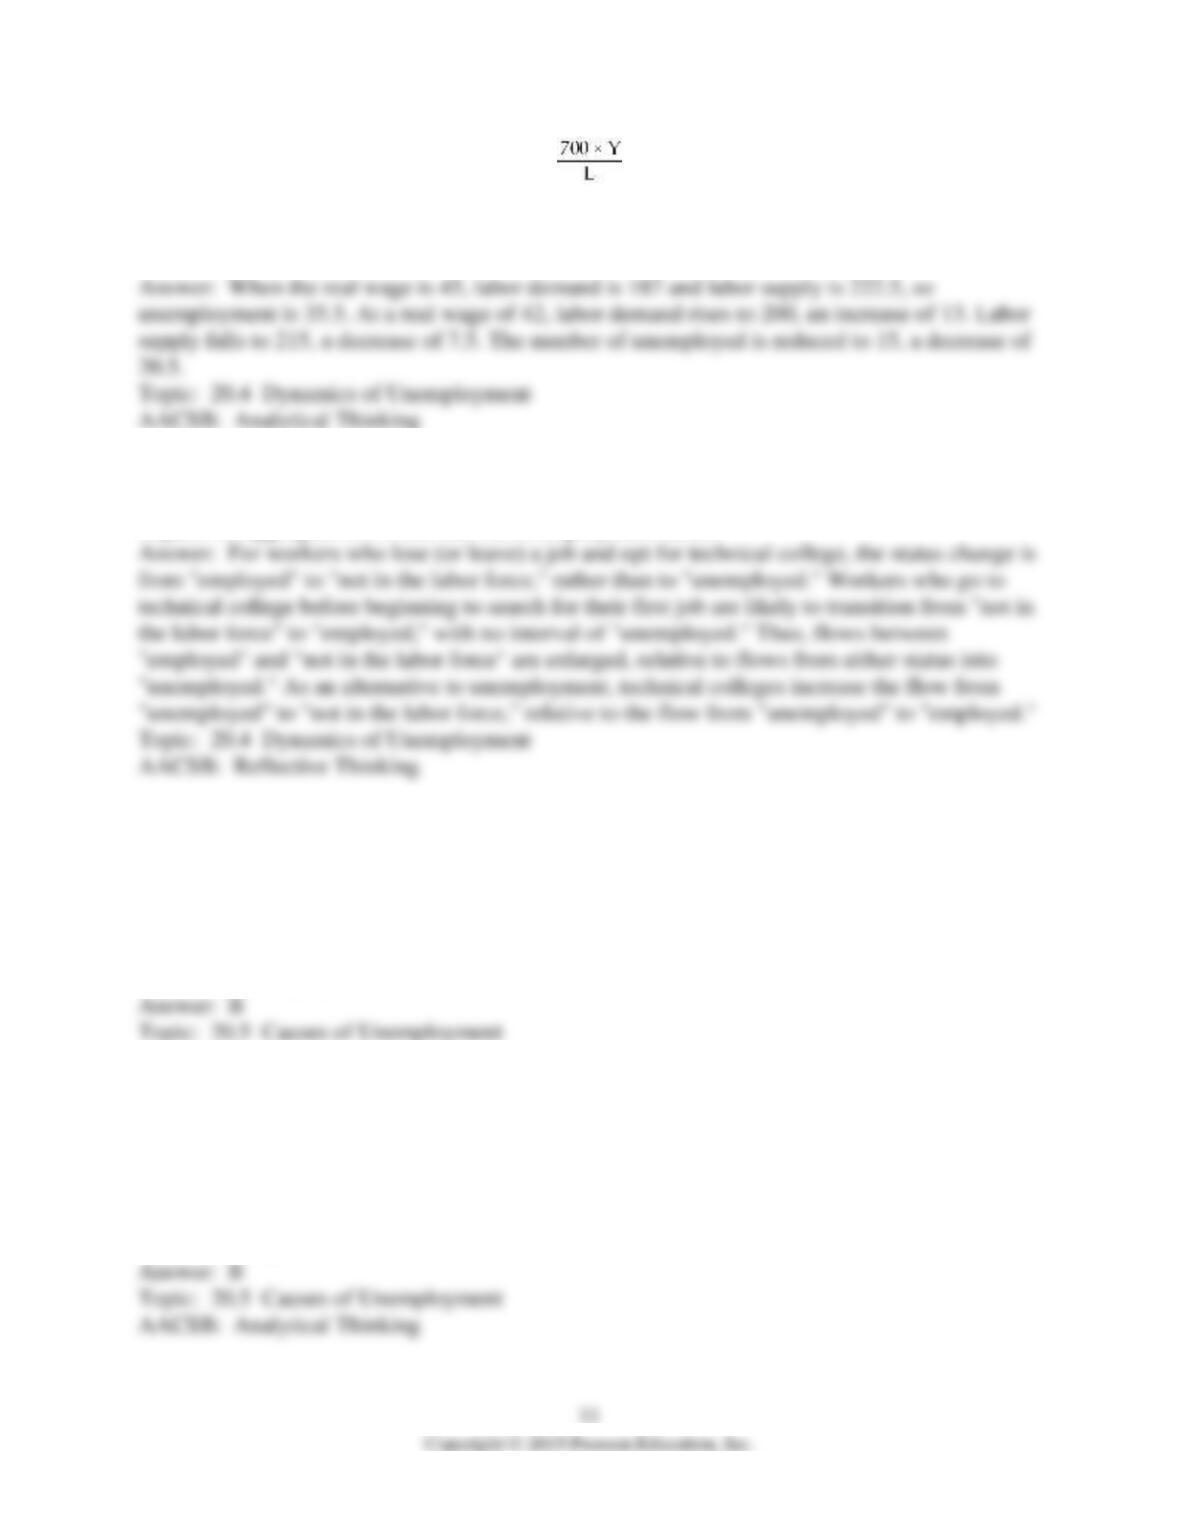
11) Suppose the marginal product of labor is , where Y is 12, and L is the quantity of
workers. The supply of labor is given by L = 110 + 2.5 × w. Calculate the changes that occur in
(a) employment, (b) unemployment, and (c) the size of the labor force, when the real wage
declines from 45 to 42.
12) Technical and “junior” colleges offering full-time degree programs that may be completed in
two years or less are a rapidly growing segment of the U.S. economy. What are some likely
impacts on aggregate flows into and out of employment status?
20.5 Causes of Unemployment
1) Unemployment related to job search is known as ________.
A) cyclical unemployment
B) frictional unemployment
C) structural unemployment
D) tertiary unemployment
2) Researchers have found that once workers become ineligible for unemployment insurance,
they become twice as likely to take a job. From this finding we may infer that unemployment
insurance causes a(n) ________ in ________ unemployment.
A) decrease; structural
B) increase; frictional
C) increase; structural
D) decrease; cyclical
3) Empirical evidence strongly supports the view that unemployment insurance ________.
A) decreases unemployment
B) has little effect on employment
C) increases unemployment
D) has little effect on unemployment
4) Unemployment that arises from a lack of skills is known as ________.
A) seasonal unemployment
B) cyclical unemployment
C) discouraged unemployment
D) structural unemployment
5) Unemployment that emerges during sectoral shifts in the economy is known as ________.
A) structural unemployment
B) discouraged unemployment
C) cyclical unemployment
D) frictional unemployment
6) Unemployment that develops as old industries die off is known as ________.
A) cyclical unemployment
B) structural unemployment
C) frictional unemployment
D) voluntary unemployment
7) One source of structural unemployment is ________.
A) the seasonal character of production in some industries, e.g. agriculture in Alaska during
winter months
B) falling sales in an economic downturn
C) wage rigidity
D) high search costs
13
8) An increase in an effective federal minimum wage would tend to cause ________.
A) a decrease in wage rates and an increase in employment
B) an increase in wage rates and employment
C) a decrease in wage rates and employment
D) an increase in wage rates and a decrease in employment
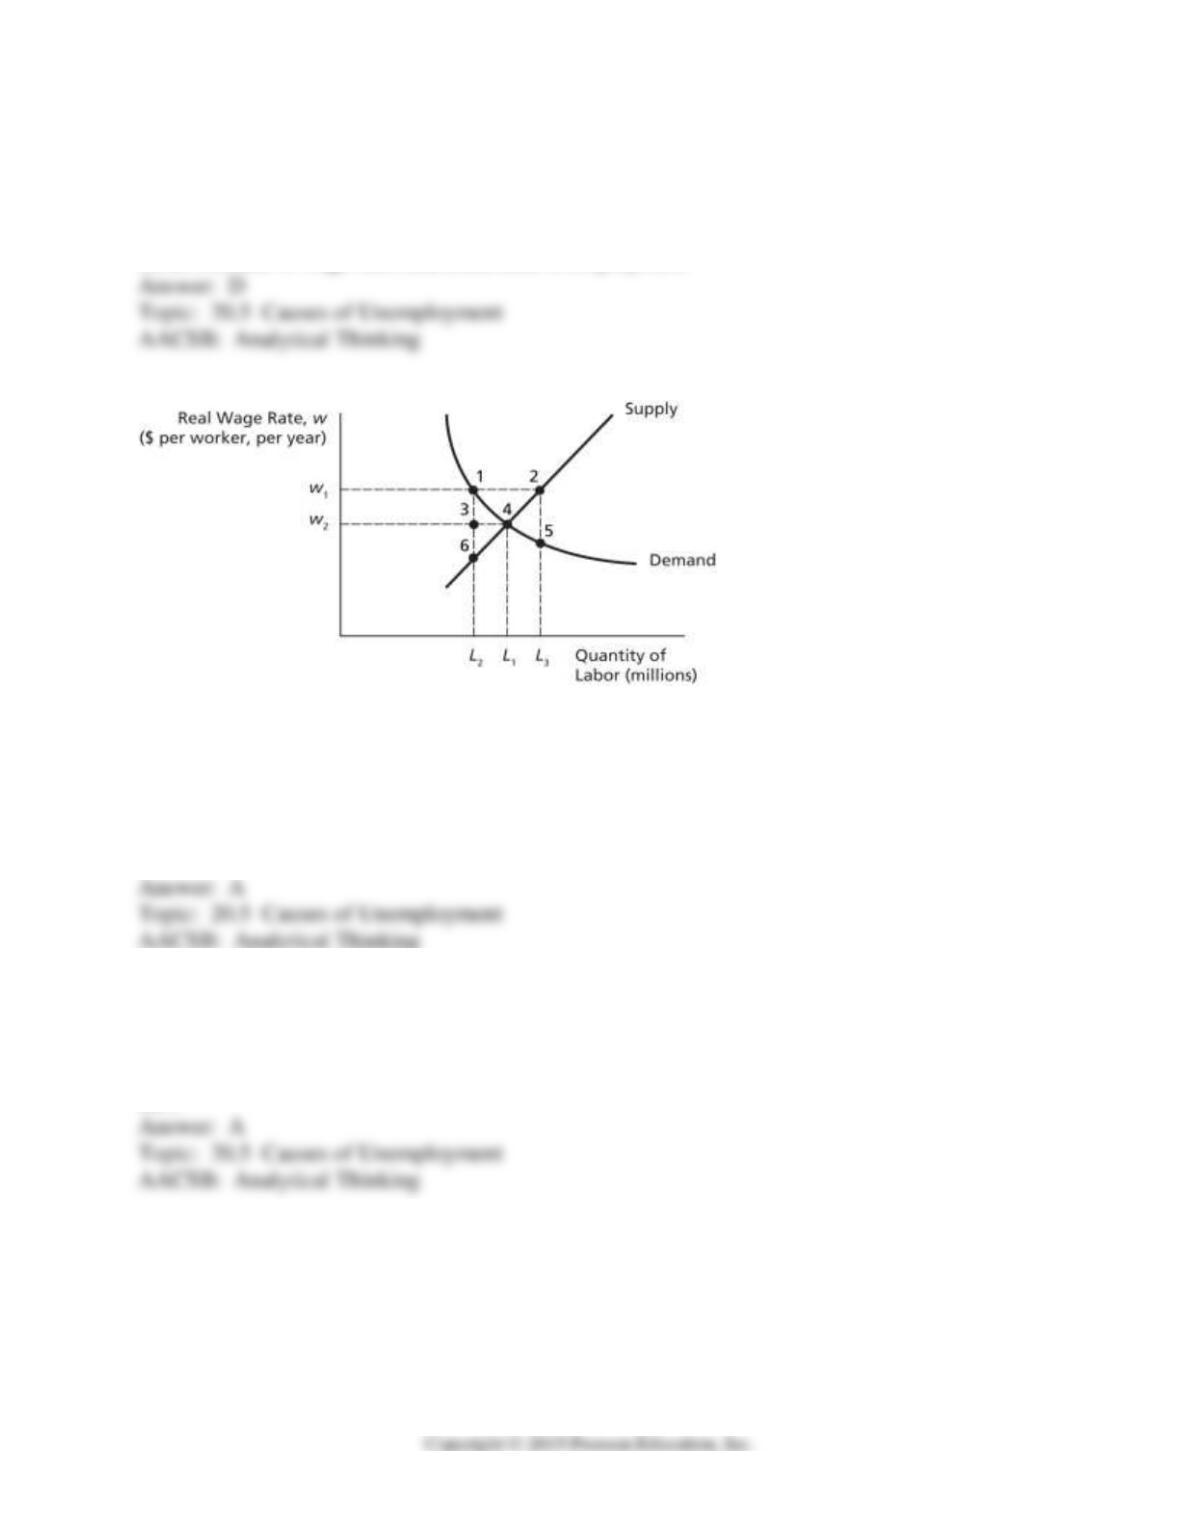
Labor Market
9) On the graph above, the wage level at point ________ might represent a binding minimum
wage.
A) 2
B) 4
C) 6
D) 5
10) On the graph above, the wage level at point ________ might represent an efficiency wage.
A) 2
B) 4
C) 6
D) 5
11) On the graph above, suppose the labor market is in equilibrium at point 2, then the demand
curve shifts down to the position shown on the graph. If the real wage has not changed, then the
horizontal distance between points ________ measures the unemployment that results.
A) 2 & 4
B) 2 & 1
C) 3 & 4
D) 6 & 4
12) Referring to the graph above, assume that, at first, the labor market is in equilibrium at point
4. In which scenario does unemployment rise, with no change in the quantity of employment?
A) real wage rises to the level of points 1 and 2
B) supply shifts to pass through point 5, with no change in the real wage
C) demand shifts to pass through point 3, with no change in the real wage
D) supply shifts to pass through point 3, with no change in the real wage
13) Referring to the graph above, assume that, at first, the labor market is in equilibrium at point
4. Then, demand shifts to pass through point 3, and the real wage adjusts to the new equilibrium.
________ is ________ at the new equilibrium, compared to the original equilibrium.
A) unemployment; larger
B) unemployment; smaller
C) the labor force; smaller
D) employment; larger
14) The setting of minimum wages in the U.S. began with the ________.
A) Sherman Anti-Trust Act of 1890
B) Garn St. Germain Act of 1982
C) Depository Institutions Deregulation and Monetary Control Act of 1980
D) Fair Labor Standards Act of 1938
15) Efficiency wages are ________.
A) market clearing wages
B) wages that are above the market-clearing level
C) equal to the real wage rate minus the nominal wage rate
D) equal to the nominal wage rate divided by some measure of the general price level
15
16) A classic early example of efficiency wages came in ________.
A) Nazi Germany
B) 1973 with the increase in OPEC-determined oil prices
C) 1914 at the Ford Motor Company
D) 1890 with the Sherman Antitrust Act
17) In the wake of Henry Ford’s payment of efficiency wages in 1914 ________.
A) absenteeism and productivity fell
B) absenteeism and productivity rose
C) absenteeism rose and productivity fell
D) absenteeism fell and productivity rose
18) The process of bargaining for a large group of workers at one time rather than individually is
known as ________.
A) collective bargaining
B) autarky
C) tertiary negotiations
D) ornamental horticulture
19) Suppose researchers discover that a government program to match job seekers and
employers has caused an increase in the unemployment rate. Does this mean that the program
has failed?
16
20) Katz and Krueger found that minimum wage laws had a negligible impact on teenage
unemployment in the fast-food industry. Describe the characteristics of labor demand and supply
that might produce such a result.
21) Typically, employers compete with each other in the labor market to get and to retain the
best possible workers. Explain how such competition might prevent the unemployment rate from
ever being close to zero.
20.6 Natural Rate of Unemployment
1) The actual unemployment rate is equal to ________.
A) the natural rate of unemployment plus the cyclical rate
B) the natural rate of unemployment minus the cyclical rate
C) the natural rate of unemployment times the cyclical rate
D) the natural rate of unemployment divided by the cyclical rate
2) The natural rate of unemployment ________.
A) is equal to 0.078 percent
B) is a constant
C) varies across time and countries
D) is equal to the cyclical rate of unemployment divided by the actual rate

17
3) Many economists view ________ as explaining most of the increase in the natural rate of
unemployment in the U.S. from 1960 to 1980.
A) the rise in the percentage of young workers in the labor force
B) an increase in the percentage of the working-age population receiving disability insurance
C) a decrease in the size of the prison population
D) increased use of temporary workers
4) Which of the following does not influence the natural rate of unemployment in the U.S.?
A) demographics
B) the natural rate in Europe and Japan
C) the composition of the labor force
D) surprises in productivity growth
5) Which of the following is not an aspect of the composition of the labor force?
A) the prison population
B) workers taking disability
C) the use of temporary workers
D) the natural rate of unemployment
6) People who end up in prison are particularly subject to ________.
A) higher cyclical unemployment
B) higher structural unemployment
C) lower cyclical unemployment
D) lower seasonal unemployment
7) Workers who suffer disability are likely to suffer higher ________.
A) cyclical unemployment
B) tertiary unemployment
C) structural unemployment
D) natural unemployment

8) An increase in the prison population would tend to cause, other things the same, a decrease in
________.
A) federal disabilities benefits
B) the use of temporary workers
C) the college premium
D) the natural rate of unemployment
9) Which of the following is likely to cause a decrease in the natural rate of unemployment?
A) an increase in the percentage of the working-age population receiving disability insurance
B) a decrease in the use of temporary workers
C) a growing percentage of young workers in the labor force
D) generous unemployment insurance benefits
10) Since 1980, the share of temporary workers in total U.S. employment has ________.
A) declined
B) increased
C) remained essentially unchanged
D) been impossible to determine
11) When productivity growth has been rapid and then slows, the natural rate of unemployment
is likely to ________.
A) decrease
B) be unaffected
C) increase
D) vary unpredictably
12) The natural rate of unemployment ________.
A) is roughly the same in the U.S. and Europe
B) is higher in the U.S. than in Europe
C) cannot be calculated for European economies given their generous system of transfer
payments
D) is higher in Europe than in the U.S.

13) If productivity growth accelerates, but workers do not realize it ________.
A) they will expect large wage hikes
B) they will not expect large wage hikes
C) the natural rate of unemployment will rise
D) the number of discouraged workers will rise
14) When workers expect the real wage to rise at a rate similar to productivity improvements,
________.
A) the decrease in labor supply raises the real wage
B) the increase in labor supply lowers the real wage
C) the increase in labor supply raises the real wage
D) the decrease in labor supply lowers the real wage
15) Over long periods of time, the cyclical rate of unemployment, on average, ________.
A) approaches infinity
B) approaches a value of one
C) should be close to zero
D) approaches the natural rate
16) The natural rate of unemployment is higher in Europe than in the U.S. due to ________.
A) the greater relative strength of American unions
B) the greater relative generosity of U.S. unemployment benefits
C) the greater severity of the business cycle in Europe relative to the U.S.
D) stricter European work rules
17) How might the increase in the natural rate of unemployment in Europe be related to the
increase in income inequality in the United States?
20
18) Suppose the marginal product of labor is , where Y is 12, and L is the quantity of
workers. The supply of labor is given by L = 110 + 2.5 × w, and the real wage is 41. Assume
there has been steady technological progress, increasing the real wage by five percent per year,
with no changes in employment or unemployment. This year, however, the rate of productivity
growth is an unexpected zero percent. Calculate the rate of unemployment that results when the