6) A curve that shows a set of consumption alternatives that give the same level of satisfaction is
A) a substitution curve.
B) a budget line.
C) an indifference curve.
D) an income curve.
20.6 Appendix F: Properties of Indifference Curves
1) An indifference curve cannot be positively sloped because
A) the law of diminishing marginal utility would be violated.
B) the substitution effect would be violated.
C) a point to the right of another point will represent a lower quantity of both goods and a
reduction in utility.
D) a point to the right of another point will represent a higher quantity of both goods and an
increase in utility.
2) An indifference curve between one dozen eggs and several dozens of eggs would be
A) bowed in to the origin.
B) bowed out from the origin.
C) a downward sloping straight line.
D) a straight line from the origin.
3) If the marginal utility of each good is constant as consumption increases, the indifference
curves are
A) horizontal.
B) vertical.
C) straight lines.
D) positively sloped.
4) Which of the following is NOT true about indifference curves?
A) Indifference curves slope downward.
B) Indifference curves show equally preferred combinations of two goods.
C) Indifference curves are not straight lines because the marginal rate of substitution falls.
D) Indifference curves shift when prices change.
5) Indifference curves
A) are vertical.
B) are horizontal.
C) slope upward.
D) slope downward.
6) Assume that good X and good Y each have diminishing marginal utility for a consumer. In
this case,
A) an indifference curve linking the two goods will have a constant slope.
B) an indifference curve will be convex to the origin.
C) the demand curves for these goods will be positively sloped.
D) the demand curves for these goods will be horizontal.
7) Which of the following is FALSE about indifference curves?
A) They are downward sloping.
B) They are convex to the origin.
C) They intersect.
D) They can shift.
8) The indifference curve between eggs and dozens of eggs would be
A) bowed in to the origin.
B) bowed out from the origin.
C) a rectangular hyperbola.
D) a downward sloping straight line with a slope of -12.
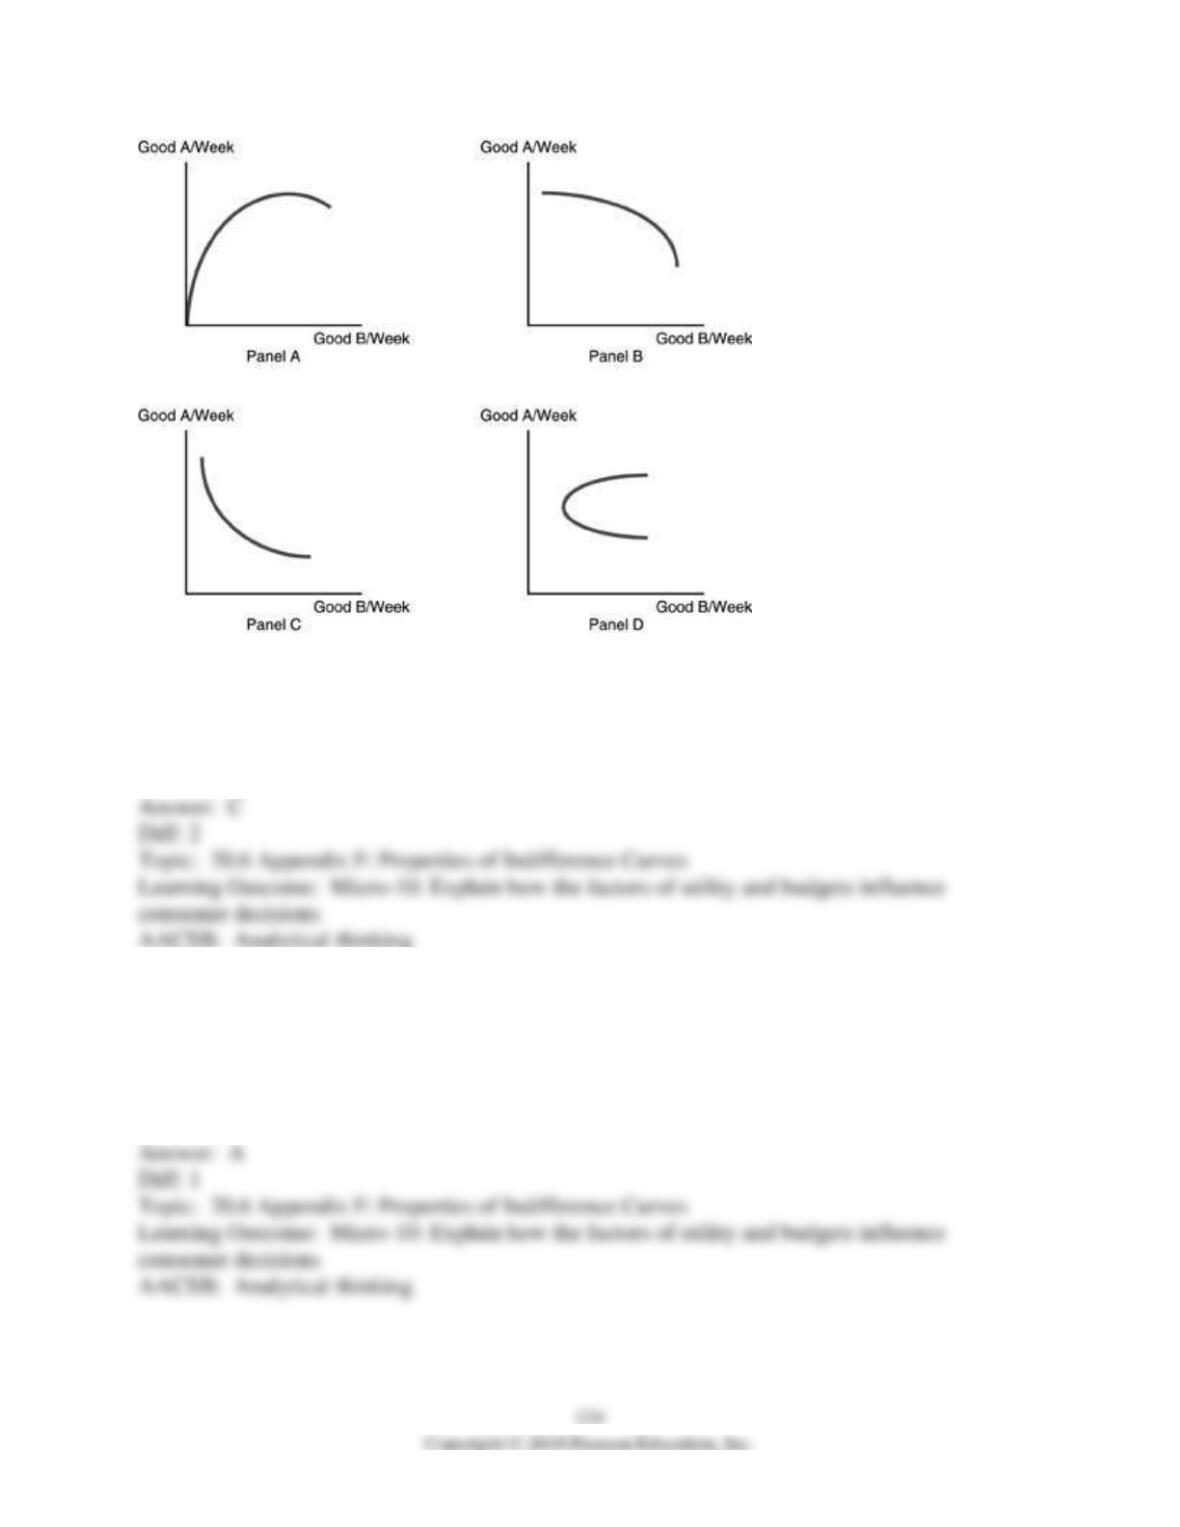
9) Refer to the above figures. Which panel best represents an indifference curve?
A) Panel A
B) Panel B
C) Panel C
D) Panel D
10) An indifference curve
A) must slope downward towards the right.
B) is positively sloped.
C) is upsloping and is concave to the origin.
D) may be upsloping or downsloping, depending on whether the two products are complements
or substitutes.
11) An indifference curve
A) must be convex to the origin.
B) must be concave to the origin.
C) may be convex or concave to the origin.
D) depends on the prices of the products and the consumer’s income.
12) One characteristic of indifference curves is that
A) they must intersect at the origin.
B) they cannot intersect.
C) they have a positive slope.
D) they are straight lines.
13) What are the key properties of indifference curves?
14) Why can’t an indifference curve be a straight line?
20.7 Appendix F: The Marginal Rate of Substitution
1) The marginal rate of substitution is the
A) rate at which the consumer can exchange one good for the other.
B) change in the quantity of one good that just offsets a one-unit change in the consumption of
another good such that the total satisfaction remains constant.
C) change in the quantity of one good that changes the utility received by one unit.
D) same thing as the marginal utility of a good.
2) The marginal rate of substitution is measured along
A) the demand curve.
B) the total utility curve.
C) a given indifference curve.
D) a given budget line.
3) The marginal rate of substitution is
A) equal to unit changes in the quantities of both goods so that utility rises.
B) the slope of the budget line at all points.
C) the change in the quantity of one good that just offsets a unit change in another good, keeping
utility constant.
D) found by adding additional units.
4) The marginal rate of substitution is
A) the change in the quantity of one good that just offsets a one unit change in the consumption
of another such that the total satisfaction remains constant.
B) the additional satisfaction from consuming an additional unit of a good or service.
C) positively related to the level of income.
D) the set of goods and services that are available to the consumer given his income.
5) The marginal rate of substitution is the
A) rate at which the consumer will give up one good for an additional unit of the other good,
such that total satisfaction is constant.
B) rate at which the consumer can trade one good for the other in the marketplace.
C) change in the quantity of one good that changes the utility received by one unit.
D) same thing as the marginal utility of a good.
6) Along a given indifference curve, a consumer reduces the quantity of one good in favor of
more units of the other. In this situation
A) the marginal rate of substitution falls.
B) the marginal utility of the first rises and the marginal utility of the second good falls.
C) total utility rises.
D) both A and B are correct.
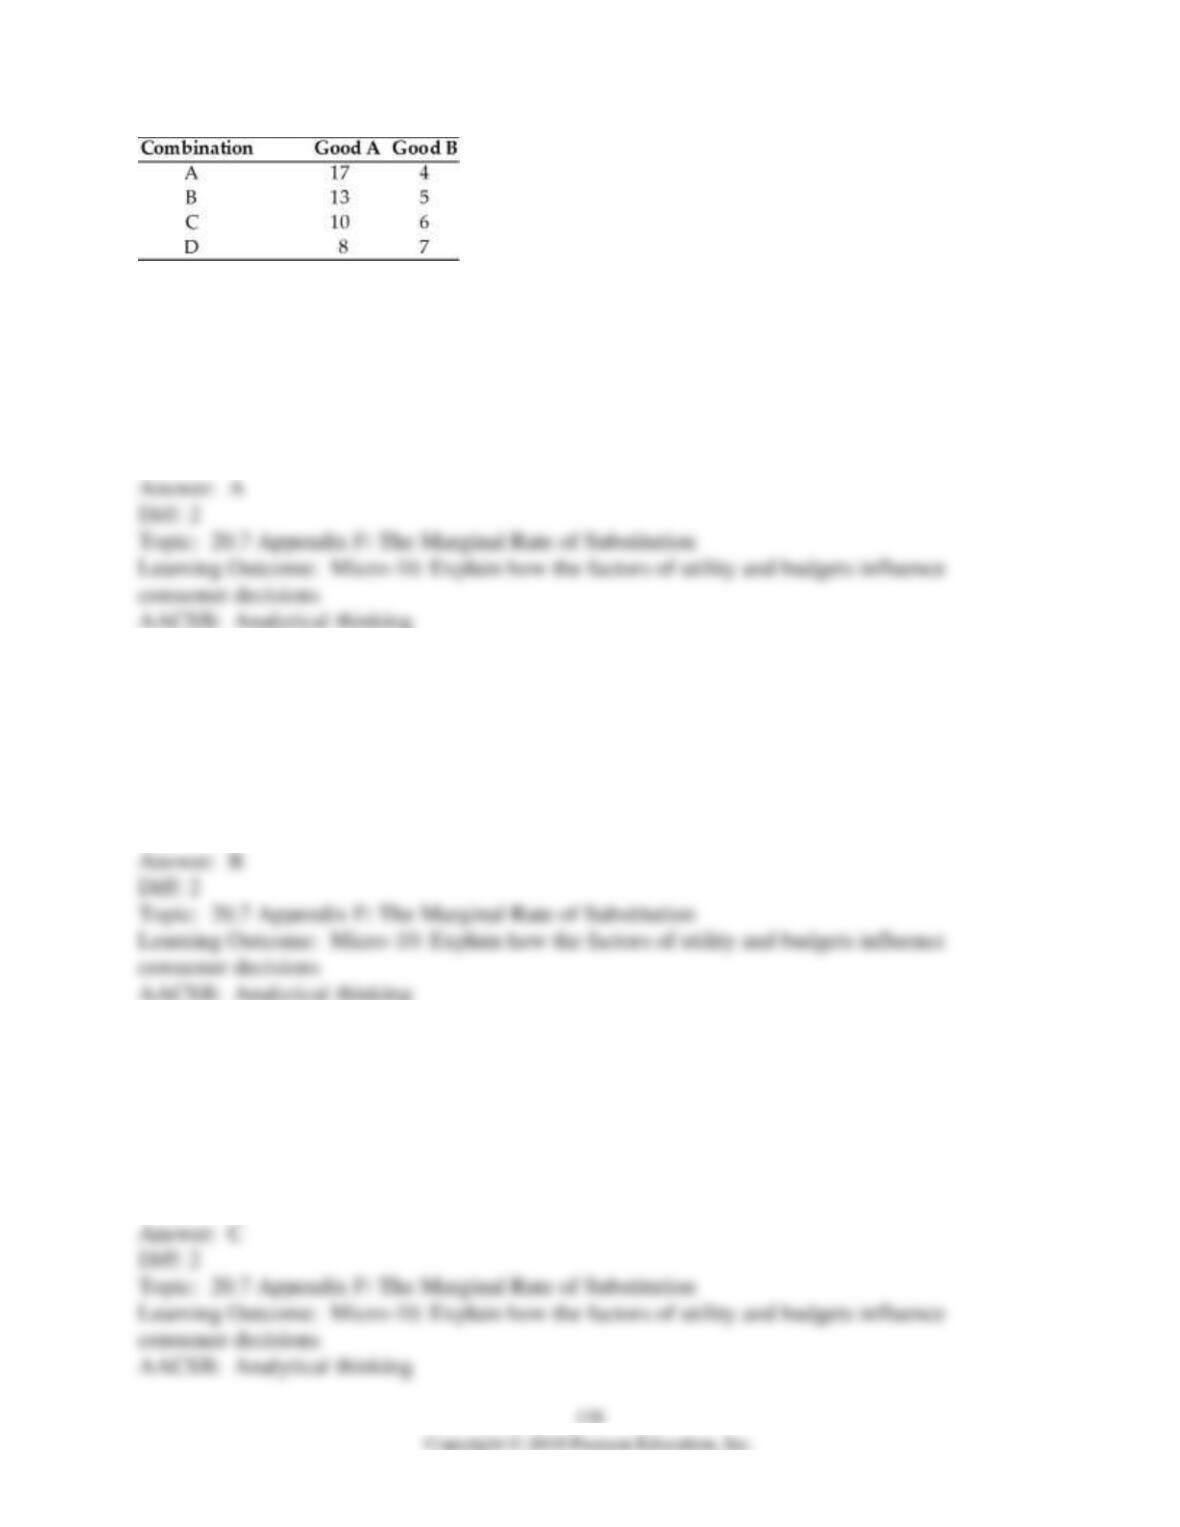
7) Refer to the above table. The table gives the various combinations of Good A and Good B
along Jane’s indifference curve. The marginal rate of substitution when Jane goes from
combination A to combination B is
A) 4:1.
B) 3:1.
C) 2:1.
D) 0.
8) Refer to the above table. The table gives the various combinations of Good A and Good B
along Jane’s indifference curve. The marginal rate of substitution when Jane goes from
combination B to combination C is
A) 4:1.
B) 3:1.
C) 2:1.
D) 0.
9) Refer to the above table. The table gives the various combinations of Good A and Good B
along Jane’s indifference curve. The marginal rate of substitution when Jane goes from
combination C to combination D is
A) 4:1.
B) 3:1.
C) 2:1.
D) 0.
10) Along an indifference curve, as the consumer reduces the quantity of Good A in favor of
more Good B the marginal rate of substitution of Good A for Good B will
A) fall.
B) rise.
C) stay the same.
D) fall and eventually turn negative.
11) The change in the consumption of one good that just offsets a one-unit change in the
consumption of another good is the
A) marginal utility.
B) marginal rate of consumption.
C) marginal rate of substitution.
D) marginal rate of satisfaction.
12) The marginal rate of substitution measures
A) the impact of product substitution.
B) the changes in marginal utility along the indifference curve.
C) the consumer’s willingness to substitute one product for another so that total utility will
remain unchanged.
D) the consumer’s willingness to substitute one product for another so that marginal utility will
remain unchanged.
13) Mathematically the marginal rate of substitution is
A) always a negative number.
B) always a positive number.
C) is equal to 1.
D) sometimes a positive and sometimes a negative number.
14) What is the marginal rate of substitution between two goods and how is it related to the
indifference curve?
20.8 Appendix F: The Indifference Map
1) In a map showing three indifference curves a consumer is most well off on
A) the curve which is closest to the origin of the coordinate axes.
B) the curve which is most farther away from the coordinate axes.
C) the curve that is in the middle.
D) none of the above.
2) An indifference map shows
A) that money income is constant, but product prices may change.
B) that utility is at a maximum at the origin.
C) that curves closer to the origin represent higher levels of utility.
D) that curves further from the origin represent higher levels of utility.
3) If an individual’s total utility from consuming two goods increases, then there must be
A) a downward rotation of the individual’s indifference curve.
B) an inward rotation of the individual’s indifference curve.
C) an outward shift of the individual’s indifference curve.
D) an inward shift of the individual’s indifference curve.
4) If an individual’s total utility from consuming two goods decreases, then there must be
A) a downward rotation of the individual’s indifference curve.
B) an inward rotation of the individual’s indifference curve.
C) an outward shift of the individual’s indifference curve.
D) an inward shift of the individual’s indifference curve.
5) A set of indifference curves on a graph is called
A) a difference map.
B) an indifference map.
C) a budget map.
D) a cluster.
6) Basket of goods A is on an indifference curve that lies further from the origin than basket B.
From this we know that
A) the prices of the goods in A are more than the prices of the goods in B.
B) the satisfaction from consuming A is more than the satisfaction from consuming B.
C) the marginal utility from consuming A is more than the marginal utility from
consuming B.
D) all other consumers would also rank B above A.
7) Basket of goods A is on an indifference curve that lies closer to the origin than basket B. From
this we know that
A) the prices of the goods in A are less than the prices of the goods in B.
B) the satisfaction from consuming A is more than the satisfaction from consuming B.
C) the marginal utility from consuming A is less than the marginal utility from
consuming B.
D) the satisfaction from consuming A is less than the satisfaction from consuming B.
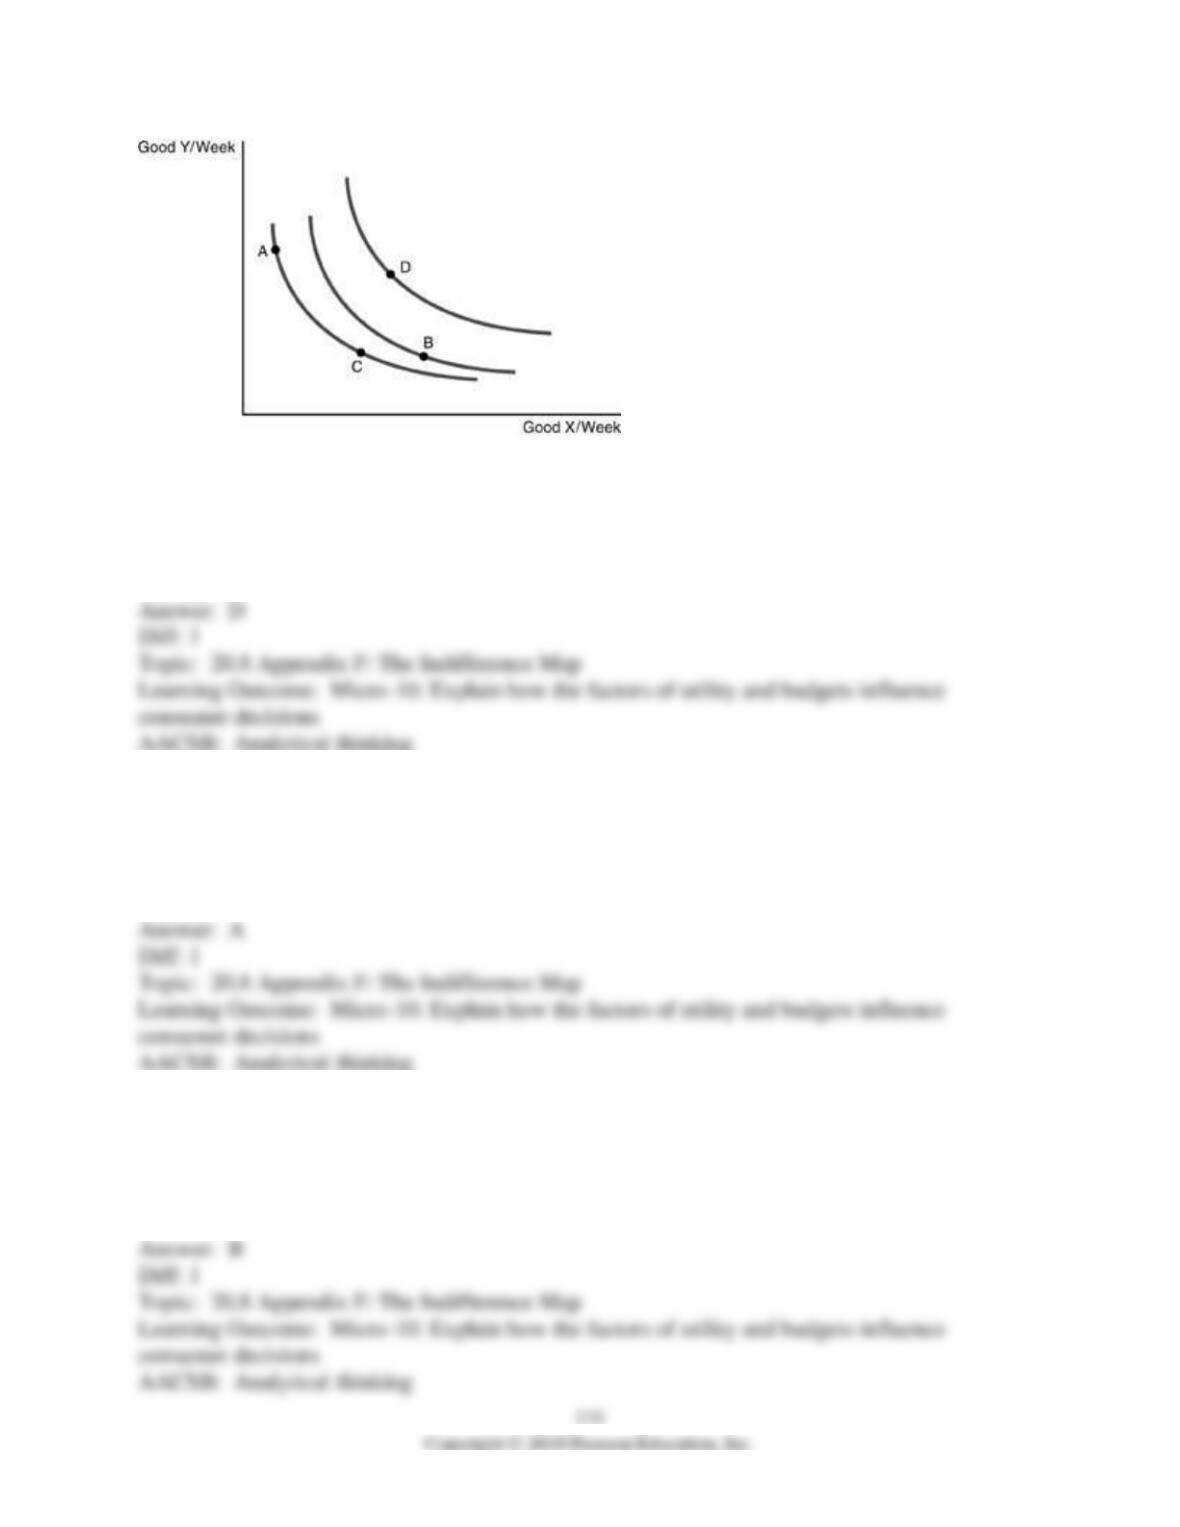
8) Refer to the above figure. Which point represents the highest level of utility?
A) Point A
B) Point B
C) Point C
D) Point D
9) Refer to the above figure. Which point(s) represents the lowest level of utility?
A) Points A & C
B) Point B
C) Point C only
D) Point D
10) Refer to the above figure. Which point represents the second highest level of utility?
A) Point A
B) Point B
C) Point C
D) Point D
11) Suppose that indifference curve I1 lies to the left of indifference curve I2. We can conclude
that
A) some, but not all, points on indifference curve I1 will correspond to higher utility than points
along indifference curve I2.
B) some, but not all, points on indifference curve I1 will correspond to lower utility than points
along indifference curve I2.
C) all points along indifference curve I1 will correspond to higher utility than points along
indifference curve I2.
D) all points along indifference curve I1 will correspond to lower utility than points along
indifference curve I2.
12) Suppose that indifference curve I1 lies to the right of indifference curve I2. We can conclude
that
A) some, but not all, points on indifference curve I1 will correspond to higher utility than points
along indifference curve I2.
B) some, but not all, points on indifference curve I1 will correspond to lower utility than points
along indifference curve I2.
C) all points along indifference curve I1 will correspond to higher utility than points along
indifference curve I2.
D) all points along indifference curve I1 will correspond to lower utility than points along
indifference curve I2.
13) If an individual’s utility from consuming two goods increases, then there must be
A) a downward rotation of the individual’s indifference curve.
B) an inward rotation of the individual’s indifference curve.
C) an outward shift of the individual’s indifference curve.
D) in inward shift of the individual’s indifference curve.
20.9 Appendix F: The Budget Constraint and the Consumer Optimum
1) The slope of the budget line is
A) zero since prices of the goods and income are assumed to be constant.
B) negative since to purchase more of one good means that some of the other good must be given
up.
C) negative because of the marginal rate of substitution.
D) positive since prices and income are positive.
2) The possible combinations of goods that can be purchased with a specific income are called
the
A) budget constraint.
B) indifference map.
C) marginal rate of substitution.
D) income-consumption curve.
3) If incomes fall, then
A) the budget constraint shifts inward.
B) the budget constraint shifts out.
C) there is no change in the budget constraint.
D) there is no relationship between the budget constraint and income.
4) The budget constraint shows that
A) the consumer faces a trade-off in the consumption of goods.
B) the consumer can have as many goods as he wants.
C) as consumers spend more on one good, they spend more on others.
D) total income equals total spending on one good.
5) Which of the following shows the feasible combinations of two goods that a consumer could
afford given her money income?
A) the budget constraint
B) the indifference map
C) the income consumption curve
D) the price consumption curve
6) An increase in consumer income will
A) shift the budget constraint and increase its slope.
B) reduce consumption of all normal goods.
C) pivot the budget constraint on the axis with the good that has the higher price.
D) shift out the budget constraint and increase the consumption of both goods, if they are normal
goods.
7) If the quantity of tacos is measured along the horizontal axis and the quantity of movies is
measured along the vertical axis, and the price of a taco is $2.00 while the price of a movie is
$12, then the slope of the budget line is
A) -1/3.
B) -3.5
C) -1/6.
D) -6.
8) The slope of the budget constraint line is the
A) income of consumers divided by the price of each good.
B) ratio of this year’s income to last year’s income.
C) rate of exchange between the two goods.
D) ratio of different levels of income.
9) Suppose that the quantity of good y is measured along the vertical axis and that the quantity of
good x is measured along the horizontal axis. If the price of good x is $5 and the price of good y
is $10 when income is $200 per time period, the slope of the consumer’s budget constraint will
be
A) -0.5.
B) -2.
C) -5.
D) -10.
10) The budget constraint shows the
A) combinations of goods that generate the same amount of total satisfaction.
B) possible combinations of goods that can be purchased with a specified income.
C) changes in consumption of goods that a consumer makes when his income increases.
D) amount of a good the consumer will buy at various prices.
11) All possible combinations of goods that can be purchased at fixed prices with a specific
income is
A) a marginal utility curve.
B) a total utility curve.
C) an indifference curve.
D) a budget constraint.
12) The consumption possibilities curve is the
A) supply curve.
B) demand curve.
C) budget constraint.
D) indifference curve.
13) Let the quantity of hamburgers be measured along the vertical axis and the quantity of
movies be measured along the horizontal axis. If the price of a hamburger is $1.50 and the price
of a movie is $6, then the slope of the budget line is
A) -6.
B) -4.
C) -3.
D) -0.25.
14) The quantity of good A is measured along the vertical axis, and the quantity of good B is
measures along the horizontal axis. If the price of Good A falls
A) the vertical intercept of the budget line moves along the vertical axis away from the origin.
B) the vertical intercept of the budget line moves along the vertical axis toward the origin.
C) the horizontal intercept (along Good B) of the budget line will increase.
D) none of the above
15) The quantity of good Y is measured along the vertical axis, and the quantity of good X is
measured along the horizontal axis. If the prices of both good Y and good X rise, the budget line
A) shifts outward to the right and the vertical and horizontal intercepts will both rise.
B) shifts inward to the left and both intercepts will decline.
C) rotates, rising along the vertical axis but falling along the horizontal axis.
D) none of the above.