Chapter 20 Income Inequality and Poverty
MULTIPLE CHOICE
1. In the United States, labor earnings are what percent of total income?
a.
75 percent
b.
70 percent
c.
65 percent
d.
50 percent
2. In the U.S. economy, labor earnings make up about
a.
one-half of total income.
b.
two-thirds of total income.
c.
three-fourths of total income.
d.
nine-tenths of total income.
3. Which of the following is most likely to occur when the government enacts policies to make the distribution of
income more equal?
a.
a more efficient allocation of resources
b.
a distortion of incentives
c.
unchanged behavior
d.
All of the above are correct.
4. The invisible hand of the marketplace acts to allocate resources
a.
efficiently but does not necessarily ensure that resources are allocated fairly.
b.
both fairly and efficiently.
c.
fairly but does not necessarily ensure that resources are allocated efficiently.
d.
neither fairly nor efficiently.
5. The marketplace allocates resources
a.
fairly.
b.
efficiently.
c.
to those desiring them least.
d.
both efficiently and equitably.
2 ❖ Chapter 20/Income Inequality and Poverty
6. When the government redistributes income to achieve greater equality, it
a.
distorts incentives.
b.
improves efficiency.
c.
focuses on middle income brackets.
d.
relies on foreign aid to help balance the budget.
7. Government programs that take money from high-income people and give it to low-income people typically
a.
improve economic efficiency by reducing poverty.
b.
reduce economic efficiency because they distort incentives.
c.
have no effect on economic efficiency because they both reduce poverty and distort incentives.
d.
sometimes improve, sometimes reduce, and sometimes have no effect on economic efficiency.
8. When the government enacts policies to redistribute income,
a.
the objective is to enhance efficiency and a side effect is that the allocation of resources becomes
more equal.
b.
the objective is to enhance efficiency and a side effect is that the allocation of resources becomes
less equal.
c.
the objective is to enhance equality and a side effect is that the allocation of resources becomes
more efficient.
d.
the objective is to enhance equality and a side effect is that the allocation of resources becomes less
efficient.
9. Which of the following is correct?
a.
Governments can never improve market outcomes.
b.
Governments can sometimes improve market outcomes.
c.
Governments can always improve market outcomes.
d.
Government can never make the income distribution more equal.
10. Which of the Ten Principles of Economics do governments run into when they redistribute income to achieve
greater equality?
a.
Trade can make everyone better off.
b.
The cost of something is what you give up to get it.
c.
People face trade-offs.
d.
Markets are usually a good way to organize economic activity.
Chapter 20/Income Inequality and Poverty ❖ 3
11. Which two of the Ten Principles of Economics are illustrated in this chapter?
a.
A country’s standard of living depends on its ability to produce goods & People face tradeoffs.
b.
Prices rise when the government prints too much money & Governments can sometimes improve
market outcomes.
c.
Governments can sometimes improve market outcomes & People face tradeoffs.
d.
People face tradeoffs & Prices rise when the government prints too much money .
12. A government’s policy of redistributing income makes the income distribution
a.
more equal, distorts incentives, alters behavior, and makes the allocation of resources more
efficient.
b.
more equal, distorts incentives, alters behavior, and makes the allocation of resources less efficient.
c.
less equal, distorts incentives, alters behavior, and makes the allocation of resources more efficient.
d.
less equal, distorts incentives, alters behavior, and makes the allocation of resources less efficient.
INCOME INEQUALITY AND POVERTY
1. Governments enact policies to
a.
make the distribution of income more efficient.
b.
make the distribution of income more equal.
c.
maximize the use of the welfare system.
d.
minimize the use of in-kind transfers.
2. Which of the following is not a question that economists try to answer when measuring the distribution of in-
come?
a.
How many people live in poverty?
b.
How often do people receive a raise at work?
c.
How often do people move among income classes?
d.
What problems arise in measuring the amount of inequality?
3. Economists study poverty and income inequality in order to answer which of the following questions?
a.
What are people’s wages?
b.
How does labor-force experience affect wages?
c.
How much inequality is there in society?
d.
How do people adjust their behavior due to taxation?

4 ❖ Chapter 20/Income Inequality and Poverty
4. Comparing the United States household income distribution to other countries is
a.
easy, because data is available for all countries in the world.
b.
easy, because some countries collect data on expenditures instead of incomes.
c.
problematic, because international agreements require countries to standardize their income
accounting procedures.
d.
problematic, because countries collect data in different ways.
5. The income distribution in the United States shows that the income share of the top fifth of all families is
a.
over 50 percent.
b.
around 25 percent.
c.
more than 10 times the income of the bottom fifth.
d.
not much different from the income of the top 5 percent.
6. Based on data from 2008, the top fifth of all families received approximately what percent of all income in the
United States?
a.
78 percent
b.
48 percent
c.
21 percent
d.
4 percent
7. Based on U.S. income data from 2008, the bottom fifth of all families received approximately what percent of
all income?
a.
48 percent
b.
21 percent
c.
10 percent
d.
4 percent
8. Based on U.S. income data from 2008, the top fifth of all families received
a.
the same share of income as the bottom fifth.
b.
twice as much income as the bottom fifth.
c.
approximately 5 times more income than the bottom fifth.
d.
more than 10 times more income than the bottom fifth.
9. U.S. income data over the last 75 years suggests that the distribution of income
a.
has gradually become more equal over the entire time period.
b.
has gradually become less equal over the entire time period.
c.
gradually became less equal until about 1970, then became more equal from 1970 to 2008.
d.
gradually became more equal until about 1970, then became less equal from 1970 to 2008.

Chapter 20/Income Inequality and Poverty ❖ 5
10. In 2008, what percentage of U.S. families had income levels below $113,205?
a.
5 percent
b.
20 percent
c.
80 percent
d.
95 percent
11. In 2008, what percentage of U.S. families had income levels above $113,205?
a.
5 percent
b.
20 percent
c.
80 percent
d.
95 percent
12. Which of the following is not correct?
a.
Poverty is long-term problem for relatively few families.
b.
Measurements of income inequality usually do not include in-kind transfers.
c.
Measurements of income inequality use lifetime incomes rather than annual incomes.
d.
Measurements of income inequality would be more meaningful if they reflected permanent rather
than current income.
13. Which of the following represents a problem in measuring inequality?
a.
Measurements of income distributions typically include in-kind transfers, which distort the measure
of inequality.
b.
A normal life-cycle pattern causes inequality in the income distribution but may not reflect
inequality in living standards.
c.
Transitory income is a better measure of inequality than permanent income.
d.
Both a and b are correct.
14. If income were equally distributed among households,
a.
each household‘s relative share of income would increase.
b.
each household‘s relative share of income would decrease.
c.
the top fifth of households would have 50 percent of the income.
d.
50 percent of the households would receive exactly 50 percent of the income.
15. Which of the following does not explain the rise in income inequality in the United States from 1970 to 2008?
a.
Changes in technology.
b.
An increase in minimum wages.
c.
A reduction in the demand for unskilled labor.
d.
Increased international trade with low-wage countries.
6 ❖ Chapter 20/Income Inequality and Poverty
16. Which of the following explains the rise in income inequality in the United States from 1970 to 2008?
a.
An increase in minimum wages.
b.
An increase in the demand for skilled labor.
c.
An increase in the demand for unskilled labor.
d.
Reduced international trade with low-wage countries.
Table 20-1
The following table shows the distribution of income in Thomasville.
Group
Annual Family Income
Top Quartile (25%)
$85,000 and over
Second Quartile
$50,000 to $84,999
Third Quartile
$28,000 to $49,999
Bottom Quartile
Under $28,000
17. Refer to Table 20-1. Seventy-five percent of all families have incomes below what level?
a.
$28,000
b.
$50,000
c.
$85,000
d.
There is insufficient information to answer this question.
18. Refer to Table 20–1. Seventy-five percent of all families have incomes above what level?
a.
$28,000
b.
$50,000
c.
$85,000
d.
There is insufficient information to answer this question.
19. Refer to Table 20–1. Fifty percent of all families have incomes below what level?
a.
$28,000
b.
$50,000
c.
$85,000
d.
There is insufficient information to answer this question.
20. Refer to Table 20–1. If the poverty line was $29,075, what would be the poverty rate?
a.
less than 25%
b.
between 25% and 50%
c.
between 50% and 75%
d.
There is insufficient information to answer this question.

Chapter 20/Income Inequality and Poverty ❖ 7
21. Refer to Table 20–1. If the poverty line was $22,063, what would be the poverty rate?
a.
less than 25%
b.
between 25% and 50%
c.
between 50% and 75%
d.
There is insufficient information to answer this question.
22. When we compare the income distribution of the United States to those of other countries, we find that the
U.S.
a.
has one of the most unequal income distributions.
b.
has one of the most equal income distributions.
c.
ranks around the middle of the group.
d.
is second to China as the most unequal distribution.
Table 20-2
Percentage of Before-Tax Income Received by Families in Hapland
Group
Percentage of
Family Income
in 2000
Percentage of
Family Income
in 1950
Top Fifth
50.7
45.9
Fourth Fifth
26.9
25.8
Middle Fifth
12.1
13.6
Second Fifth
6.2
7.2
Bottom Fifth
4.1
5.5
23. Refer to Table 20-2. According to the table, from 1950 to 2000, the Hapland income distribution became
a.
less equal.
b.
more equal.
c.
more equal at the lowest level of income but less equal at highest level of income.
d.
less equal at the lowest level of income but more equal at highest level of income.
Table 20-3
The Distribution of Income in Hapland
Group
Annual Family Income
Top Fifth
$120,000 and over
Fourth Fifth
$90,000 – 119,999
Middle Fifth
$60,000 – 89,999
Second Fifth
$45,000 – 59,999
Bottom Fifth
Under $45,000
24. Refer to Table 20-3. According to the table, what percent of families in Hapland have income levels below
$90,000?
a.
20 percent.
b.
40 percent.
c.
60 percent.
d.
80 percent.

8 ❖ Chapter 20/Income Inequality and Poverty
25. Refer to Table 20–3. According to the table, what percent of families in Hapland have income levels above
$60,000?
a.
80 percent
b.
60 percent
c.
50 percent
d.
40 percent
26. Refer to Table 20–3. According to the table, what percent of families in Hapland have income levels below
$60,000?
a.
80 percent
b.
60 percent
c.
50 percent
d.
40 percent
27. Refer to Table 20–3. Where would the government in Hapland set the poverty line to have a poverty rate of
40 percent?
a.
$45,000
b.
$60,000
c.
$90,000
d.
$120,000
28. Refer to Table 20–3. If the poverty rate is 23%, where is the poverty line in Hapland?
a.
under $45,000
b.
between $45,000 and $59,999
c.
between $60,000 and $89,999
d.
between $90,000 and $119,999
29. Of the four countries below, which has the highest degree of income inequality?
a.
Japan
b.
Brazil
c.
South Africa
d.
United States
30. Of the four countries below, the country that has the most income equality is
a.
Japan.
b.
Brazil.
c.
South Africa.
d.
the United States.

Chapter 20/Income Inequality and Poverty ❖ 9
31. The United States has more income inequality than
a.
Brazil.
b.
Mexico.
c.
Canada.
d.
South Africa.
32. The United States has less income inequality than
a.
Japan.
b.
Canada.
c.
Germany.
d.
South Africa.
33. On average, the distribution of income tends to be
a.
random across richer and poorer countries.
b.
similar between richer and poorer countries.
c.
less equal in richer countries than in poorer countries.
d.
more equal in richer countries than in poorer countries.
34. The United States has relatively greater income
a.
inequality than developing countries but greater equality than other developed countries.
b.
inequality than both developing and other developed countries.
c.
equality than developing countries but greater inequality than other developed countries.
d.
equality than both developing and other developed countries.
35. When we examine historical data on income inequality in the U.S., we see that the distribution of income
gradually became
a.
more equal between 1935 and 2008.
b.
more equal between 1935 and 1973, but that trend reversed itself between 1973 and 2008.
c.
more unequal between 1935 and 1973, but that trend reversed itself between 1973 and 2008.
d.
more unequal between 1935 and 2008.
36. The 2008 U.S. distribution of income shows that the top fifth of all families have
a.
more than ten times the income of the bottom 20 percent.
b.
more than five times the income of the bottom 20 percent.
c.
more than double the income of the bottom 20 percent.
d.
the same share of income as the bottom 20 percent.

10 ❖ Chapter 20/Income Inequality and Poverty
37. The 2008 U.S. distribution of income shows that the top 5 percent of families have approximately what share
of income?
a.
1 percent
b.
5 percent
c.
10 percent
d.
20 percent
38. The 2008 U.S. distribution of income shows that the top 20 percent of families have approximately what share
of income?
a.
20 percent
b.
35 percent
c.
50 percent
d.
80 percent
39. The 2008 U.S. distribution of income shows that the top 5 percent of families earn approximately how much
income per year?
a.
$175,000 and over
b.
$200,000 and over
c.
$225,000 and over
d.
$250,000 and over
40. The study by economists Cox and Alm found that the 2006 pre-tax income of the richest fifth of U.S. house-
holds is
a.
5 times the pre-tax income of the poorest fifth.
b.
10 times the pre-tax income of the poorest fifth.
c.
15 times the pre-tax income of the poorest fifth.
d.
20 times the pre-tax income of the poorest fifth.
41. The study by economists Cox and Alm found that the 2006 after-tax income of the richest fifth of U.S. house-
holds is
a.
equal to the after-tax income of the poorest fifth.
b.
7 times the after-tax income of the poorest fifth.
c.
14 times the after-tax income of the poorest fifth.
d.
21 times the after-tax income of the poorest fifth.
Chapter 20/Income Inequality and Poverty ❖ 11
42. The study by economists Cox and Alm found
a.
inequality in consumption is much smaller than inequality in annual income.
b.
inequality in consumption is slightly smaller than inequality in annual income.
c.
inequality in consumption is slightly larger than inequality in annual income.
d.
inequality in consumption is much larger than inequality in annual income.
43. The study by economists Cox and Alm found
a.
the gap between rich and poor shrinks greatly if using after-tax income compared with pre-tax
income.
b.
the gap between rich and poor shrinks slightly if using after-tax income compared with pre-tax
income.
c.
the gap between rich and poor widens slightly if using after-tax income compared with pre-tax
income.
d.
the gap between rich and poor widens greatly if using after–tax income compared with pre-tax
income.
44. When comparing the percentage of income (or expenditure) of the lowest and highest 10 percent of the popu-
lation,
a.
South Africa has a more equal income distribution than the United States.
b.
South Africa has a more equal income distribution than Japan.
c.
Japan has a more equal income distribution than the United States.
d.
Mexico has a more equal income distribution than Canada.
45. Since about 1970 in the U.S.,
a.
decreases in the wages of unskilled workers, relative to skilled workers, have led to increased
inequality in family incomes.
b.
increases in the wages of unskilled workers, relative to skilled workers, have led to increased
equality in family incomes.
c.
inequality in family incomes has increased, despite increases in the wages of unskilled workers
relative to skilled workers.
d.
inequality in family incomes has decreased, despite increases in the wages of skilled workers
relative to unskilled workers.
46. Which of the following statements is correct?
a.
The United States has a more equal distribution of income than other developed countries such as
Japan and Germany.
b.
The statement “a rising tide lifts all boats” illustrates how economic growth reduces the number of
people with income levels below the poverty line.
c.
The economic life cycle explains why people base spending decisions on transitory income.
d.
The United States has more income inequality than some developing countries, such as Mexico and
Brazil.
12 ❖ Chapter 20/Income Inequality and Poverty
Table 20-4
Quintile
Shares of Income by
Quintile, 2000
Shares of Income by
Quintile, 2003
Shares of Income by
Quintile, 2007
Bottom Fifth
4.3%
4.1%
3.4%
Second Fifth
9.8%
9.6%
8.8%
Middle Fifth
15.5%
15.5%
14.7%
Fourth Fifth
22.8%
23.2%
22.8%
Top Fifth
47.4%
47.6%
50.3%
Source: U.S. Bureau of Census
47. Refer to Table 20-4. In 2007, the top fifth of families have
a.
almost 15 times as much income as the bottom fifth of families.
b.
96.6% more income than the bottom fifth of families.
c.
50.3% more income than the bottom fifth of families.
d.
46.9% more income than the bottom fifth of families.
48. Refer to Table 20-4. In 2007, the bottom 60% of families have
a.
only 12% of total income in the U.S.
b.
only 27% of total income in the U.S.
c.
50% of total income in the U.S.
d.
73% of total income in the U.S.
49. Refer to Table 20-4. Comparing data from 2000 and 2007, which of the following statements is correct?
a.
There has been no change in overall income inequality because the share of income held by the
fourth fifth is identical.
b.
Overall income inequality has worsened slightly, as shown by the simultaneous increase in the
share of income held by the top fifth and the decrease in the share of income held by the bottom
fifth.
c.
Overall income inequality has improved because the share held by the middle fifth has declined by
almost 1%.
d.
None of the above is correct.
Table 20-5
Country
Gini Coefficient*
Sweden
0.240
France
0.275
Italy
0.319
United Kingdom
0.324
Portugal
0.375
Latvia
0.387
*A Gini coefficient is a commonly used measure of income inequality, with values between 0 and 1 (0
corresponds to perfect equality whereby everyone has exactly the same income, and 1 corresponds to perfect
inequality where one person has all the income, while everyone else has zero income).
Source: The World Bank
Chapter 20/Income Inequality and Poverty ❖ 13
50. Refer to Table 20-5. Which country has the most equal income distribution?
a.
Latvia
b.
Italy
c.
France
d.
Sweden
51. Refer to Table 20-5. Which country has the most unequal income distribution?
a.
Latvia
b.
Italy
c.
France
d.
Sweden
52. Refer to Table 20-5. Which of the following statements is correct?
a.
Latvia has the most unequal distribution of income.
b.
France has a more equal distribution of income than Italy.
c.
Sweden has the most equal distribution of income.
d.
All of the above are correct.
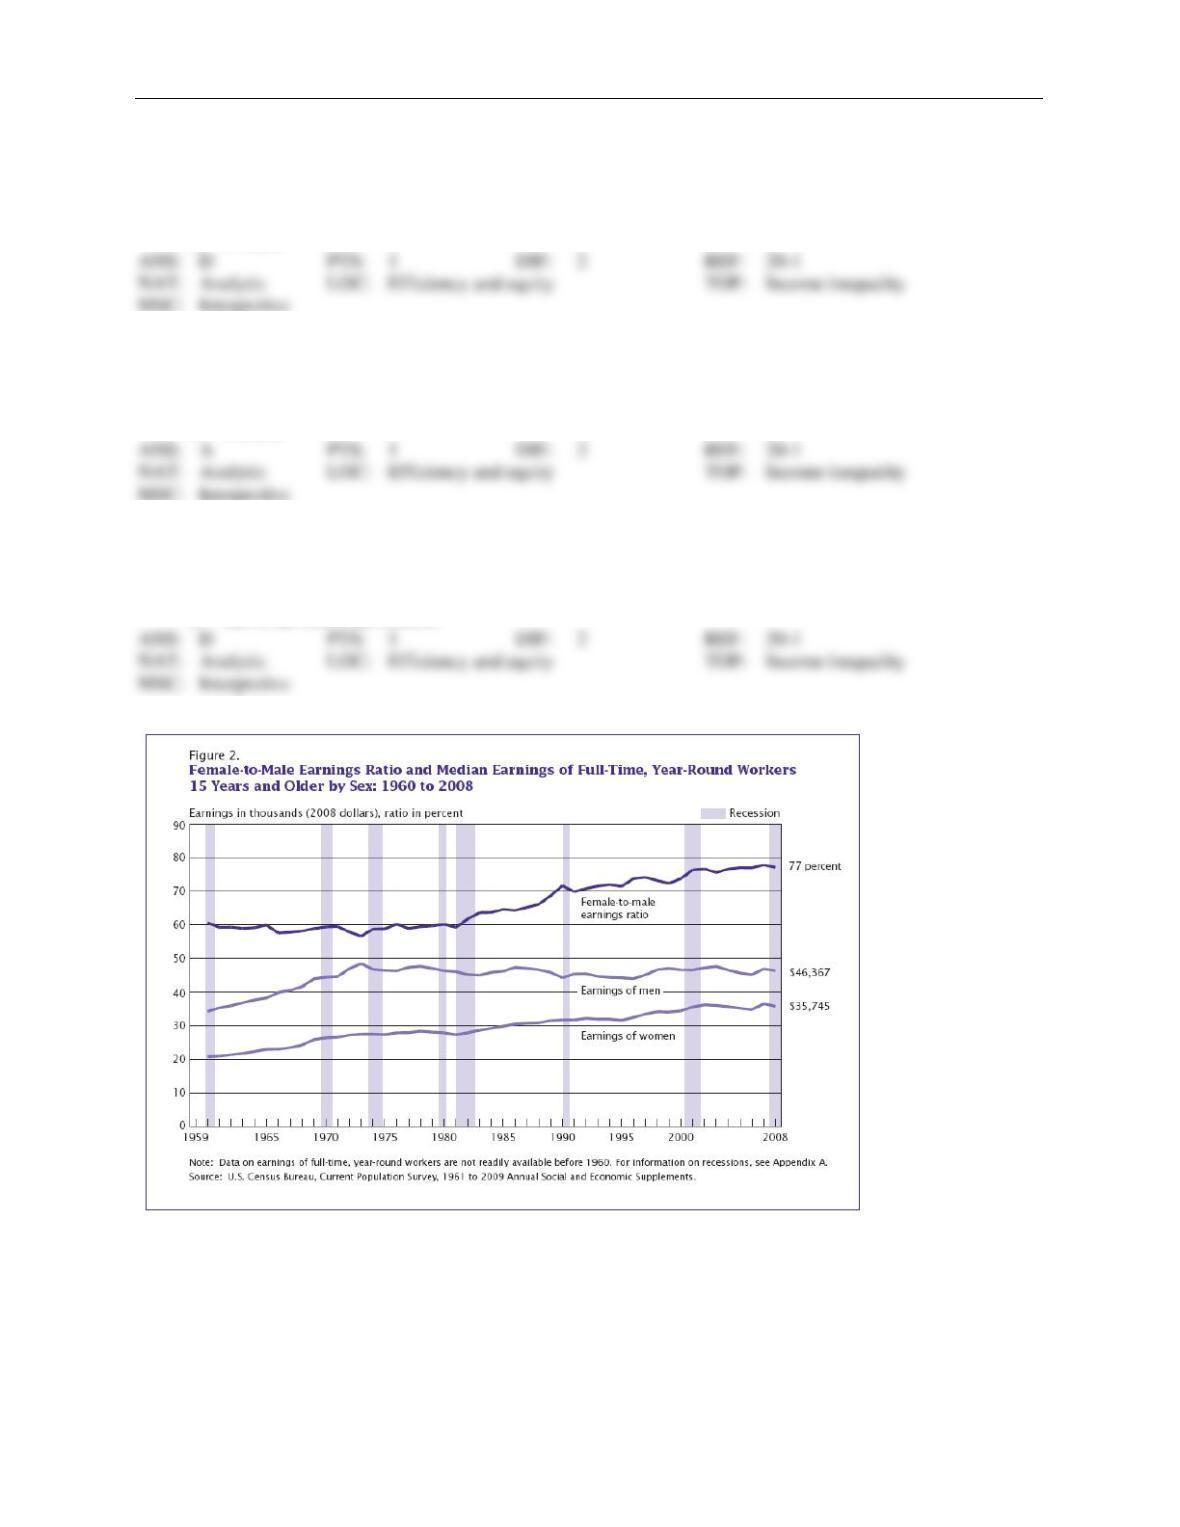
Figure 20-1
14 ❖ Chapter 20/Income Inequality and Poverty
53. Refer to Figure 20-1. The ratio of female-to-male earnings has increased steadily from about 1980 to 2008
because the earnings of men
a.
increased steadily but by approximately half of the increase in the earnings of women.
b.
decreased while the earnings of women increased.
c.
stayed relatively constant while the earnings of women increased.
d.
decreased by substantially more than the decrease in the earnings of women.
Table 20-6
Income Range
Percentage of
Households, 2008
Percentage of
Households, 2007
Less than $10,000
7.2%
7.6%
$10,000 to $14,999
5.5%
5.8%
$15,000 to $24,999
10.6%
11.1%
$25,000 to $34,999
10.6%
11.0%
$35,000 to $49,999
14.2%
14.6%
$50,000 to $74,999
18.8%
18.8%
$75,000 to $99,999
12.5%
12.1%
$100,000 to $149,999
12.2%
11.4%
$150,000 to $199,999
4.3%
3.9%
$200,000 or more
4.2%
3.7%
54. Refer to Table 20-6. In both 2007 and 2008, approximately 25% of the population earned less
than
a.
$15,000.
b.
$25,000.
c.
$50,000.
d.
$100,000.
55. Refer to Table 20-6. A person who is concerned that income inequality has worsened between 2007 and
2008 would cite which of the following statistics to support her position?
a.
The percentage of people earning less than $25,000 decreased from 2007 to 2008.
b.
The percentage of people earning more than $100,000 increased from 2007 to 2008.
c.
The percentage of people earning between $50,000 and $100,000 stayed virtually constant from
2007 to 2008.
d.
Both a) and b) are correct.
Chapter 20/Income Inequality and Poverty ❖ 15
Table 20-7
Quintile
Upper limit of
incomes, 2008
Upper limit of
incomes, 1998
Bottom Fifth
$20,712
$21,273
Second Fifth
$39,000
$40,139
Middle Fifth
$62,725
$63,805
Fourth Fifth
$100,240
$99,000
Top Fifth
over $100,240
over $99,000
56. Refer to Table 20-7. Which of the following is the best overall conclusion to draw from the data?
a.
The most alarming statistic is the lowering of the top income level that defines the bottom fifth of
the income distribution because this indicates that the income distribution is becoming more
unequal.
b.
The greatest cause for concern is the increase in the minimum income level that defines the top fifth
of the income distribution because this indicates that the rich have become richer.
c.
The income distribution is has been relatively unchanged from 1998 to 2008.
d.
Both a) and b) are correct.
Table 20-8
Quintile
Shares of Income by
Quintile, 2000
Shares of Income by
Quintile, 2008
Bottom Fifth
4.3%
4.0%
Second Fifth
9.8%
9.6%
Middle Fifth
15.5%
15.5%
Fourth Fifth
22.8%
23.1%
Top Fifth
47.4%
47.8%
Source: U.S. Bureau of Census
57. Refer to Table 20-8. In 2008, the top fifth of families has
a.
about 12 times as much income as the bottom fifth of families.
b.
6.8% more income than the bottom fifth of families.
c.
47.8% more income than the bottom fifth of families.
d.
96.6% more income than the bottom fifth of families.
58. Refer to Table 20-8. In 2008, the bottom 60% of families has
a.
about 14% of total income in the U.S.
b.
about 29% of total income in the U.S.
c.
about 50% of total income in the U.S.
d.
about 73% of total income in the U.S.
16 ❖ Chapter 20/Income Inequality and Poverty
59. Refer to Table 20-8. Comparing data from 2000 and 2008, which of the following statements is correct?
a.
There has been no change in overall income inequality because the share of income held by the
middle fifth is identical.
b.
Overall income inequality has worsened slightly, as shown by the simultaneous increase the share
of income held by the top fifth and the decrease in the share of income held by the bottom fifth.
c.
Overall income inequality has improved because the share held by the middle fifth has declined by
almost 1%.
d.
None of the above is correct.
60. Which of the following is not correct?
a.
Many measures of inequality are based on income, which may not reflect a person’s standard of
living.
b.
Because many of the poorest families receive in-kind transfers, more families have lower standards
of living when compared to poverty rates based on income.
c.
Because people can borrow and save to smooth out life cycle changes in income, equality measures
based only on income may not reflect a person’s standard of living.
d.
A person’s standard of living depends more on her permanent income than her transitory income,
so inequality measures based on current income may be misleading.
61. The poverty rate is based on a family’s
a.
income, in-kind transfers, and other government aid.
b.
income and in-kind transfers.
c.
in-kind transfers only.
d.
income only.
62. The poverty rate is a measure of the percentage of people whose incomes fall below
a.
a relative level of income.
b.
an absolute level of income.
c.
the median income for a family of three.
d.
the bottom 20 percent of the income distribution.
63. The poverty rate is
a.
a measure of income inequality across families.
b.
the percentage of the population whose family income falls below a specified level.
c.
an absolute level of income set by the federal government for each family size.
d.
measured by the number of in-kind transfers that a family receives.
Chapter 20/Income Inequality and Poverty ❖ 17
64. The current measure of poverty, roughly three times the cost of providing an adequate diet, was established in
a.
1935.
b.
1964.
c.
1973.
d.
1996.
65. In 2008, the poverty rate in the United States was
a.
2.5 percent.
b.
12.6 percent.
c.
13.2 percent.
d.
22.4 percent.
66. Over the past 50 years, the U.S. poverty rate was at its lowest level in
a.
1973.
b.
1980.
c.
1990.
d.
2008.
67. Since 1959 when the official data on the poverty rate began, the poverty rate was at its highest in
a.
1959.
b.
1968.
c.
1977.
d.
1986.
68. The poverty rate for female households with no spouse present is approximately
a.
10 percent.
b.
20 percent.
c.
30 percent.
d.
40 percent.
69. A commonly-used gauge of poverty is the
a.
income inequality rate.
b.
average income rate.
c.
poverty rate.
d.
social inequality rate.
18 ❖ Chapter 20/Income Inequality and Poverty
70. Based on U.S. data for 2008, the poverty rate is the highest for which group of people?
a.
children
b.
married couples
c.
female households, no spouse present
d.
the elderly
71. The percentage of families with incomes below the poverty line
a.
is defined as the 10 percent of U.S.households with the lowest incomes.
b.
is known as the poverty rate.
c.
is known as the unemployment rate.
d.
rises as the general income level rises.
72. Measures of poverty that fail to account for the value of in-kind transfers
a.
understate the actual poverty rate.
b.
have little effect on the validity of reported poverty rates.
c.
are generally more reliable measures of actual poverty rates.
d.
overstate the actual poverty rate.
73. Since the early 1970s, average incomes have
a.
increased, which has reduced the poverty rate.
b.
increased, while the poverty rate increased slightly.
c.
decreased, while the poverty rate has remained unchanged.
d.
remained unchanged, while the poverty rate has decreased.
74. In 2008, the poverty rate in the United States was 13.2 percent. This means that 13.2 percent
a.
of the population had a total family income that fell below the poverty line.
b.
of the population had a total family income that was above the poverty line.
c.
of the population had a total family income below $10,000.
d.
of the population had a total family income above $50,000.
Chapter 20/Income Inequality and Poverty ❖ 19
75. The poverty line in the country of Inequalia is $10,000. The distribution of income for Inequalia is as follows:
Number of Families
Income
200
less than $5,000
300
between $5,000 and $10,000
500
between $10,000 and $15,000
700
between $15,000 and $20,000
100
over $20,000
The poverty rate in Inequalia is
a.
11.1 percent.
b.
16.7 percent.
c.
27.8 percent.
d.
55.5 percent.
76. The poverty line in the country of Inequalia is $7,800. The distribution of income for Inequalia is as follows:
Number of Families
Income
200
less than $5,000
300
between $5,000 and $10,000
500
between $10,000 and $15,000
700
between $15,000 and $20,000
300
over $20,000
The poverty rate in Inequalia is
a.
7.8 percent.
b.
between 10 percent and 25 percent.
c.
between 25 percent and 50 percent.
d.
39 percent.
77. The distribution of income for Inequalia is as follows:
Number of Families
Income
200
less than $5,000
300
between $5,000 and $10,000
500
between $10,000 and $15,000
700
between $15,000 and $20,000
300
over $20,000
If the poverty rate in Inequalia is 25 percent, what is the poverty line in Inequalia?
a.
$5,000
b.
$10,000
c.
$15,000
d.
$20,000
20 ❖ Chapter 20/Income Inequality and Poverty
78. The poverty line in the country of Grim is $10,000. The distribution of income for Grim is as follows:
Number of Families
Income
500
less than $5,000
1,000
between $5,000 and $10,000
1,000
between $10,000 and $15,000
400
between $15,000 and $20,000
100
over $20,000
The poverty rate in Grim is
a.
5 percent.
b.
16.7 percent.
c.
50 percent.
d.
83.3 percent.
79. The distribution of income for Grim is as follows:
Number of Families
Income
500
less than $5,000
1,000
between $5,000 and $10,000
1,000
between $10,000 and $15,000
400
between $15,000 and $20,000
100
over $20,000
If the poverty rate in Grim is 50 percent, what is the poverty line in Grim?
a.
$5,000.
b.
$10,000.
c.
$15,000.
d.
$20,000.
80. The distribution of income for Grim is as follows:
Number of Families
Income
500
less than $5,000
1,000
between $5,000 and $10,000
1,000
between $10,000 and $15,000
400
between $15,000 and $20,000
100
over $20,000
If the poverty rate in Grim is 17 percent, what is the poverty line in Grim?
a.
$5,000.
b.
$10,000.
c.
$15,000.
d.
$20,000.