16) The quantities of Good M are plotted on the vertical axis while the quantities of Good N are
plotted on the horizontal axis. The prices of both M and N fall. The intercepts of the budget line
would
A) decline along both axes.
B) rise on the vertical axis and also rise on the horizontal axis.
C) rise on the horizontal axis but stay unchanged on the vertical axis.
D) rise on the vertical axis but stay unchanged along the horizontal axis.
17) The quantity of good M is measured along the vertical axis, and the quantity of good N is
measured along the horizontal axis. If the prices of both goods M and N declines by 50% each,
then the budget line
A) shifts inward to the left by 50%.
B) shifts outward to the right by 50%.
C) shifts outward to the right by 100%.
D) rotates clockwise by 180 degrees.
18) The budget line
A) shifts to the left as income increases.
B) has a positive slope.
C) is a vertical line.
D) shows the combination of goods that can be purchased at fixed prices and with a given
income.
141
19) A budget constraint shows
A) all of the combinations of sets of goods that yield the same level of satisfaction.
B) all of the possible combinations of goods that can be purchased with a specific budget.
C) all of the goods the consumer gets positive marginal utility from when the goods are
consumed.
D) all of the goods that a consumer substitutes for other goods when prices fall.
20) An increase in income will
A) shift the budget constraint to the right.
B) make the budget constraint steeper.
C) make the budget constraint flatter.
D) make the budget constraint more bowed.
20.10 Appendix F: Consumer Optimum Revisited
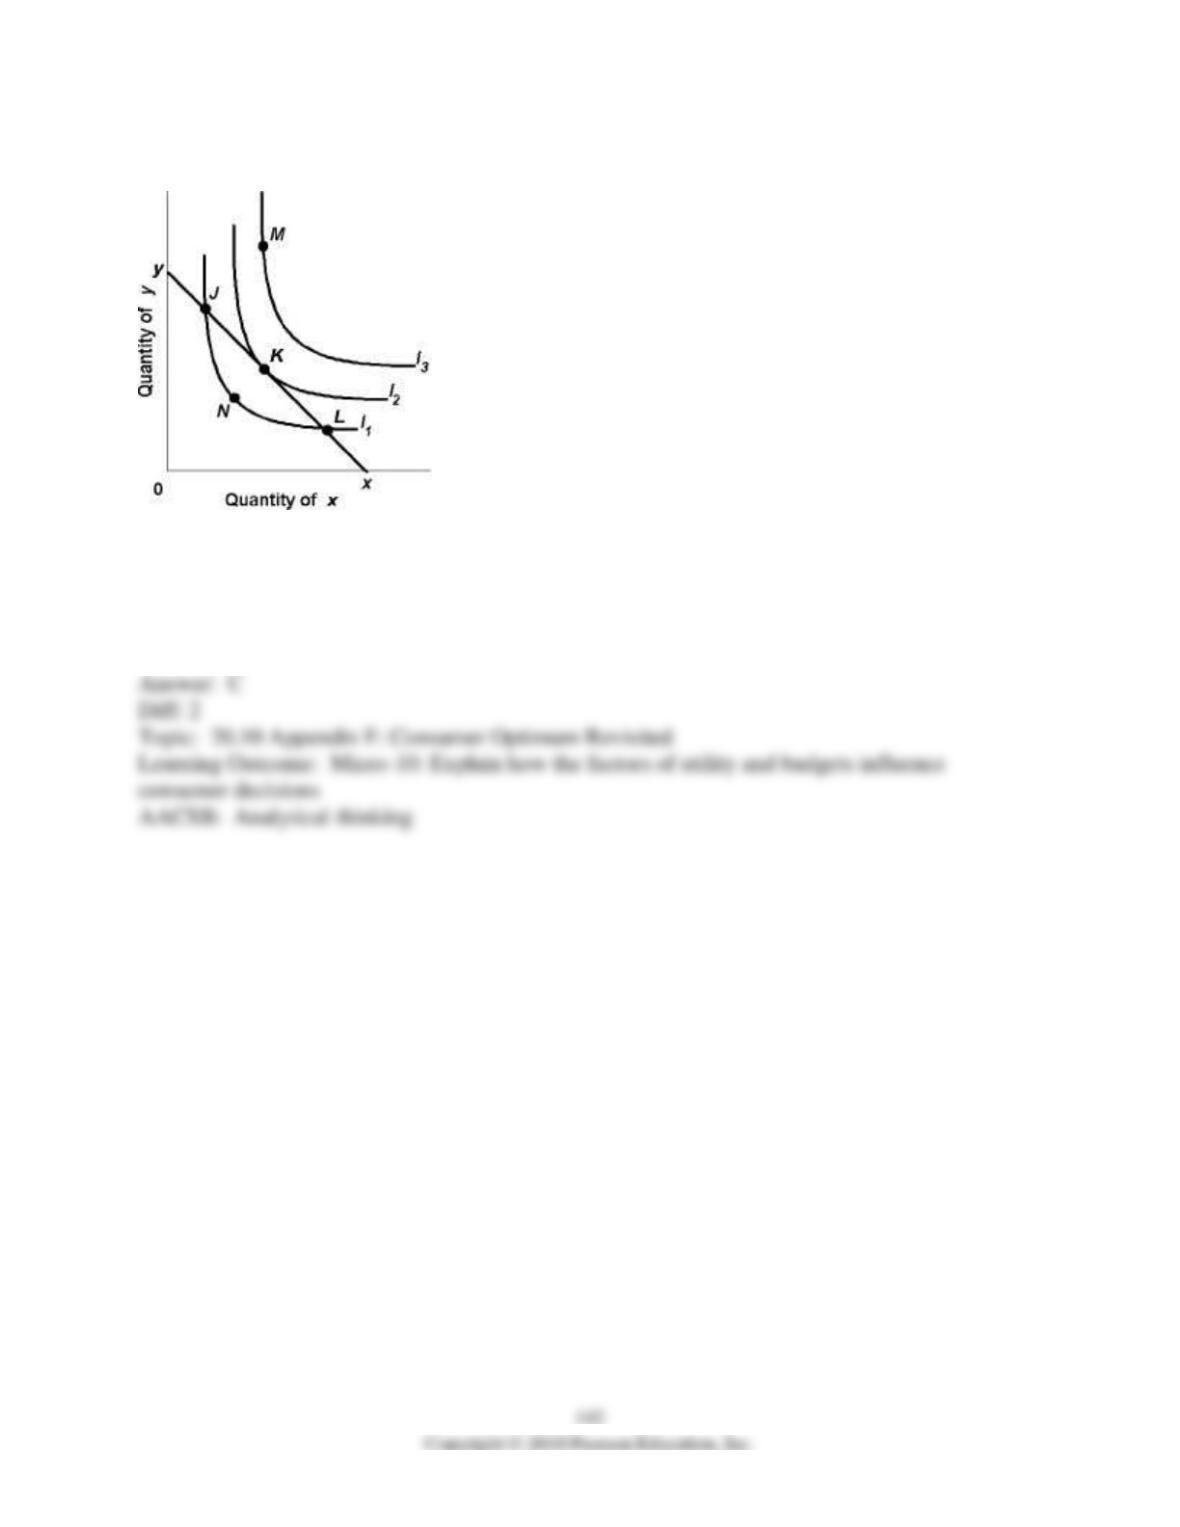
1) Using the above figure, we can conclude that
A) the consumer will purchase goods at combination M.
B) the consumer is indifferent between J and M.
C) K is the optimal combination of goods.
D) L is preferred to K.
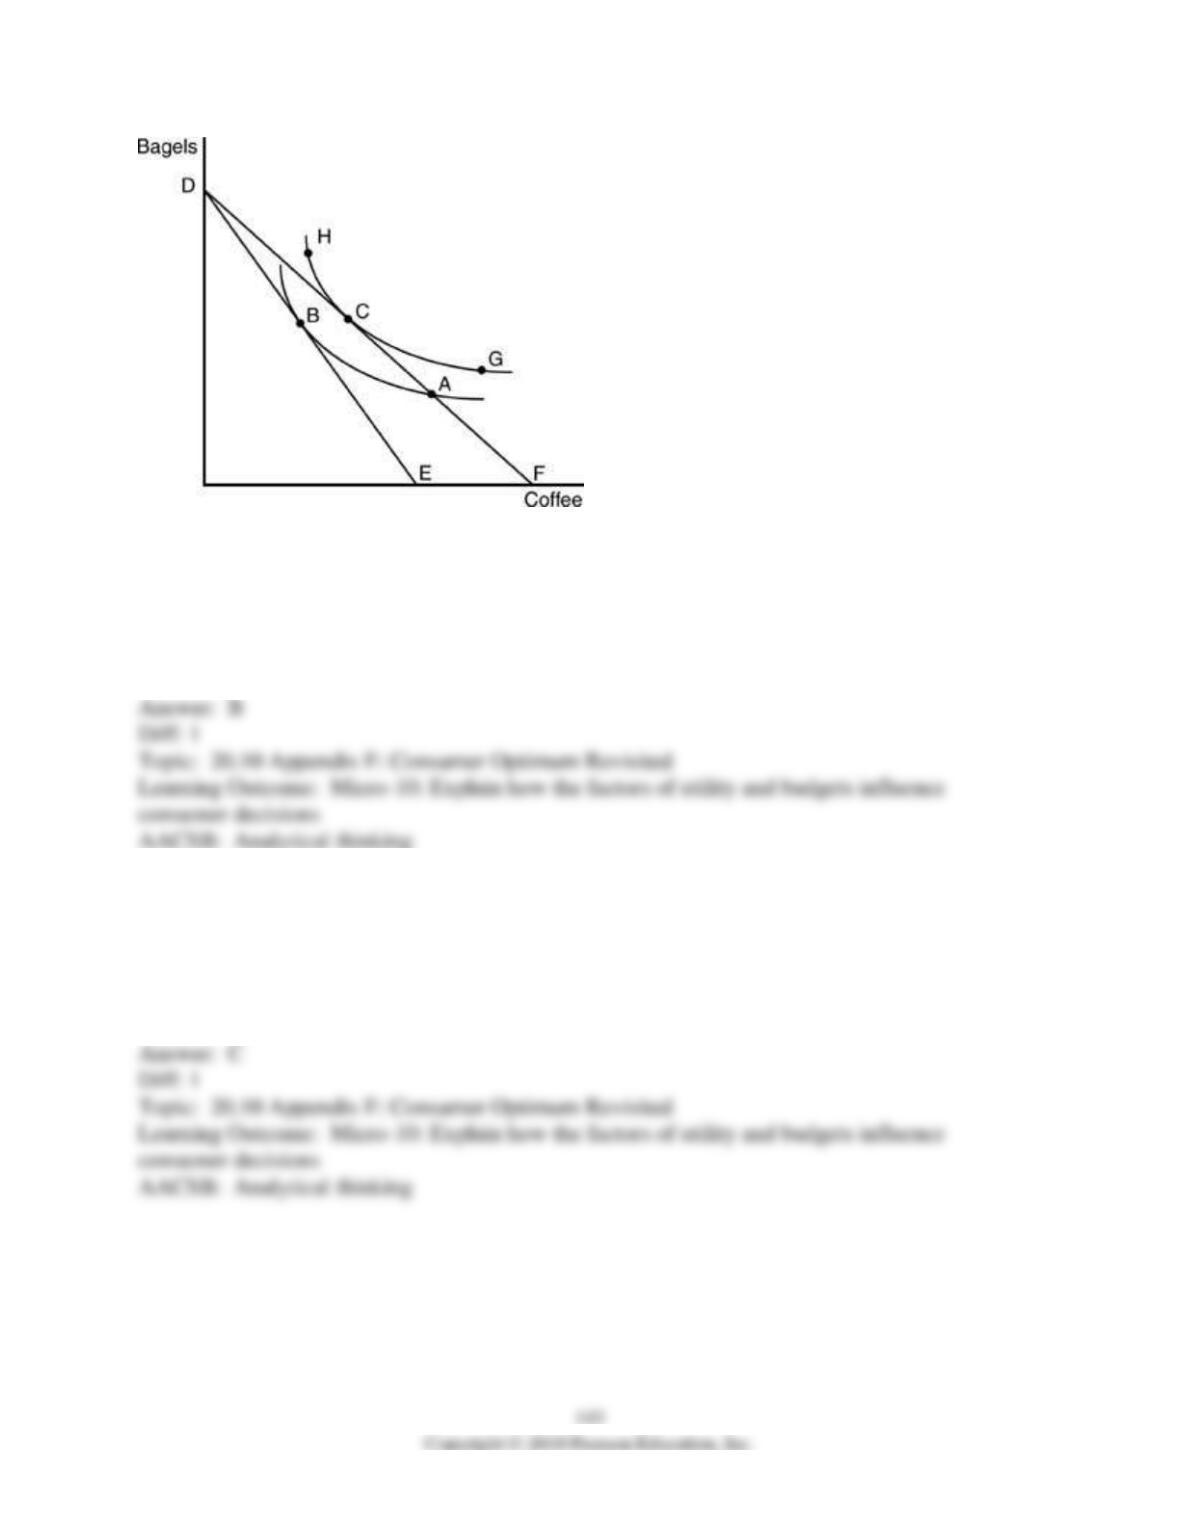
2) In the above figure, if the budget line is the line DE, the consumer will maximize utility at
point
A) A.
B) B.
C) C.
D) G.
3) In the above figure, if the budget line is the line DF, the consumer will maximize utility at
point
A) A.
B) B.
C) C.
D) G.
4) In the above figure, the budget line will change from line DE to line DF when
A) income rises.
B) the price of bagels increases.
C) the price of coffee increases.
D) the price of coffee decreases.
5) In the above figure, if the budget line is originally line DE and the price of coffee decreases,
the consumer will
A) drink less coffee and increase bagel consumption slightly.
B) drink more coffee and increase bagel consumption slightly.
C) drink more coffee and decrease bagel consumption slightly.
D) leave consumption of both coffee and bagels unchanged.
6) In the above figure, point C is
A) preferred to points G, A, and B.
B) preferred to points A and B.
C) less preferred than point G.
D) less preferred than point H.
7) In the above figure, budget line DF would swivel in to the left if
A) the price of bagels increased.
B) the price of bagels decreased.
C) the price of coffee increased.
D) the price of coffee decreased.
8) Using indifference curve analysis, an optimum is characterized by
A) the marginal rate of substitution of one good divided by its price equal to the marginal rate of
substitution of the other good divided by its price.
B) the marginal rate of substitution being equal to one.
C) the marginal rate of substitution being equal to zero.
D) the marginal rate of substitution being equal to the ratio of the prices of the two goods.
9) If an individual consumes only two goods and consumption of one good increases, then in
order to keep the consumer on the same indifference curve, consumption of the other good must
A) increase.
B) decrease.
C) increase proportionately.
D) become negative.
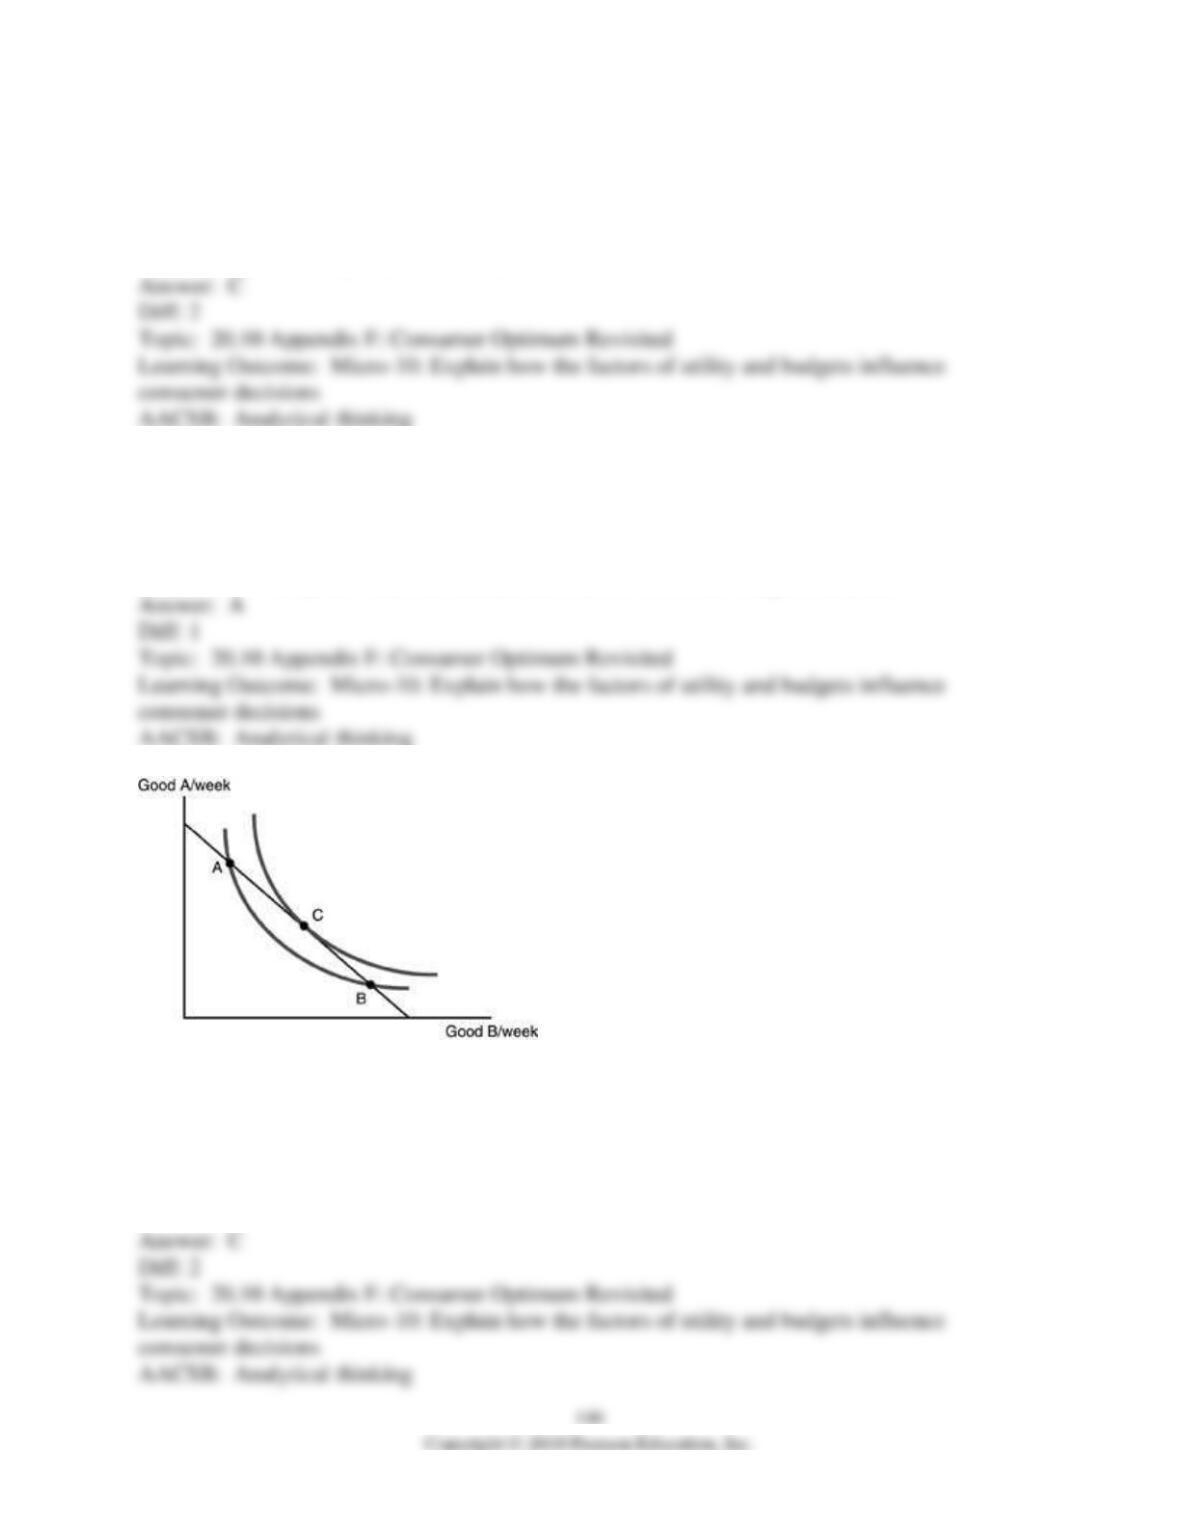
10) A consumer is maximizing utility when
A) the slope of the budget constraint has reached -1.
B) diminishing marginal utility has set in.
C) the slope of the budget constraint equals the marginal rate of substitution.
D) the consumer has spent all of his income.
11) A consumer will achieve the highest level of utility possible when she consumes
A) at the point at which the highest indifference curve is tangent to the budget constraint.
B) at the point at which the indifference curve crosses the budget constraint.
C) at a point to the left of the budget constraint.
D) just below the point where the indifference curve crosses the budget constraint.
12) Refer to the above figure. Given the indifference map and budget constraint represented
above the consumer will maximize utility when she consumes at
A) point A.
B) point B.
C) point C.
D) either points A or B.
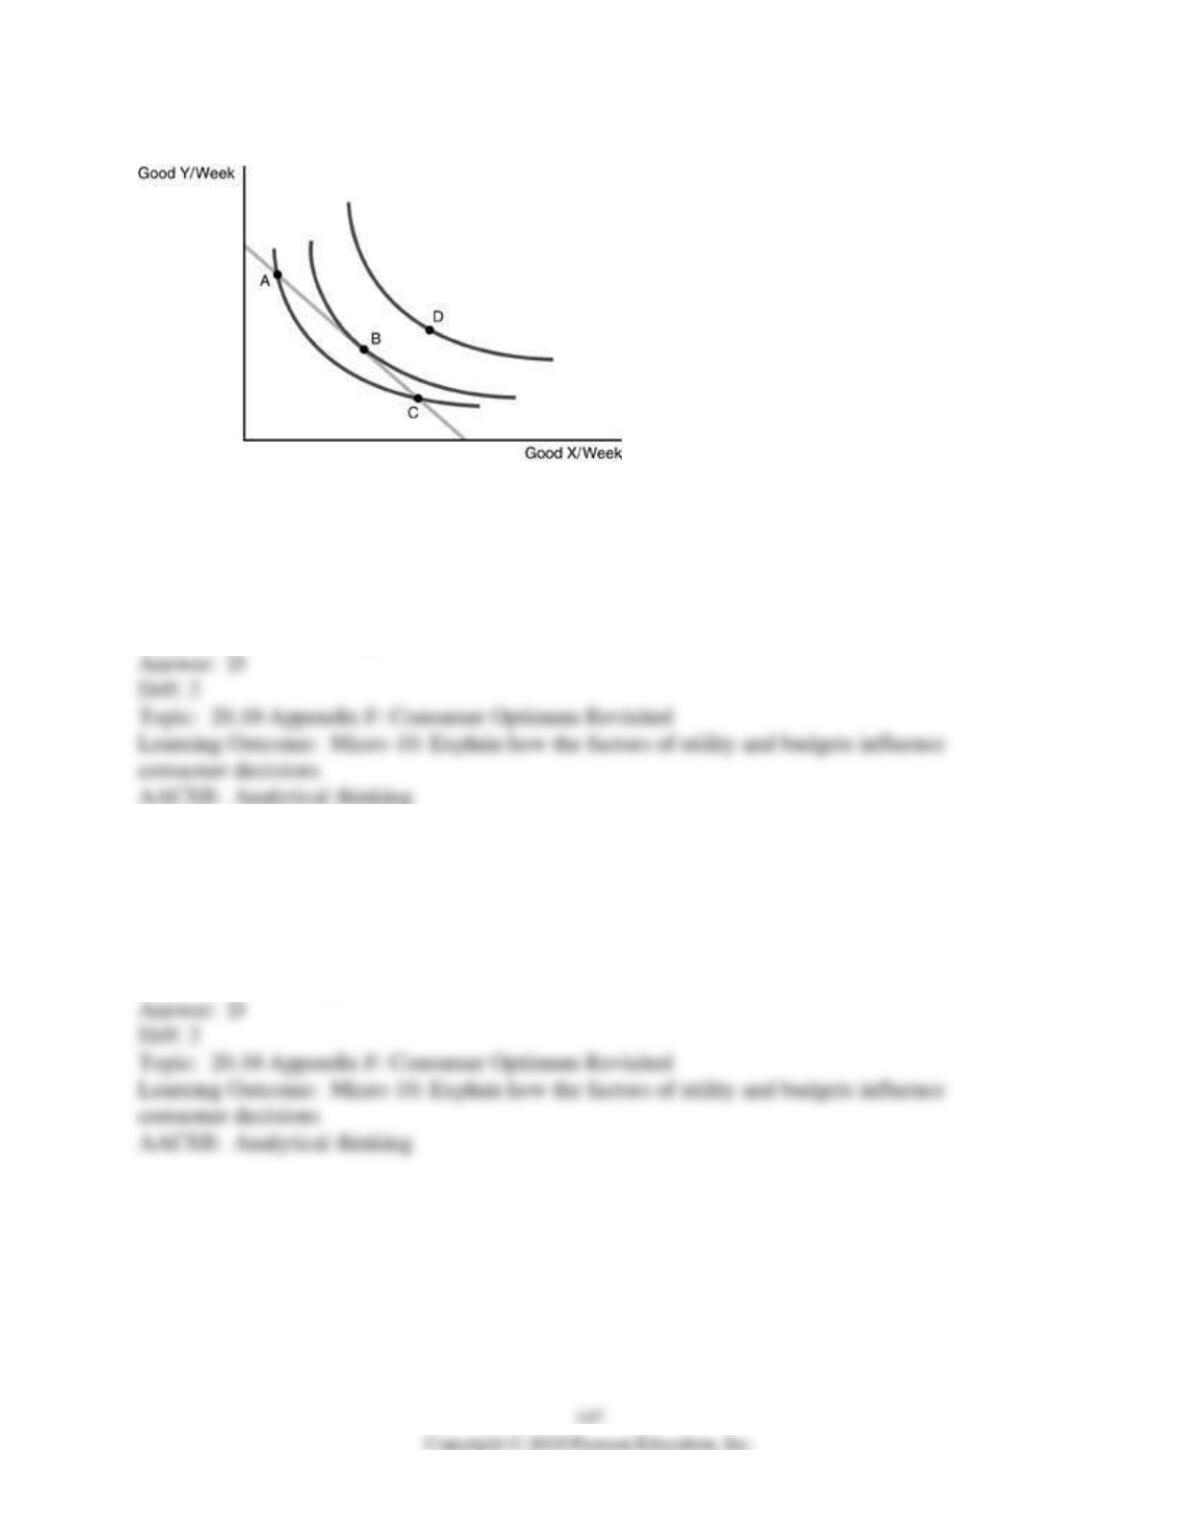
13) Refer to the above figure. Given the indifference map and budget constraint represented
above, what are all possible points at which that the individual can consume?
A) points A and C only
B) point B only
C) point D only
D) points A, B and C only
14) Refer to the above figure. Given the indifference map and budget constraint represented
above, what would make all possible points attainable for the individual to consume?
A) an increase in the price of Good X
B) a decrease in income
C) an increase in the price of Good Y
D) a decrease in the price of Good X
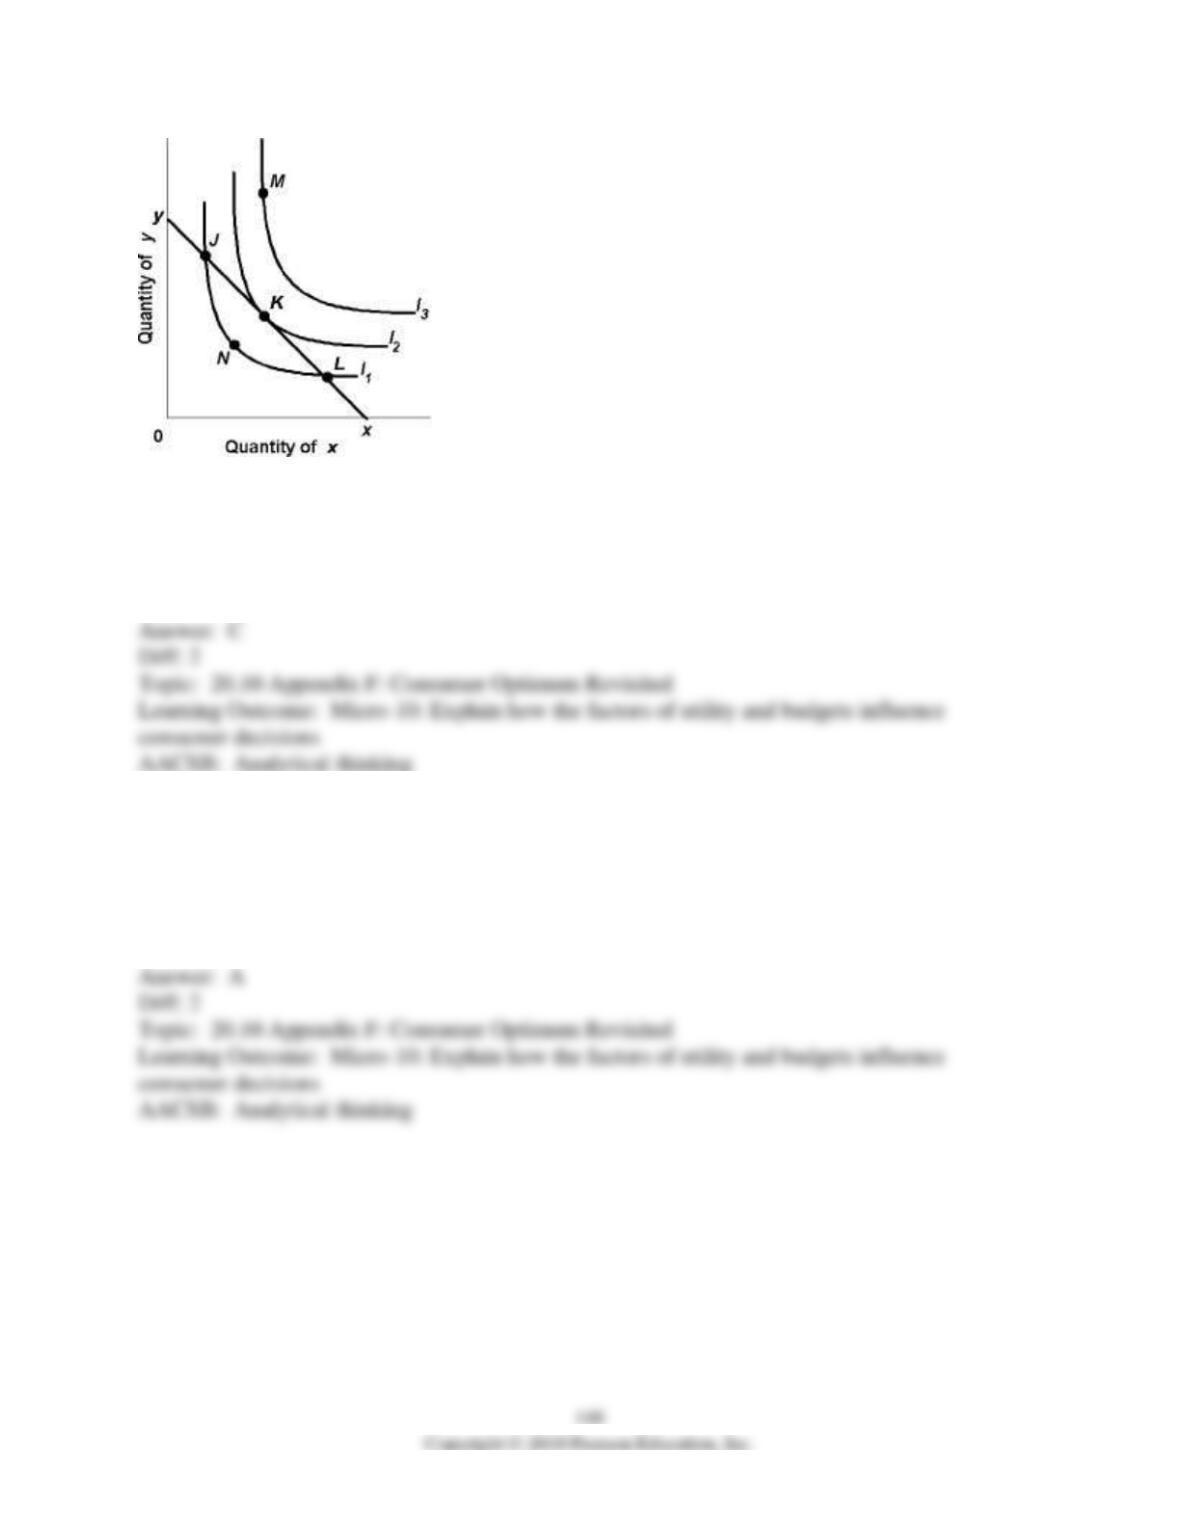
15) Use the above figure. The optimal position for the consumer is at
A) J or L.
B) M.
C) K.
D) N.
16) Use the above figure. What would make all possible points attainable for the individual to
consume?
A) a decrease in the price of good y
B) an increase in the price of good y
C) an increase in the price of good x
D) a decrease in income
17) Use the above figure. What does point N represent?
A) a consumer maximizing her satisfaction
B) a consumer not maximizing her satisfaction
C) a consumer is spending more than her current income
D) a less satisfying point than compared to point J
18) When indifference curve analysis is used, a consumer optimum occurs at the point at which
A) the indifference curves intersect.
B) the indifference curve is tangent to the budget line.
C) total utility is maximum.
D) marginal utility/price ratio of all goods consumed is equal.
19) If a consumer chooses a combination of goods that are inside of her budget line, than
A) the consumer is maximizing her satisfaction.
B) the consumer is spending more than her current income.
C) the consumer has a constant marginal rate of substitution for the two goods.
D) the consumer is not maximizing her satisfaction.
20) A consumer optimum is characterized by
A) the marginal rate of substitution of one good divided by its price equal to the marginal rate of
substitution of the other good divided by its price.
B) the marginal rate of substitution equal to unity.
C) the marginal rate of substitution equal to the ratio of the prices of the two goods.
D) the marginal rate of substitution divided by the price ratio of the two goods equal to the
income of the consumer.
20.11 Appendix F: Deriving the Demand Curve
1) If the quantity of hamburgers is measured along the horizontal axis and the quantity of movies
is measured along the vertical axis, an increase in the price of a movie would be shown by
A) shifting the budget constraint in towards the origin.
B) shifting the budget constraint out.
C) rotating the budget constraint around the horizontal intercept such that the new vertical
intercept is closer to the origin.
D) making the budget constraint steeper.
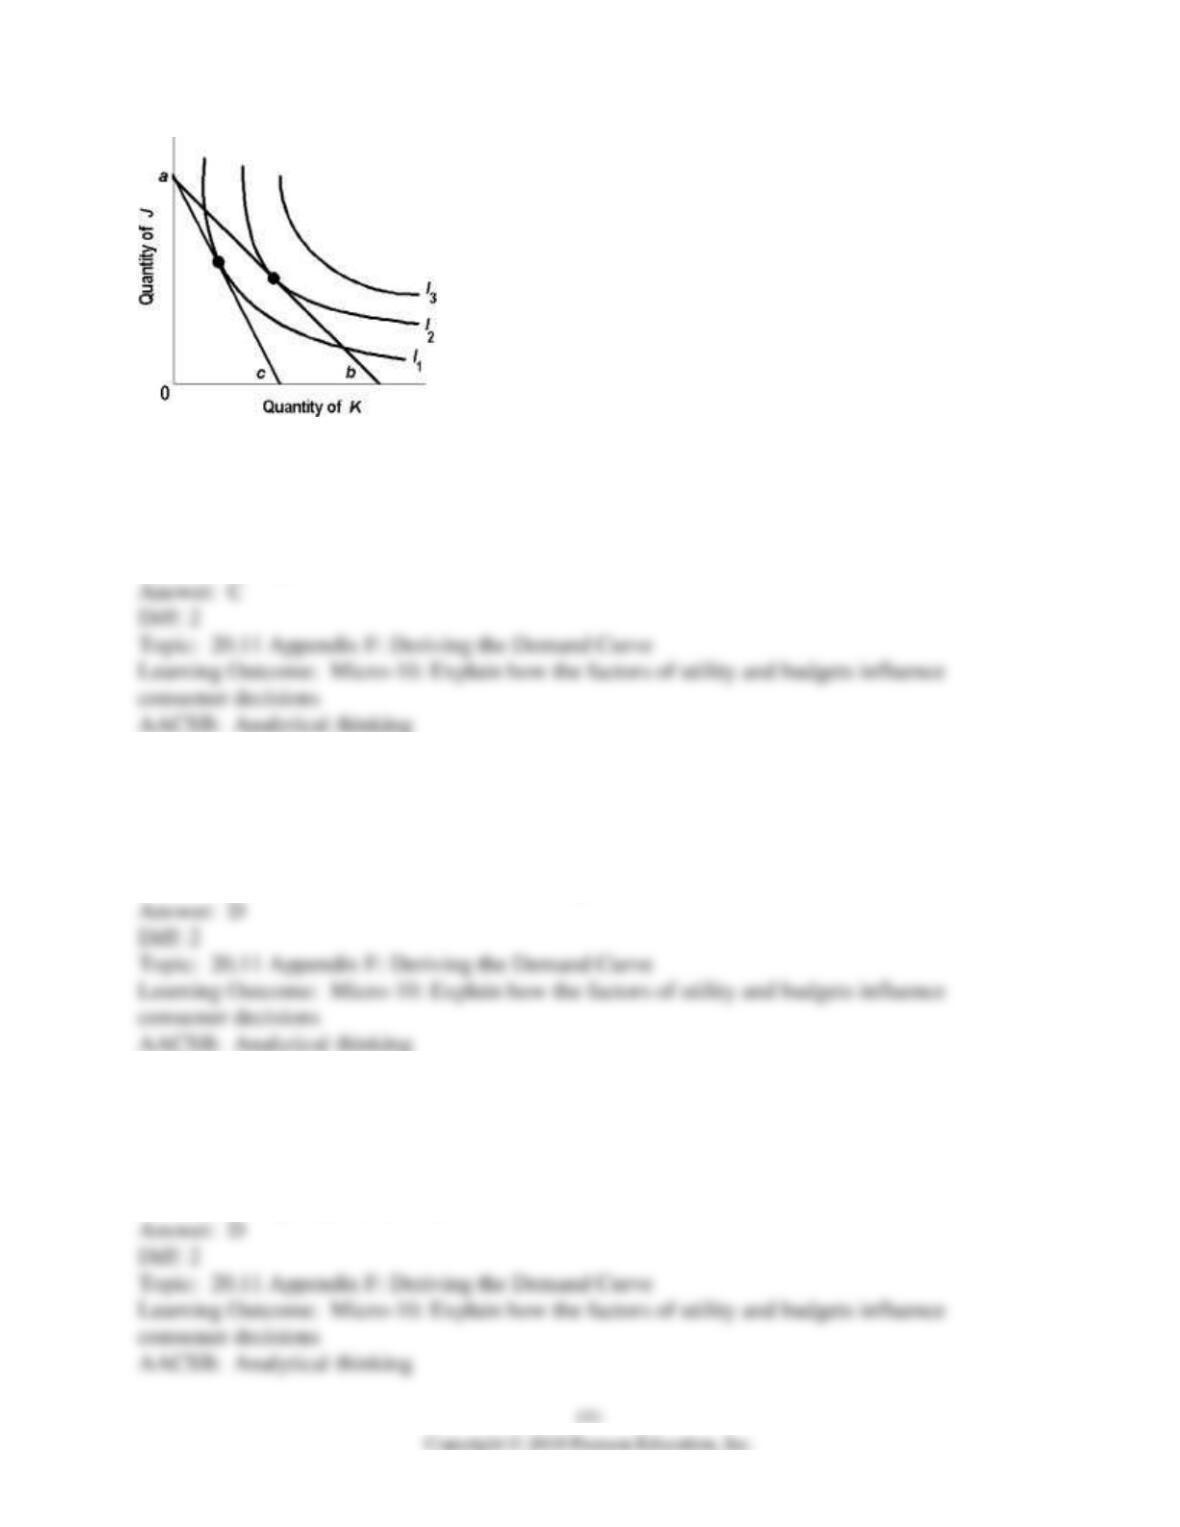
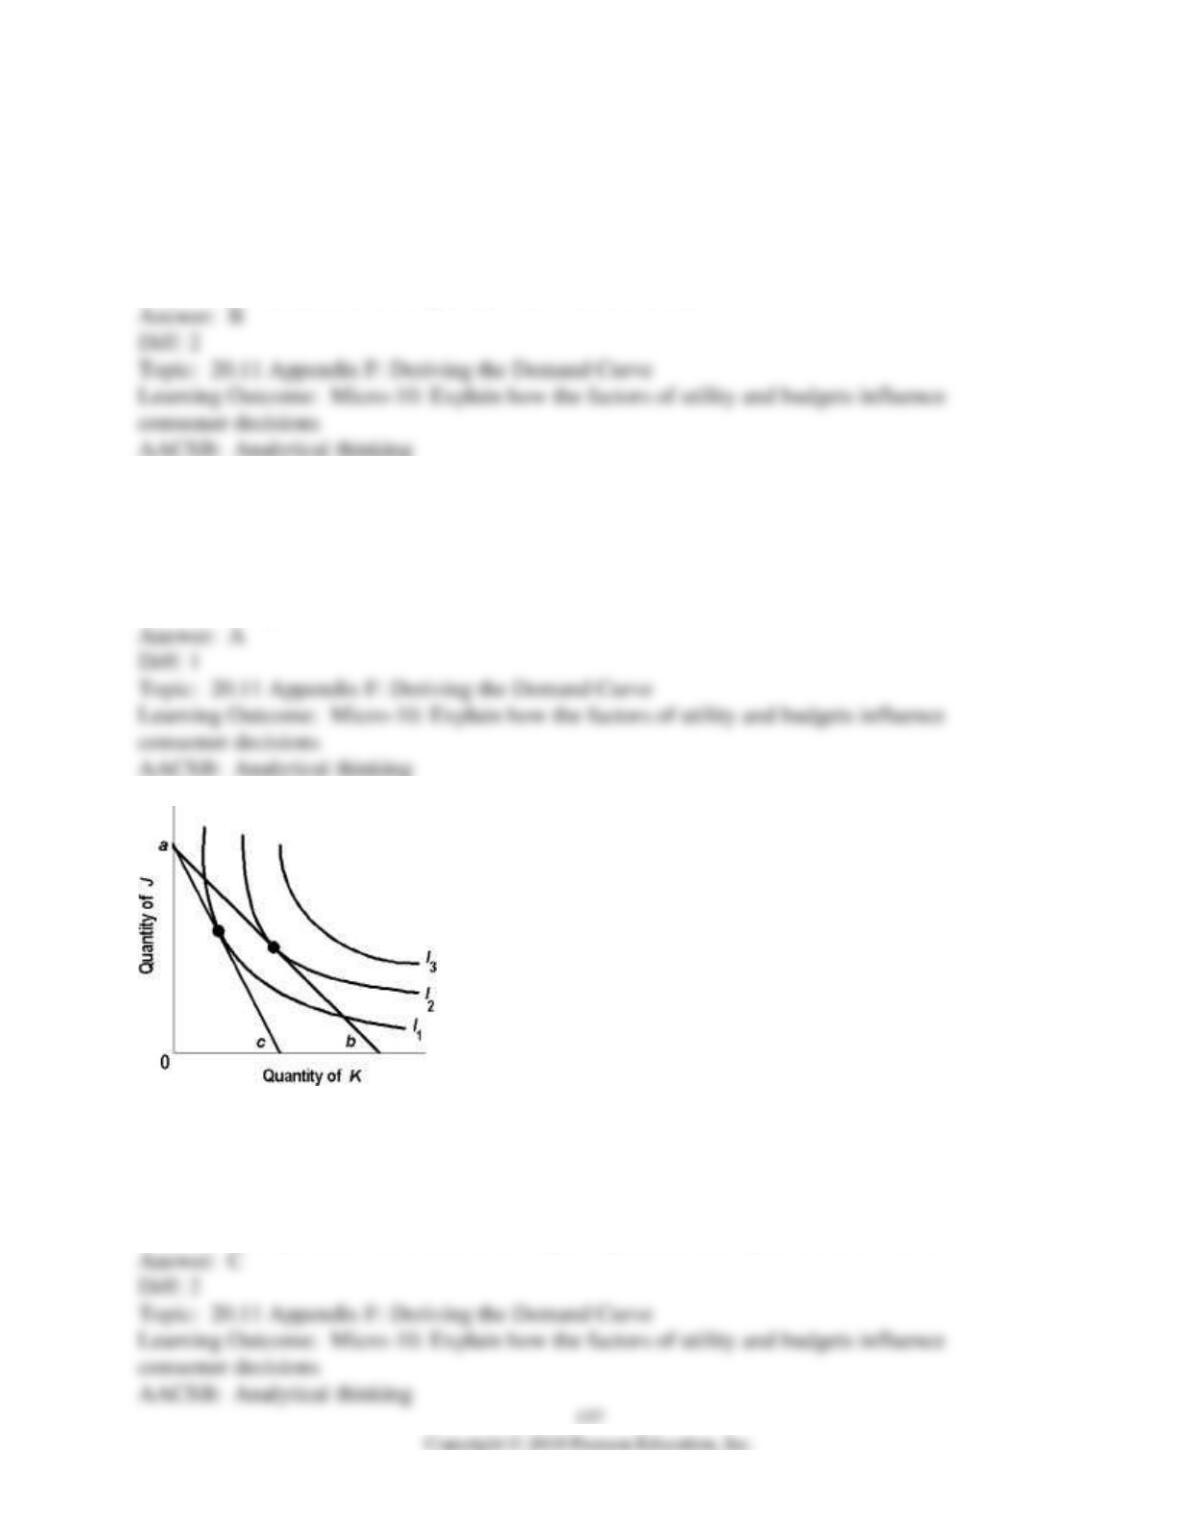
2) Use the above figure. When the budget line rotates from “b” to “c”
A) the price of product J increases.
B) the price of product J decreases.
C) the price of product K increases.
D) the price of product K decreases.
3) Use the above figure. When the budget line rotates from “b” to “c”
A) fewer units of J and fewer units of K will be purchased.
B) more units of J and more units of K will be purchased.
C) fewer units of J and more units of K will be purchased.
D) more units of J and fewer units of K will be purchased.
4) Use the above figure. When the budget line rotates from “c” to “b”
A) the price of product J increases.
B) the price of product J decreases.
C) the price of product K increases.
D) the price of product K decreases.
5) Use the above figure. When the budget line rotates from “c” to “b”
A) fewer units of J and fewer units of K will be purchased.
B) more units of J and more units of K will be purchased.
C) fewer units of J and more units of K will be purchased.
D) more units of J and fewer units of K will be purchased.
6) If price of a product falls
A) the marginal utility of the product also falls.
B) the budget line rotates to the right.
C) the budget line rotates to the left.
D) the indifference curve will shift to the left.
7) Use the above figure. Last week Joe consumed combination “B” of goods “X” and “Y.” This
week he purchased combination “A.” The reason for this change is that the
A) price of good X has increased.
B) price of good X has decreased.
C) price of good Y has decreased.
D) price of good Y has increased.
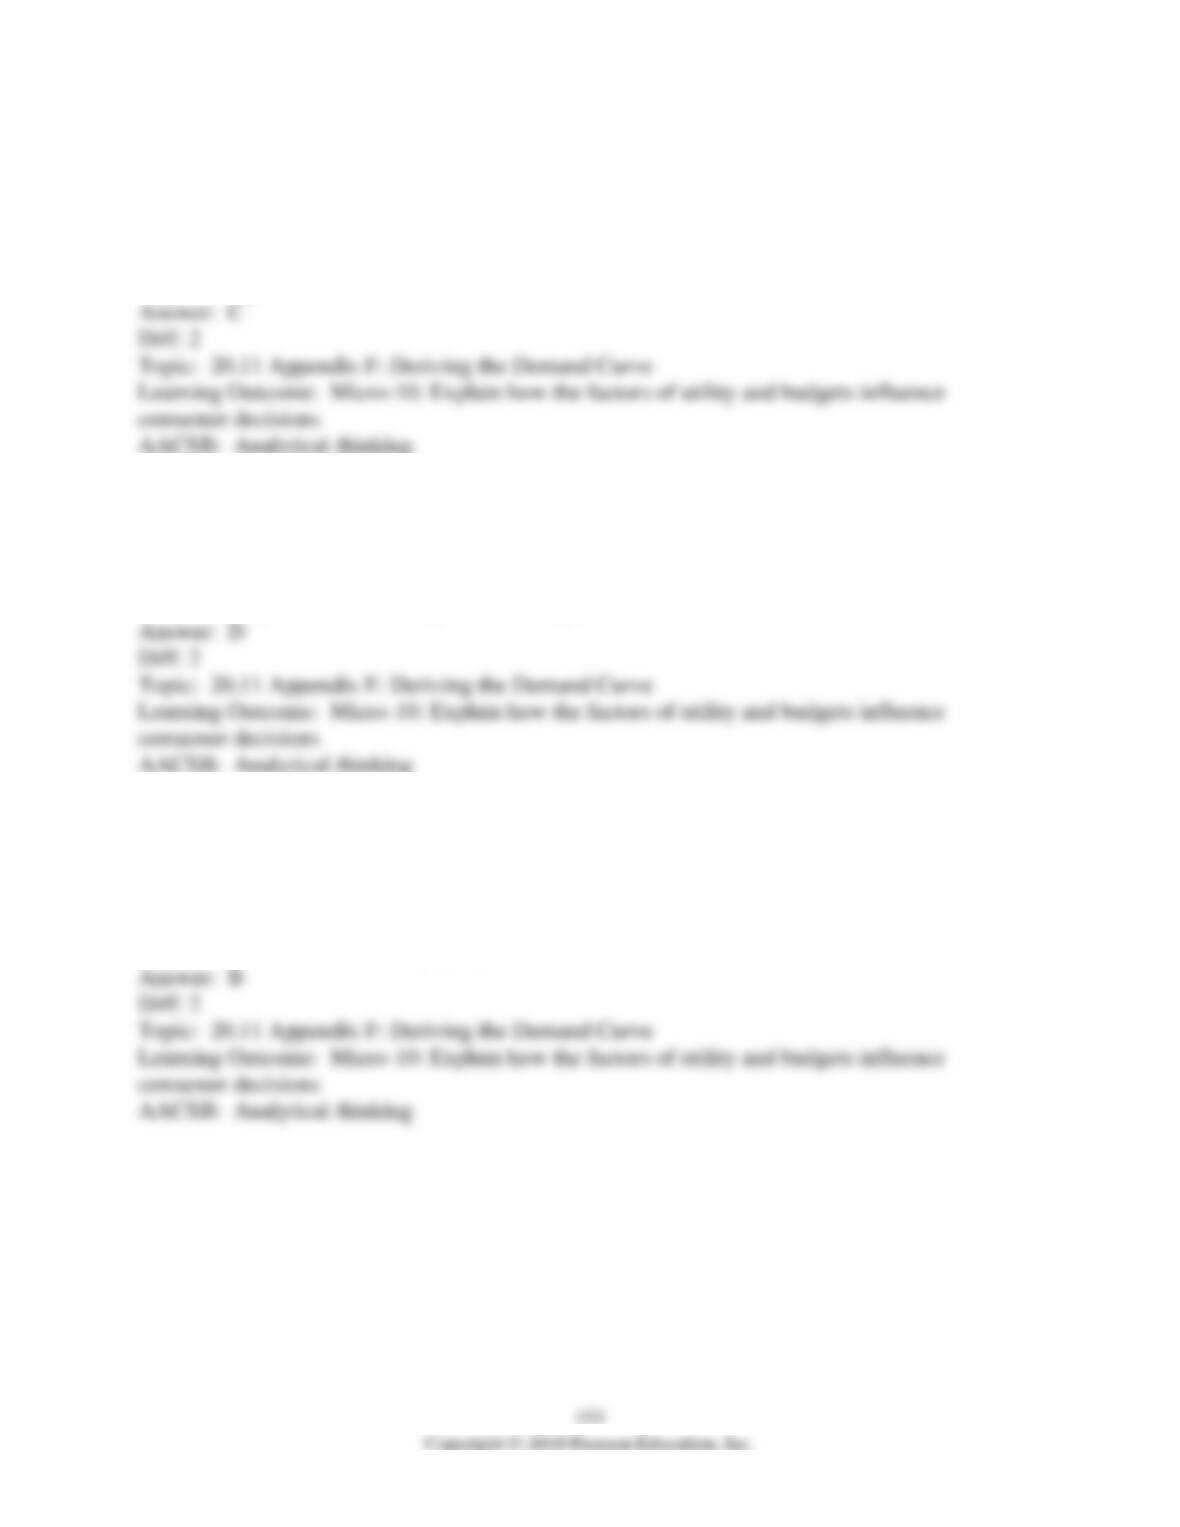
8) Use the above figure. Last week Joe consumed combination “A” of goods “X” and “Y.” This
week he purchased combination “B.” The reason for this change is that the
A) price of good X has increased.
B) price of good X has decreased.
C) price of good Y has decreased.
D) price of good Y has increased.
9) The slope of the budget line will change
A) when the consumer’s income increases.
B) when the consumer’s taste changes.
C) when the total satisfaction changes.
D) when the price of one of the products changes.
10) Holding all other prices and money income constant, if the price of food rises, then the
consumer will adjust her expenditures and
A) reach an optimum on a higher indifference curve.
B) reach an optimum on a lower indifference curve.
C) reach an optimum on the same indifference curve.
D) her level of satisfaction may go up or down.
11) If the budget line rotates, then we know that
A) income has changed.
B) their has been a change in the consumer’s tastes.
C) the price of one of the goods had changed.
D) the consumer was not maximizing their utility.
12) If the price of a product increases, then
A) the budget line rotates and the optimal quantity demanded, which corresponds to the higher
price, decreases.
B) the budget line rotates and the optimal quantity demanded, which corresponds to the higher
price, increases.
C) the budget line shifts outward and the optimal quantity demanded, which corresponds to the
higher price, decreases.
D) the budget line shifts inward and the optimal quantity demanded, which corresponds to the
higher price, increases.
13) To derive the demand curve from the indifference map
A) vary the price of one good while holding the price of the other good and income constant.
B) vary the prices of both goods while holding income constant.
C) vary the price of one good and income while holding the price of the other good constant.
D) vary income while holding the prices constant.
14) The information on a demand curve is also on a(n)
A) indifference curve.
B) budget constraint.
C) income-consumption curve.
D) price-consumption curve.
15) Suppose that the quantity of hamburgers is measured along the vertical axis and that the
quantity of popcorn is measured along the horizontal axis. The vertical intercept is 10
hamburgers, and the slope of the budget line is -2. If the price of popcorn falls from $1 to $0.50,
then we know that
A) the vertical intercept shifts to 20 hamburgers.
B) the vertical intercept shifts to 5 hamburgers.
C) the horizontal intercept shifts to 10 bags of popcorn.
D) the horizontal intercept shifts to 20 bags of popcorn.
16) Suppose that the quantity of hamburgers is measured along the vertical axis and that the
number of bags of popcorn is measured along the horizontal axis. The budget constraint has a
vertical intercept of 10 hamburgers, and the slope of the line is -1. If the price of popcorn
doubles, we know that
A) the consumer will buy half as many bags of popcorn as before.
B) the new equilibrium will have a marginal rate of substitution of -2.
C) the new equilibrium will have a marginal rate of substitution of -0.5.
D) the vertical axis of the budget line shifts to 5 hamburgers.
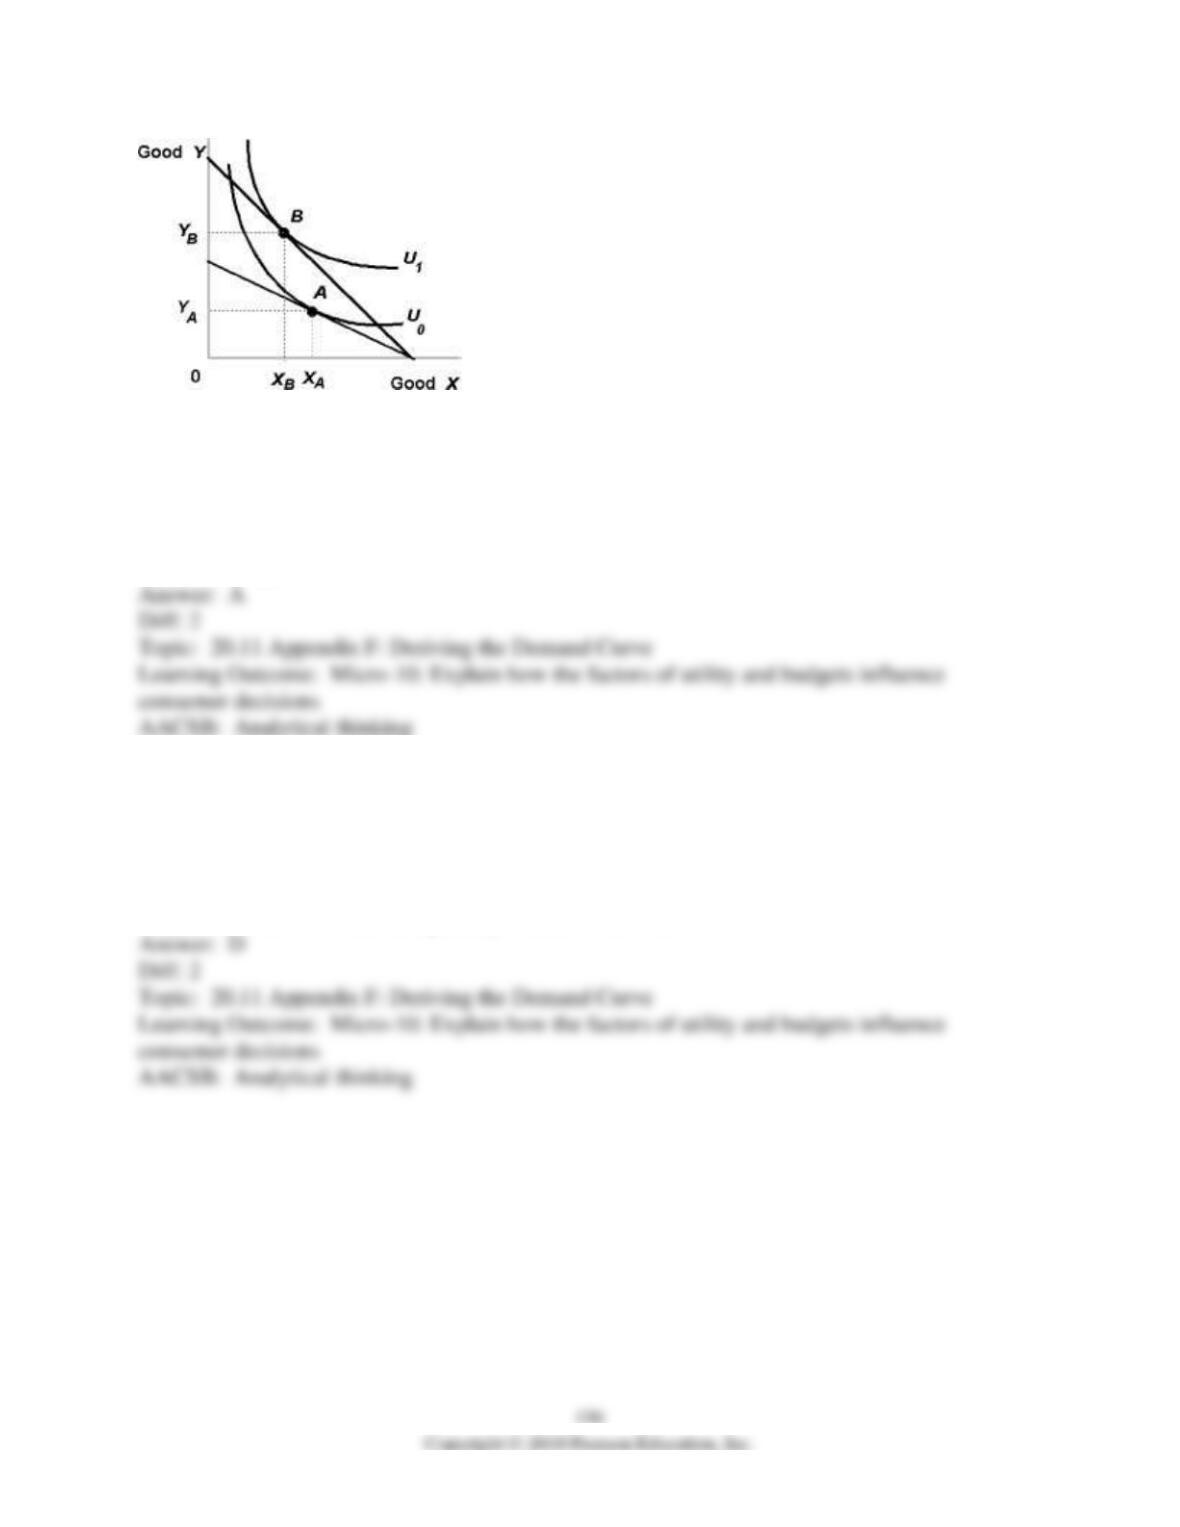
17) Use the above figure. The consumer’s choice changes from YB to YA. Which of the
following statements is TRUE?
A) This change in the consumer’s choice results from a rise in the price of good Y.
B) This change in the consumer’s choice results from a fall in the price of good X.
C) This change in the consumer’s choice results from a rise in the price of good X.
D) This change in the consumer’s choice results from an increase in the consumer’s income.
18) Use the above figure. The consumer’s choice changes from YB to YA. Which of the
following statements about good Y is TRUE?
A) price has increased and the quantity demanded has risen.
B) price has decreased and the quantity demanded has risen.
C) price has decreased and the quantity demanded has fallen.
D) price has increased and the quantity demanded has fallen.
19) Use the above figure. The consumer’s choice changes from YA to YB. Which of the
following statements about good Y is TRUE?
A) price has increased and the quantity demanded has risen.
B) price has decreased and the quantity demanded has risen.
C) price has decreased and the quantity demanded has fallen.
D) price has increased and the quantity demanded has fallen.
20) To derive the demand curve for good X, all the following are constant EXCEPT
A) the price of good X.
B) income.
C) the price of good Y.
D) tastes and preferences.
21) Use the above figure. When the budget line rotates from “b” to “c”
A) the price of product J increases and the quantity demanded of product J decreases.
B) the price of product J decreases and the quantity demanded of product J increases.
C) the price of product K increases and the quantity demanded of product K decreases.
D) the price of product K decreases and the quantity demanded of product K increases.
158
22) Use the above figure. When the budget line rotates from “c” to “b”
A) the price of product J increases and the quantity demanded of product J decreases.
B) the price of product J decreases and the quantity demanded of product J increases.
C) the price of product K increases and the quantity demanded of product K decreases.
D) the price of product K decreases and the quantity demanded of product K increases.
23) How does an increase in the price of an individual good or service affect a consumer
optimum, and how does this help explain the law of demand?