c.
in-kind transfers only.
d.
income only.
62. The poverty rate is a measure of the percentage of people whose incomes fall below
a.
a relative level of income.
b.
an absolute level of income.
c.
the median income for a family of three.
d.
the bottom 20 percent of the income distribution.
63. The poverty rate is
a.
a measure of income inequality across families.
b.
the percentage of the population whose family income falls below a specified level.
c.
an absolute level of income set by the federal government for each family size.
d.
measured by the number of in-kind transfers that a family receives.
64. In 2011, the poverty rate in the United States was
a.
5.9 percent.
b.
11.1 percent.
c.
15.0 percent.
d.
22.4 percent.
65. Over the past 50 years, the U.S. poverty rate was at its lowest level in
a.
1973.
b.
1980.
c.
1990.
d.
2008.
66. Since 1959 when the official data on the poverty rate began, the poverty rate was at its highest in
a.
1959.
b.
1968.
c.
1977.
d.
1986.
67. A commonly-used gauge of poverty is the
a.
income inequality rate.
b.
average income rate.
c.
poverty rate.
d.
social inequality rate.
68. The percentage of families with incomes below the poverty line
a.
is defined as the 10 percent of U.S.households with the lowest incomes.
b.
is known as the poverty rate.
c.
is known as the unemployment rate.
d.
rises as the general income level rises.
69. Measures of poverty that fail to account for the value of in-kind transfers
a.
understate the actual poverty rate.
b.
have little effect on the validity of reported poverty rates.
c.
are generally more reliable measures of actual poverty rates.
d.
overstate the actual poverty rate.
70. Since the early 1970s, average incomes have
a.
increased, which has reduced the poverty rate.
b.
increased, while the poverty rate increased slightly.
c.
decreased, while the poverty rate has remained unchanged.
d.
remained unchanged, while the poverty rate has decreased.
71. In 2011, the poverty rate in the United States was 15 percent. This means that 15 percent
a.
of the population had a total family income that fell below the poverty line.
b.
of the population had a total family income that was above the poverty line.
c.
of the population had a total family income below $10,000.
d.
of the population had a total family income above $50,000.
72. The poverty line in the country of Inequalia is $10,000. The distribution of income for Inequalia is as follows:
Number of Families
Income
200
less than $5,000
300
between $5,000 and $10,000
500
between $10,000 and $15,000
700
between $15,000 and $20,000
100
over $20,000
The poverty rate in Inequalia is
a.
11.1 percent.
b.
16.7 percent.
c.
27.8 percent.
d.
55.5 percent.
73. The poverty line in the country of Inequalia is $7,800. The distribution of income for Inequalia is as follows:
Number of Families
Income
200
less than $5,000
300
between $5,000 and $10,000
500
between $10,000 and $15,000
700
between $15,000 and $20,000
300
over $20,000
The poverty rate in Inequalia is
a.
7.8 percent.
b.
between 10 percent and 25 percent.
c.
between 25 percent and 50 percent.
d.
39 percent.
74. The distribution of income for Inequalia is as follows:
Number of Families
Income
200
less than $5,000
300
between $5,000 and $10,000
500
between $10,000 and $15,000
700
between $15,000 and $20,000
300
over $20,000
If the poverty rate in Inequalia is 25 percent, what is the poverty line in Inequalia?
a.
$5,000
b.
$10,000
c.
$15,000
d.
$20,000
75. The poverty line in the country of Dismal is $20,000. The distribution of income for Dismal is as follows:
Number of Families
Income
1,000
less than $10,000
2,000
between $10,000 and $20,000
2,000
between $20,000 and $30,000
800
between $30,000 and $40,000
200
over $40,000
The poverty rate in Dismal is
a.
16.7 percent.
b.
33.3 percent.
c.
50 percent.
d.
83.3 percent.
76. The distribution of income for Dismal is as follows:
Number of Families
Income
1,000
less than $10,000
2,000
between $10,000 and $20,000
2,000
between $20,000 and $30,000
800
between $30,000 and $40,000
200
over $40,000
If the poverty rate in Dismal is 50 percent, what is the poverty line in Dismal?
a.
$10,000.
b.
$20,000.
c.
$30,000.
d.
$40,000.
77. The distribution of income for Dismal is as follows:
Number of Families
Income
1,000
less than $10,000
2,000
between $10,000 and $20,000
2,000
between $20,000 and $30,000
800
between $30,000 and $40,000
200
over $40,000
If the poverty rate in Dismal is about 17 percent, what is the poverty line in Dismal?
a.
$10,000.
b.
$20,000.
c.
$30,000.
d.
$40,000.
78. The distribution of income for Danville is as follows:
Number of Families
Income
500
less than $15,000
600
between $15,000 and $20,000
1,000
between $20,000 and $25,000
700
between $25,000 and $30,000
500
over $30,000
If the poverty rate in Danville is 33.3 percent, what is the poverty line in Danville?
a.
$15,000.
b.
$20,000.
c.
$25,000.
d.
$30,000.
79. The poverty line in the country of Abbyville is $15,000. The distribution of income for Abbyville is as follows:
Number of Families
Income
300
less than $15,000
500
between $15,000 and $20,000
900
between $20,000 and $25,000
600
between $25,000 and $30,000
200
over $30,000
The poverty rate in Abbyville is
a.
12 percent.
b.
32 percent.
c.
50 percent.
d.
68 percent.
80. The distribution of income for Abbyville is as follows:
Number of Families
Income
300
less than $15,000
500
between $15,000 and $20,000
900
between $20,000 and $25,000
600
between $25,000 and $30,000
200
over $30,000
If the poverty rate in Abbyville is 12 percent, what is the poverty line in Abbyville?
a.
$15,000.
b.
$20,000.
c.
$25,000.
d.
$30,000.
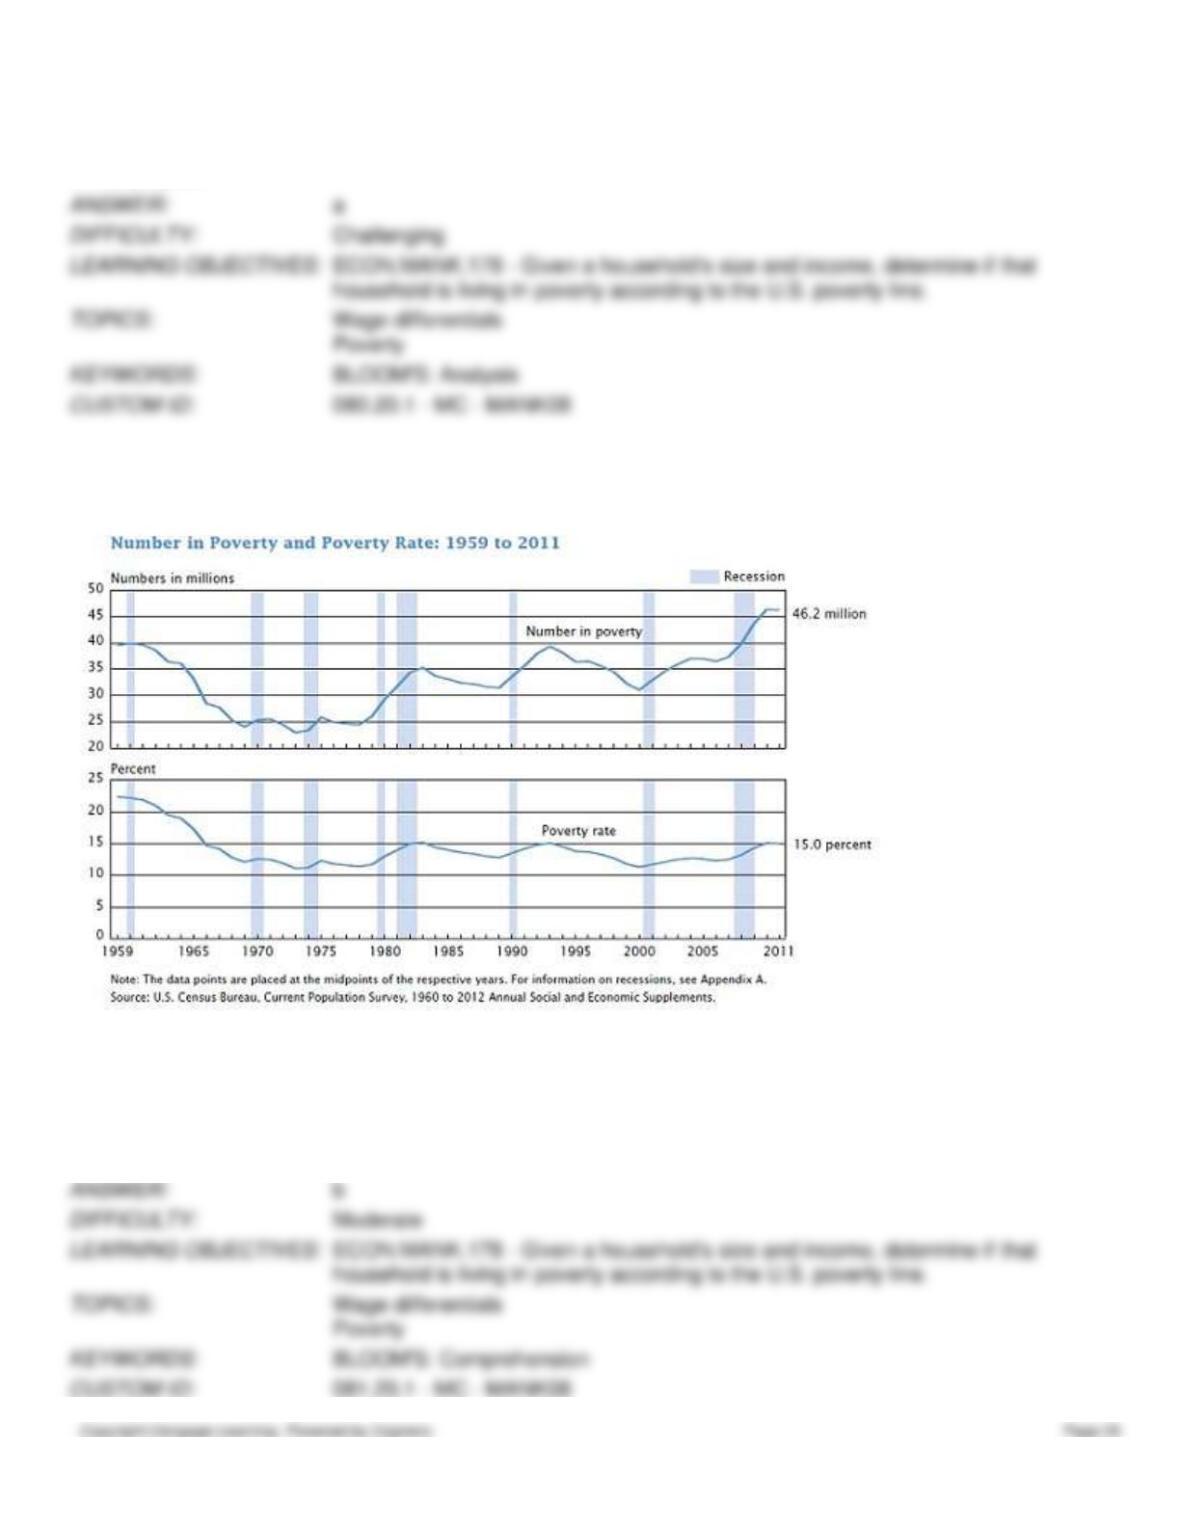
Figure 20-1
Number of Poor
81. Refer to Figure 20-1. Between 1959 and 2011 the poverty rate has
a.
increased overall.
b.
decreased overall.
c.
stayed the same overall.
d.
moved in the opposite direction of the number of people in poverty.
82. Refer to Figure 20-1. The absolute number of people in poverty
a.
is higher in 2011 than in 1959.
b.
is lower in 2011 than in 1959.
c.
has not changed between 1959 and 2011.
d.
has steadily decreased between 1959 and 2011.
83. Refer to Figure 20-1. Between 1965 and 2011, during recessions (the shaded bars) the number of individuals in
poverty has
a.
increased.
b.
decreased.
c.
not changed.
d.
decreased and then increased.
Figure 20-2
84. Refer to Figure 20–2. Which of the following is consistent with the data reported in the figure?
a.
The female poverty rate is higher for all age groups than the male poverty rate.
b.
The disparity between male and female poverty increases with age.
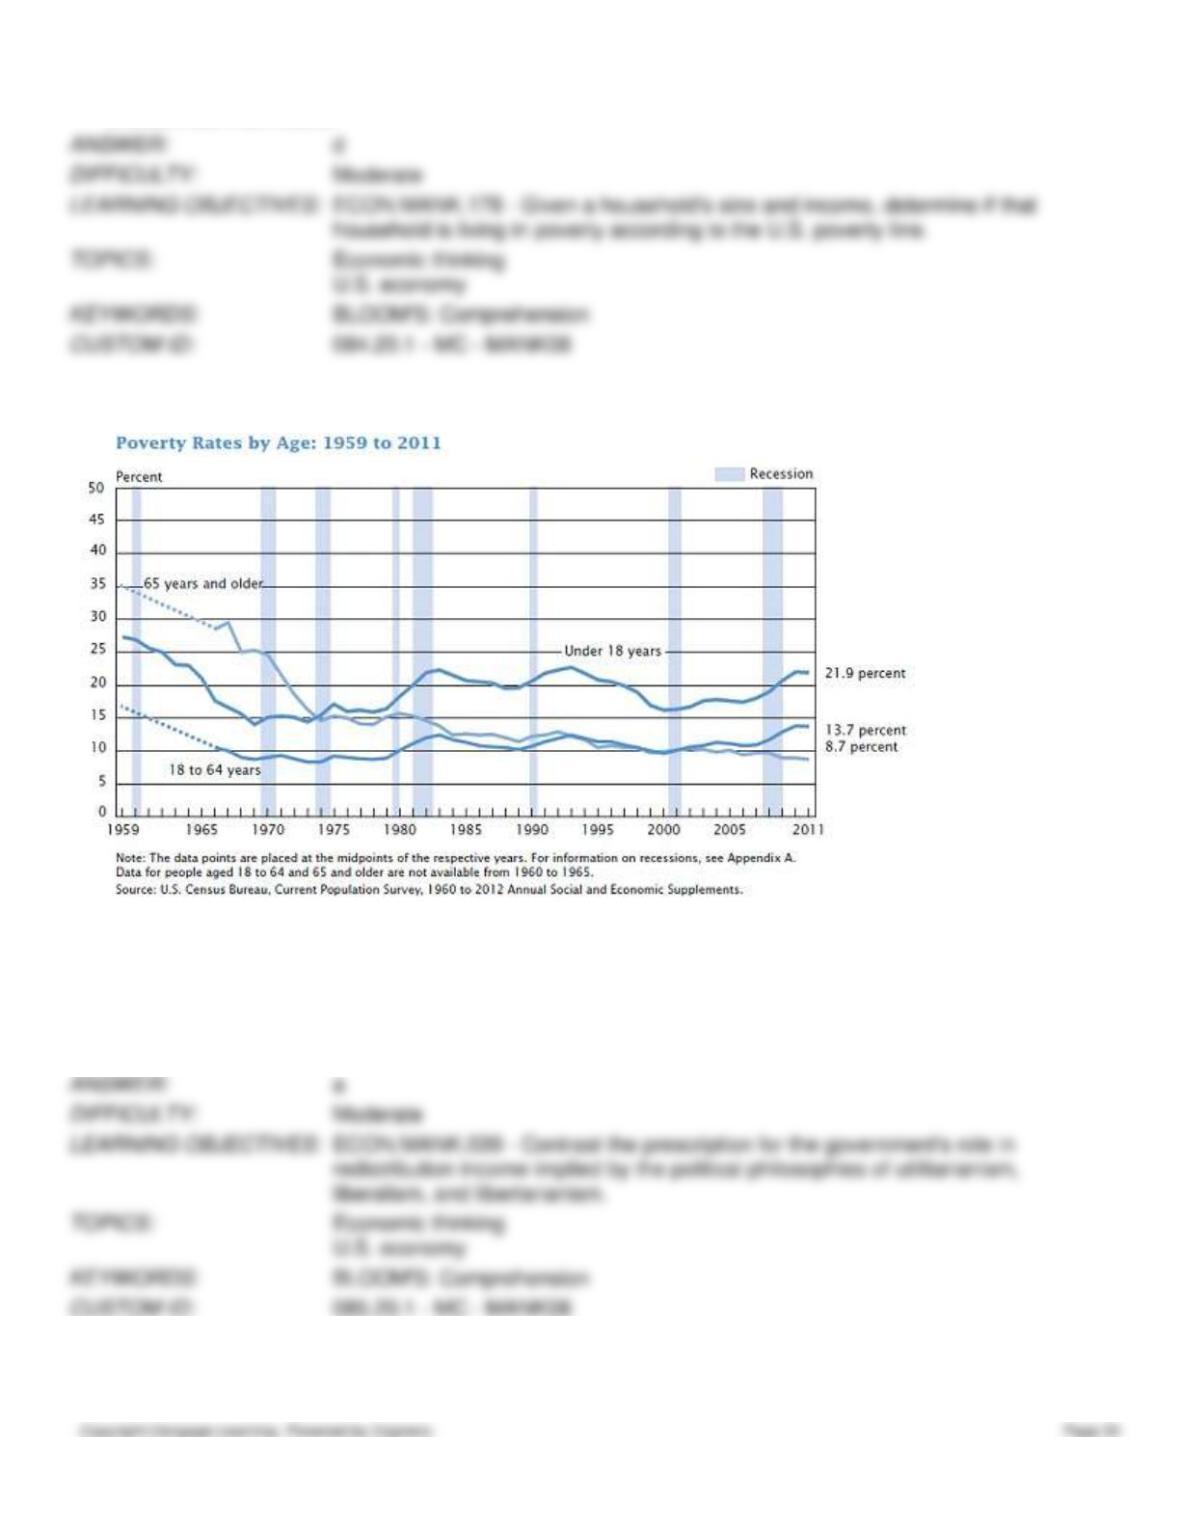
c.
Neither a nor b are correct.
d.
Both a and b are correct.
Figure 20-3
85. Refer to Figure 20–3. Which of the following is consistent with the data reported in the figure?
a.
Policies to reduce elderly (65 years and older) poverty rates since 1959 seem to have been effective.
b.
The age group suffering the highest poverty rate in recent years has been 18 to 64 year olds.
c.
Policies to reduce youth (under 18 years) poverty rates since 1959 seem to have been effective.
d.
All of the above are correct.
86. Refer to Figure 20–3. In 2011, the percent of children under age 18 in poverty is
a.
higher than both the percentage of adults aged 18 to 64 and the percentage of elderly aged 65 years and over in
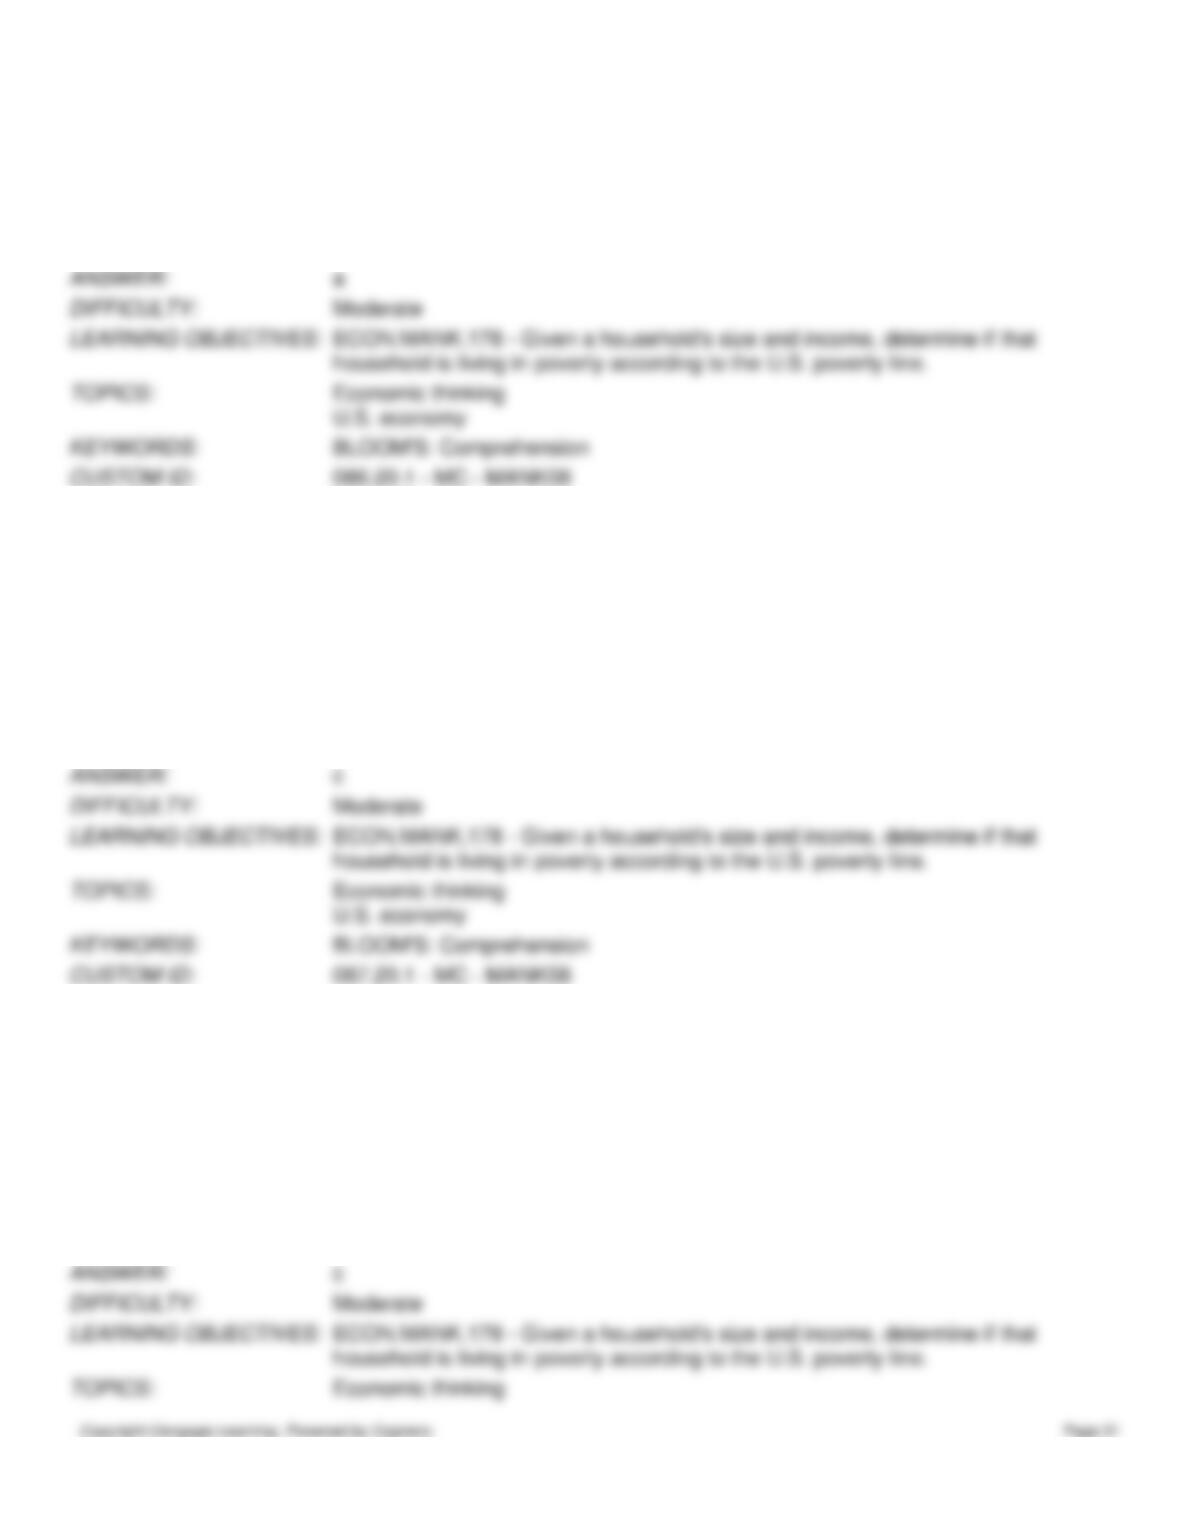
poverty.
b.
higher than the percentage of adults aged 18 to 64 but is lower than the percentage of elderly aged 65 years
and over in poverty.
c.
lower than both the percentage of adults aged 18 to 64 and the percentage of elderly aged 65 years and over in
poverty.
d.
lower than the percentage of adults aged 18 to 64 but is higher than the percentage of elderly aged 65 years
and over in poverty.
87. Refer to Figure 20-3. In 1968, the percent of adults aged 18 to 64 years in poverty is
a.
higher than both the percentage of children under age 18 and the percentage of elderly aged 65 and over in
poverty.
b.
higher than the percentage of children under age 18 but is lower than the percentage of elderly aged 65 and
over in poverty.
c.
lower than both the percentage of children under age 18 and the percentage of elderly aged 65 and over in
poverty.
d.
lower than the percentage of children under age 18 but is higher than the percentage of elderly aged 65 and
over in poverty.
88. Refer to Figure 20-3. In 2011, the percent of adults between ages 18 and 64 in poverty is
a.
higher than both the percentage of children under age 18 and the percentage of elderly aged 65 and over in
poverty.
b.
higher than the percentage of children under age 18 but is lower than the percentage of elderly aged 65 and
over in poverty.
c.
is lower than the percentage of children under age 18 but is higher than the percentage of elderly aged 65 and
over in poverty.
d.
is lower than the percentage of children under age 18 and is equal to the percentage of elderly aged 65 and
over in poverty.
89. Refer to Figure 20–3. In 1968, the percent of children under age 18 in poverty is
a.
higher than both the percentage of adults aged 18 to 64 and the percentage of elderly aged 65 and over in
poverty.
b.
higher than the percentage of adults aged 18 to 64 but is lower than the percentage of elderly aged 65 and over
in poverty.
c.
lower than both the percentage of adults aged 18 to 64 and the percentage of elderly aged 65 and over in
poverty.
d.
lower than the percentage of adults aged 18 to 64 but is higher than the percentage of elderly aged 65 and over
in poverty.
90. Refer to Figure 20-3. In 1968, the percent of elderly aged 65 and over in poverty is
a.
higher than both the percentage of adults aged 18 to 64 and the percentage of children under age 18 in poverty.
b.
higher than the percentage of adults aged 18 to 64 but is lower than the percentage of children under age 18 in
poverty.
c.
lower than both the percentage of adults aged 18 to 64 and the percentage of children under age 18 in poverty.
d.
is lower than the percentage of adults aged 18 to 64 but is higher than the percentage of children under age 18
in poverty.
91. Refer to Figure 20-3. In 2011, the percent of elderly aged 65 and over in poverty is
a.
higher than both the percentage of adults aged 18 to 64 and the percentage of children under age 18 in poverty.
b.
higher than the percentage of adults aged 18 to 64 but is lower than the percentage of children under age 18 in
poverty.
c.
lower than both the percentage of adults aged 18 to 64 and the percentage of children under age 18 in poverty.
d.
lower than the percentage of children under age 18 but is equal to the percentage of adults aged 18 to 64 in
poverty.
92. Refer to Figure 20-3. Which of the following best describes the poverty rates by age from 1965 to 2011?
a.
The poverty rates by age have declined for all age groups.
b.
The percentage of people living in poverty has consistently been highest for the elderly aged 65 and over and
lowest for adults aged 18 to 64.
c.
The percentage of children under age 18 and the percentage of adults aged 18 to 64 have maintained a similar
trend while the percentage of elderly aged 65 and over has decreased significantly.
d.
The poverty rates by age have increased for all age groups.
93. In 2011, the poverty line for a family of four in the U.S. was
a.
$60,974.
b.
$23,021.
c.
$20,988.
d.
$17,642.
94. The poverty line is adjusted each year to reflect changes in the
a.
number of people currently on public assistance.
b.
level of prices.
c.
nutritional content of an “adequate” diet.
d.
size of a family.
95. The federal government sets the poverty line at roughly
a.
five times the cost of providing an adequate diet.
b.
four times the cost of providing an adequate diet.
c.
three times the cost of providing an adequate diet.
d.
two times the cost of providing an adequate diet.
96. The income level below which families are said to be poor is known as the
a.
income maintenance threshold.
b.
poverty line.
c.
bottom quintile of the income distribution.
d.
minimum wage.
97. The poverty rate is the percentage of the population that have a family income level below the
a.
income maintenance threshold.
b.
poverty line.
c.
bottom quintile of the income distribution.
d.
minimum wage.
98. If the U.S. government determines that the cost of feeding an urban family of four is $7,500 per year, then the official
poverty line for a family of that type is
a.
$7,500.
b.
$15,000.
c.
$22,500.
d.
$30,000.
99. If the U.S. government determines that the cost of feeding an urban family of four is $5,200 per year, then the official
poverty line for a family of that type is
a.
$10,400.
b.
$15,600.
c.
$20,800.
d.
$26,000.
100. The US government sets the poverty line equal to approximately
a.
three times the cost of providing subsidized housing.
b.
three times the cost of providing an adequate diet.
c.
the minimum wage for a single person working 40 hours per week and 50 weeks per year.
d.
the cost of providing food, shelter, and health care expenses for a family of four.
101. The calculation of the poverty line includes adjustments for
a.
energy costs.
b.
child care costs.
c.
the level of prices.
d.
the Earned Income Tax Credit.
102. Which of the following statements is not correct?
a.
The poverty line is an absolute level of income set by the federal government below which a family is
considered to be in poverty.
b.
The poverty line is approximately equal to three times the cost of providing an adequate diet.
c.
The poverty line is adjusted annually to reflect changes in price levels.
d.
The poverty line is adjusted semiannually to reflect changes in fuel prices.
Table 20–11
Poverty Thresholds in 2011, by Size of Family and Number of Related Children Under 18 Years
[Dollars]
Related children under 18 years
Size of family unit
None
One
Two
Three
Four
Five
Six
Seven
Eight or more
One person (unrelated individual)
Under 65 years
11,702
65 years and over
10,788
Two persons
Householder under 65 years
15,063
15,504
Householder 65 years and over
13,596
15,446
Three persons
17,595
18,106
18,123
Four persons
23,201
25,581
22,811
22,891
Five persons
27,979
28,386
27,517
26,844
26,434
Six persons
32,181
32,309
31,643
31,005
30,056
29,494
Seven persons
37,029
37,260
36,463
35,907
34,872
33,665
32,340
Eight persons
41,414
41,779
41,027
40,368
39,433
38,247
37,011
36,697
Nine persons or more
49,818
50,059
49,393
48,835
47,917
46,654
45,512
45,229
43,487
Source: U. S. Bureau of the Census, Current Population Survey.
103. Refer to Table 20–11. What is the poverty line for a family of six with three children?
a.
$29,494
b.
$31,005
c.
$32,181
d.
$26,844
104. Refer to Table 20–11. What is the poverty line for a family of eight with two children?
a.
$18,123
b.
$36,463
c.
$41,027
d.
$43,487
105. Refer to Table 20–11. What is the poverty line for a family of three with one child?
a.
$17,595
b.
$18,106
c.
$18,123
d.
$22,891
106. Refer to Table 20–11. What is the poverty line for a 75-year-old individual?
a.
$10,788
b.
$11,702
c.
$13,596
d.
$15,446
107. Refer to Table 20–11. What is the poverty line for a family with one 35-year-old adult and one child?
a.
$11,702
b.
$15,446
c.
$15,504
d.
$18,106
108. Refer to Table 20–11. What is the poverty line for a family with one 68-year-old adult and one child?
a.
$10,788
b.
$15,446
c.
$15,504
d.
$18,106
109. The poverty line is
a.
established by the federal government.
b.
approximately equivalent to three times the cost of providing an adequate diet.
c.
an absolute level of income below which a family is deemed to be in poverty.
d.
All of the above are correct.
110. Poverty is found to be correlated with
a.
age and race but not family composition.
b.
race only.
c.
race and family composition but not age.
d.
age, race, and family composition.
111. Measuring poverty using an absolute income scale like the poverty line can be misleading because
a.
income measures do not include the value of in-kind transfers.
b.
money is more highly valued by the rich than by the poor.
c.
the poor are not likely to participate in the labor market.
d.
income measures are not adjusted for the effects of labor-market discrimination.
112. Which of the following statements is correct?
a.
The poverty line is a relative standard.
b.
More families are pushed above the poverty line as economic growth pushes the entire income distribution
upward.
c.
Increasing income inequality reduces poverty.
d.
Economic growth, by definition, affects all families equally.
113. Which of the following groups has the highest poverty rate?
a.
blacks
b.
Asians
c.
children (under age 18)
d.
female households, no spouse present
114. Which of the following groups has the lowest poverty rate?
a.
blacks
b.
Asians
c.
children (under age 18)
d.
female households, no spouse present
115. Which of the following is not correct?
a.
Poverty is correlated with race.
b.
Poverty is correlated with age.
c.
Poverty is correlated with family composition.
d.
All of the above are correct.
116. The poverty rate for female households with no spouse present is approximately
a.
10 percent.
b.
20 percent.
c.
30 percent.
d.
40 percent.