
Chapter 20 Consumer Choice 175
2) According to the substitution effect, if the price of a product goes down
A) the consumer will buy more of the good at the lower price than at a higher price, creating a
downward sloping demand curve.
B) the consumer will buy more of the good at a lower price than at a higher price, creating a
horizontal demand curve.
C) the consumer will not change the level of purchases of the good when the price changes,
making the demand curve a vertical line.
D) the real income of the consumer will increase, causing the consumer to want to buy more
of the good, creating a downward sloping demand curve.
3) The inverse relationship between quantity demanded and price of a good or service can be
explained, in part, by
A) a shift in the demand curve.
B) diminishing marginal utility only.
C) diminishing marginal utility and the rule of equal marginal utilities per dollar.
D) the real income effect.
4) Which of the following is FALSE?
A) A consumer is maximizing total utility when he or she gets the same amount of marginal
utility from the last dollar spent on each good purchased.
B) As additional units of a good or service are consumed, marginal utility diminishes.
C) Utility is want satisfying power.
D) Assuming that the law of diminishing marginal utility holds, the demand curve must be
upward sloping.
5) Given the utility optimizing rule and the presence of diminishing marginal utility for a good,
A) the demand curve for the good will be vertical.
B) there will not be a well defined demand curve.
C) there will not be a substitution effect.
D) the demand curve for the good will be negatively sloped.
6) The law of demand is derived under the assumption of
A) constant prices.
B) constant real incomes.
C) constant consumer tastes and preferences.
D) constant marginal utility.
7) The total utility of water is
A) lower than the total and marginal utility of diamonds.
B) lower than the total utility of diamonds, but the marginal utility is higher.
C) higher than the total utility of diamonds, but the marginal utility of diamonds is higher.
D) the same as the total utility of diamonds, but the marginal utilities are the same.
8) The diamond water paradox illustrates the idea that ________ determines what consumers are
willing to pay for a particular good.
A) total utility B) the real income effect
C) marginal utility D) the substitution effect
Quantity of Total Quantity of Total
Hamburgers/Wk Utility Movies/Wk Utility
1 40 1 400
2 60 2 700
3 76 3 850
4 86 4 950
5 91 5 1000
6 93 6 1025
9) Refer to the above table. Suppose the price of a movie is $5 and the income of the consumer is
$29. What are the quantities demanded of hamburger at prices of $2 and $1 respectively?
A) 0; 1 B) 2; 4 C) 1; 2 D) 3; 5
10) Refer to the above table. The price of a hamburger is $2, the price of a movie is $10, and the
consumer has $44. What is the change in quantity demanded of hamburgers if the price of a
hamburger decreases to $1?
A) Quantity demanded increases by 1 hamburger.
B) Quantity demanded increases by 2 hamburgers.
C) Quantity demanded increases by 3 hamburgers.
D) Quantity demanded increases by 4 hamburgers.
11) An individual s demand curve slopes down because
A) marginal utility falls as price falls.
B) the value of the marginal utility falls as the price falls.
C) of the rule that the marginal utility of the last unit must equal the price.
D) of the law of diminishing marginal utility and the rule of equal marginal utilities per
dollar.
12) A consumer was at an optimum. She then discovers that the marginal utility per dollar spent on
food is more than the marginal utility per dollar spent on gasoline. She knows then that
A) the price of gasoline must have decreased.
B) the price of food must have increased.
C) the price of gasoline must have increased or the price of food must have decreased.
D) the price of gasoline must have decreased or the price of food must have increased.
13) To derive the law of demand, we assume that
A) prices are constant. B) real prices are constant.
C) marginal utility is constant. D) tastes are constant.
14) The diamond water paradox is an example that shows that
A) necessities like water should have a higher price.
B) marginal utility rather than total utility determines what people are willing to pay for a
good.
C) there are exceptions to the law of diminishing marginal utility.
D) marginal utility can initially increase and then decrease.
15) Why are diamonds more expensive than water?
A)
b
ecause the last glass of water has higher marginal utility than the last diamond
B)
b
ecause the last diamond has higher marginal utility than the last glass of water
C)
b
ecause you get more total utility from diamonds
D)
b
ecause water is a necessity
16) The diamond water paradox was solved by knowing that
A) the total utility of water is greater than the total utility of diamonds.
B) the marginal utility of water is greater than the marginal utility of diamonds.
C) the price of water and diamonds is determined by total utility received, not marginal
utility.
D) the price of water and diamonds is determined by marginal utility, not total utility.
17) The reason that diamonds cost more than water is
A) the marginal utility of each diamond a consumer purchases is quite high due to the small
amount of diamonds that most consumers purchase.
B) most consumers consume little water.
C) diamonds are more beautiful than water.
D) water is a necessity.
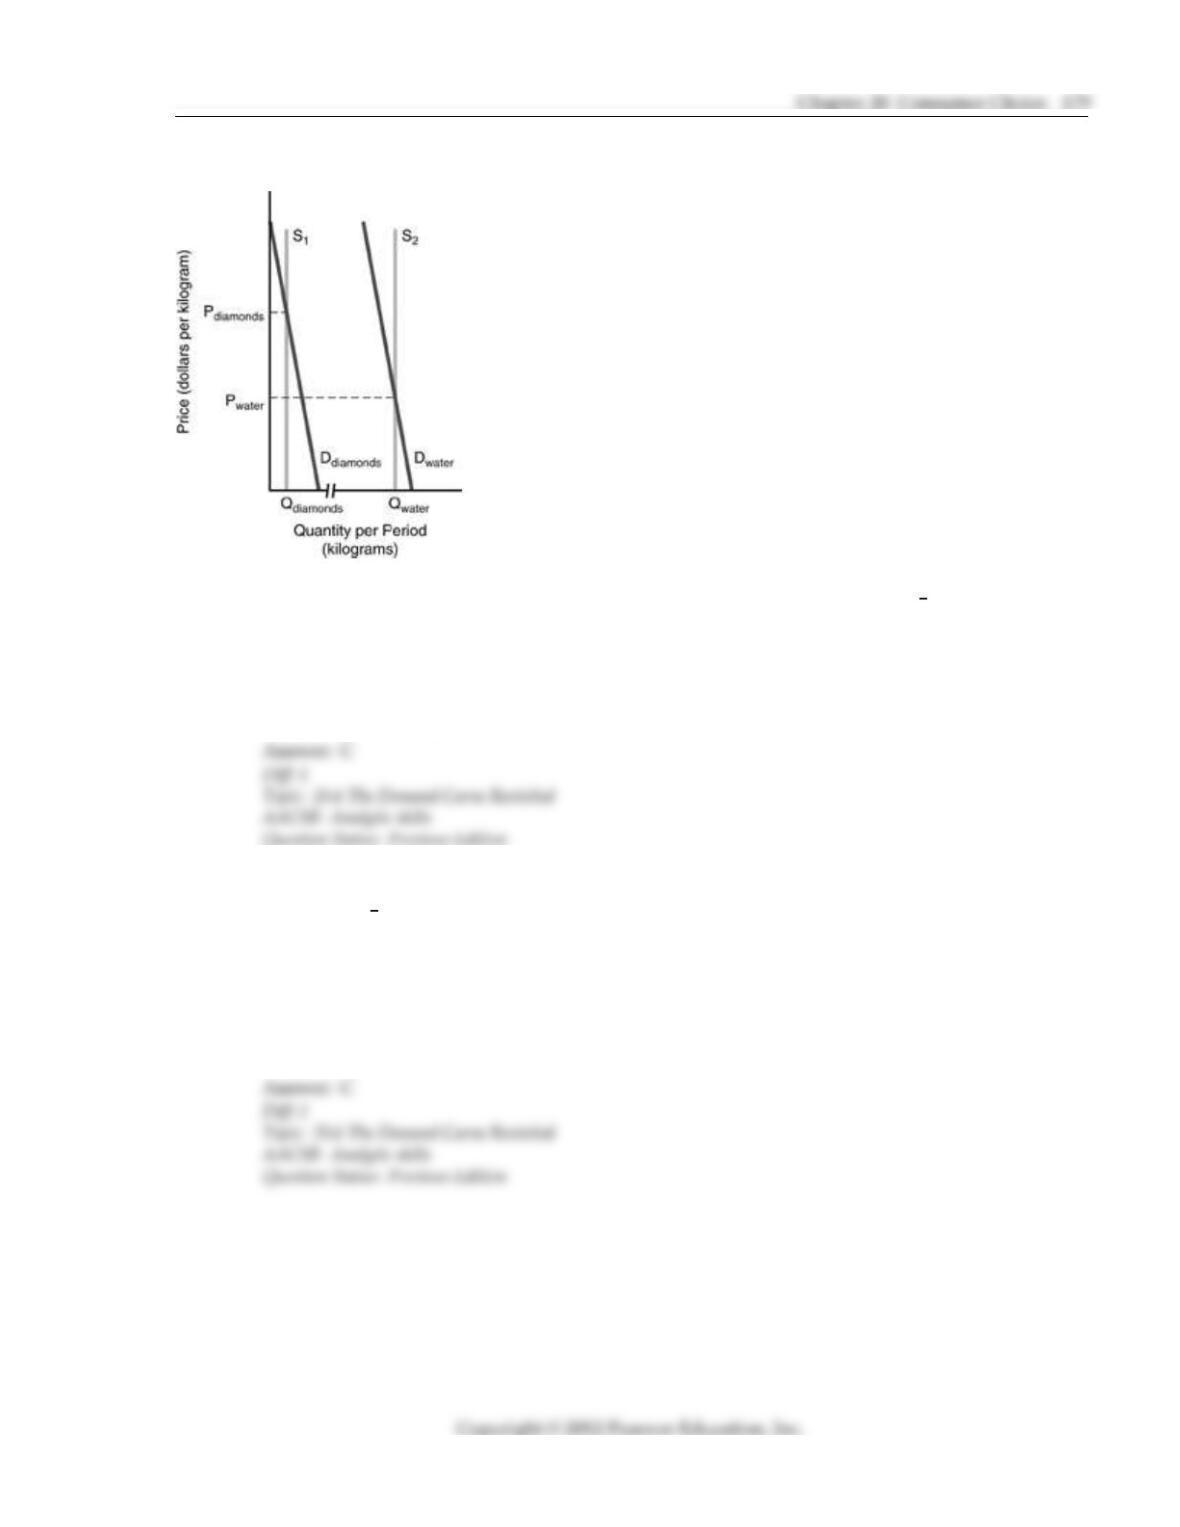
18) Refer to the above figure. All of the following are true concerning the diamond water paradox
EXCEPT
A) the demand for water exceeds the demand for diamonds.
B) the price of diamonds exceeds the price of water.
C) since the price of diamonds is high, demand is great.
D) marginal utility of diamond consumption is relatively high.
19) Which of the following statements is FALSE, with respect to what economist Adam Smith called
the diamond water paradox?
A) The total utility of water greatly exceeds the total utility derived from diamonds.
B) Total utility does not determine what people are willing to pay for a unit of a particular
commodity; marginal utility does.
C) The demand for water is much smaller than the demand for diamonds.
D) There are relatively few diamonds, so the marginal utility of the last diamond consumed is
relatively high.
20) Given the price of a good or service, what determines how much a person is willing to pay for
that good or service?
A) marginal utility B) total utility
C) the substitution effect D) average utility
21) The average demand curve slopes downward due to all of the following EXCEPT
A) the law of increasing relative costs.
B) the laws of diminishing marginal utility.
C) the real income effect.
D) the principle of substitution.
22) If you could pay for a product according to the marginal utility that you gain from additional
consumption, then as you consume more of a product the price you pay would
A) remain the same. B) increase.
C)
b
e deferred. D) decline.
23) Why does a price increase of a product result in a decrease in the quantity demanded of that
product, according to utility analysis?
24) Why is water much cheaper than diamonds even though water is essential to human lives while
diamonds are not?
25) Explain how utility analysis can be used to derive a downward sloping demand curve.
26) Use the law of diminishing marginal utility to explain the diamond water paradox.
20.7 Behavioral Economics and Consumer Choice Theory
1) Observations of violations of consumer optimum predicted by consumer choice theory could
provide support for
I. utility analysis
II. bounded rationality
III. behavioral economics
A) I only. B) III only. C)
b
oth I and II. D)
b
oth II and III.

2) The fact that the price of diamonds is higher than the price of water
A) cannot be explained by behavioral economics or consumer choice theory.
B) is an outcome of irrational behavior in consumer choice theory.
C) can be explained only by behavioral economics but not by consumer choice theory.
D) can be explained as the outcome of a consumer optimum in consumer choice theory.
3) Because the behavioral economics approach suggests many alternative behaviors that people
might exhibit if they fail to behave as if they are rational, this approach
A) often fails to provide clearly testable behavioral predictions.
B) reproduces the same predictions as utility analysis.
C) has an over reliance on the rationality assumption.
D) ignores the possibility of bounded rationality.
4) Observations of real world situations that appear to violate a consumer optimum could be
offered as evidence favoring
A) utility analysis.
B)
b
ounded rationality.
C) diminishing marginal utility.
D) zero marginal utility at a utility maximizing point.
5) One piece of evidence that possibly supports the bounded rationality assumption of behavioral
economics is that experiments appear to have shown that
A) people make different decisions in calm situations than in situations in which emotions
come into play.
B) people make the same decisions in calm situations than in situations in which emotions
come into play.
C) total utility is maximized when marginal utility is equal to zero.
D) total utility is declining when marginal utility is negative.
6) Behavioral economics suggests that people face human limitations that prevent them from
examining every possible choice available to them, with the implication that
A) the consumer optimum implied by utility theory is an inappropriate approach to deriving
demand curves.
B) the consumer optimum implied by utility theory is an appropriate approach to deriving
demand curves.
C) marginal utility is always equal to zero.
D) marginal utility is always negative.
20.8 Appendix F: On Being Indifferent
1) An indifference curve provides the set of consumption alternatives that
A) yield the same total amount of satisfaction.
B) maximize the utility of the consumer.
C) can be purchased for the same amount of money.
D) yield the same marginal utility for the last unit consumed of each good.
2) An indifference curve shows
A) the combinations of goods that a consumer does not like very much.
B) the combinations of goods that generate the same ratio of marginal utilities.
C) the set of consumption alternatives that yield the same amount of total utility.
D) the set of consumption alternatives that yield the same amount of marginal utility.
3) A curve where every combination of the two goods being considered yields the same level of
satisfaction is known as
A) a marginal utility curve. B) a total utility curve.
C) an indifference curve. D) a budget constraint.
4) Along an indifference curve
A) every combination of goods the consumer can purchase with their income is given.
B) the prices of goods will change.
C) utility increases as you move to the right.
D) every combination of the goods give the same level of satisfaction.
5) Along an indifference curve,
A) the marginal utility of all items is equal.
B) the total satisfaction is the same.
C) the prices of all goods are equal.
D) the marginal utility/price ratios of all items are equal.
6) A curve that shows a set of consumption alternatives that give the same level of satisfaction is
A) a substitution curve. B) a budget line.
C) an indifference curve. D) an income curve.
20.9 Appendix F: Properties of Indifference Curves
1) An indifference curve cannot be positively sloped because
A) the law of diminishing marginal utility would be violated.
B) the substitution effect would be violated.
C) a point to the right of another point will represent a lower quantity of both goods and a
reduction in utility.
D) a point to the right of another point will represent a higher quantity of both goods and an
increase in utility.
2) An indifference curve between one dozen eggs and several dozens of eggs would be
A)
b
owed in to the origin. B)
b
owed out from the origin.
C) a downward sloping straight line. D) a straight line from the origin.

3) If the marginal utility of each good is constant as consumption increases, the indifference curves
are
A) horizontal. B) vertical.
C) straight lines. D) positively sloped.
4) Which of the following is NOT true about indifference curves?
A) Indifference curves slope downward.
B) Indifference curves show equally preferred combinations of two goods.
C) Indifference curves are not straight lines because the marginal rate of substitution falls.
D) Indifference curves shift when prices change.
5) Indifference curves
A) are vertical. B) are horizontal.
C) slope upward. D) slope downward.
6) Assume that good X and good Y each have diminishing marginal utility for a consumer. In this
case,
A) an indifference curve linking the two goods will have a constant slope.
B) an indifference curve will be convex to the origin.
C) the demand curves for these goods will be positively sloped.
D) the demand curves for these goods will be horizontal.
7) Which of the following is FALSE about indifference curves?
A) They are downward sloping. B) They are convex to the origin.
C) They intersect. D) They can shift.
8) The indifference curve between eggs and dozens of eggs would be
A)
b
owed in to the origin.
B)
b
owed out from the origin.
C) a rectangular hyperbola.
D) a downward sloping straight line with a slope of 12.
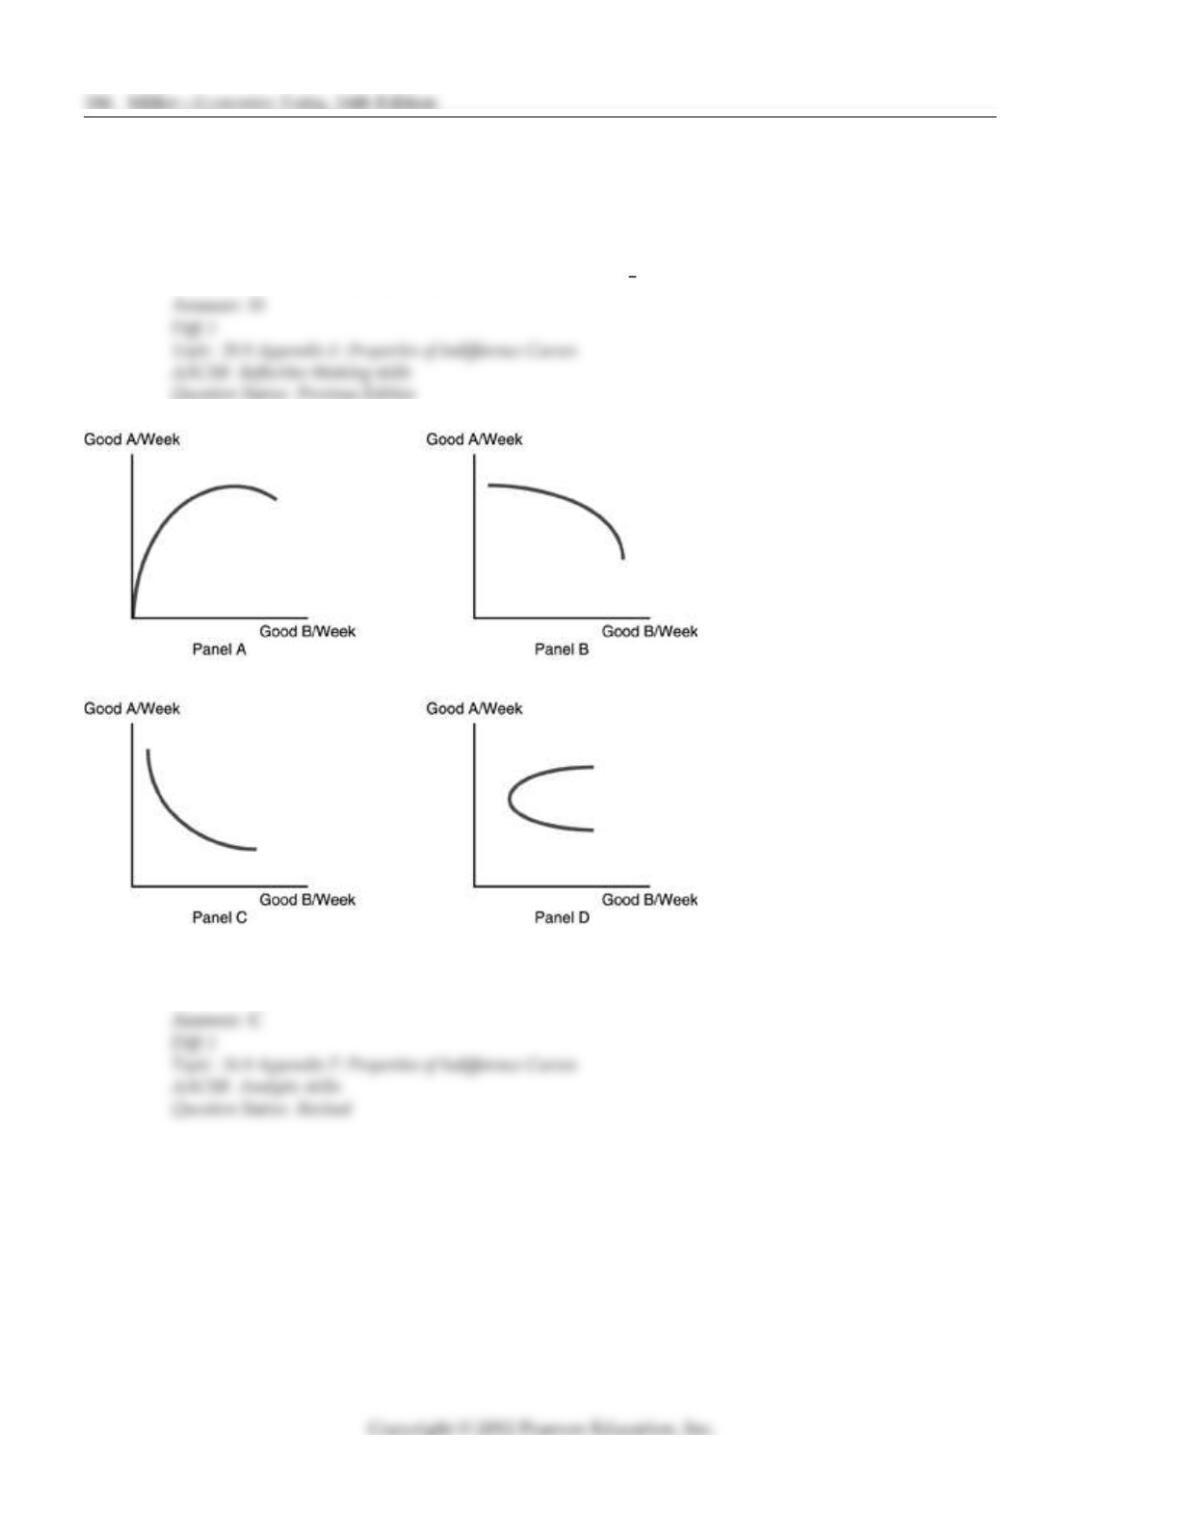
9) Refer to the above figures. Which panel best represents an indifference curve?
A) Panel A. B) Panel B. C) Panel C. D) Panel D.
10) An indifference curve
A) must slope downward towards the right.
B) is positively sloped.
C) is upsloping and is concave to the origin.
D) may be upsloping or downsloping, depending on whether the two products are
complements or substitutes.
11) An indifference curve
A) must be convex to the origin.
B) must be concave to the origin.
C) may be convex or concave to the origin.
D) depends on the prices of the products and the consumer s income.
12) One characteristic of indifference curves is that
A) they must intersect at the origin. B) they cannot intersect.
C) they have a positive slope. D) they are straight lines.
13) What are the key properties of indifference curves?
14) Why can t an indifference curve be a straight line?
188 Miller Economics Today, 16th Edition
20.10 Appendix F: The Marginal Rate of Substitution
1) The marginal rate of substitution is the
A) rate at which the consumer can exchange one good for the other.
B) change in the quantity of one good that just offsets a one unit change in the consumption
of another good such that the total satisfaction remains constant.
C) change in the quantity of one good that changes the utility received by one unit.
D) same thing as the marginal utility of a good.
2) The marginal rate of substitution is measured along
A) the demand curve. B) the total utility curve.
C) a given indifference curve. D) a given budget line.
3) The marginal rate of substitution is
A) equal to unit changes in the quantities of both goods so that utility rises.
B) the slope of the budget line at all points.
C) the change in the quantity of one good that just offsets a unit change in another good,
keeping utility constant.
D) found by adding additional units.
4) The marginal rate of substitution is
A) the change in the quantity of one good that just offsets a one unit change in the
consumption of another such that the total satisfaction remains constant.
B) the additional satisfaction from consuming an additional unit of a good or service.
C) positively related to the level of income.
D) the set of goods and services that are available to the consumer given his income.
5) The marginal rate of substitution is the
A) rate at which the consumer will give up one good for an additional unit of the other good,
such that total satisfaction is constant.
B) rate at which the consumer can trade one good for the other in the marketplace.
C) change in the quantity of one good that changes the utility received by one unit.
D) same thing as the marginal utility of a good.
6) Along a given indifference curve, a consumer reduces the quantity of one good in favor of more
units of the other. In this situation
A) the marginal rate of substitution falls.
B) the marginal utility of the first rises and the marginal utility of the second good falls.
C) Total utility rises.
D) Both A and B are correct.
Combination Good A Good B
A 17 4
B 13 5
C 10 6
D 8 7
7) Refer to the above table. The table gives the various combinations of Good A and Good B along
Jane s indifference curve. The marginal rate of substitution when Jane goes from combination A
to combination B is
A) 4:1. B) 3:1. C) 2:1. D) 0.
8) Refer to the above table. The table gives the various combinations of Good A and Good B along
Jane s indifference curve. The marginal rate of substitution when Jane goes from combination B
to combination C is
A) 4:1. B) 3:1. C) 2:1. D) 0.
9) Refer to the above table. The table gives the various combinations of Good A and Good B along
Jane s indifference curve. The marginal rate of substitution when Jane goes from combination C
to combination D is
A) 4:1. B) 3:1. C) 2:1. D) 0.
10) Along an indifference curve, as the consumer reduces the quantity of Good A in favor of more
Good B the marginal rate of substitution of Good A for Good B will
A) fall. B) rise.
C) stay the same. D) fall and eventually turn negative.
11) The change in the consumption of one good that just offsets a one unit change in the
consumption of another good is the
A) marginal utility. B) marginal rate of consumption.
C) marginal rate of substitution. D) marginal rate of satisfaction.
12) The marginal rate of substitution measures
A) the impact of product substitution.
B) the changes in marginal utility along the indifference curve.
C) the consumer s willingness to substitute one product for another so that total utility will
remain unchanged.
D) the consumer s willingness to substitute one product for another so that marginal utility
will remain unchanged.
13) Mathematically the marginal rate of substitution is
A) always a negative number.
B) always a positive number.
C) is equal to 1.
D) sometimes a positive and sometimes a negative number.
14) What is the marginal rate of substitution between two goods and how is it related to the
indifference curve?
20.11 Appendix F: The Indifference Map
1) In a map showing three indifference curves a consumer is most well off on
A) the curve which is closest to the origin of the coordinate axes.
B) the curve which is most farther away from the coordinate axes.
C) The curve that is in the middle.
D) none of the above
2) An indifference map shows
A) that money income is constant, but product prices may change.
B) that utility is at a maximum at the origin.
C) that curves closer to the origin represent higher levels of utility.
D) that curves further from the origin represent higher levels of utility.
3) If an individual s total utility from consuming two goods increases, then there must be
A) a downward rotation of the individual s indifference curve.
B) an inward rotation of the individual s indifference curve.
C) an outward shift of the individual s indifference curve.
D) an inward shift of the individual s indifference curve.
4) If an individual s total utility from consuming two goods decreases, then there must be
A) a downward rotation of the individual s indifference curve.
B) an inward rotation of the individual s indifference curve.
C) an outward shift of the individual s indifference curve.
D) an inward shift of the individual s indifference curve.
5) A set of indifference curves on a graph is called
A) a difference map. B) an indifference map.
C) a budget map. D) a cluster.
6) Basket of goods A is on an indifference curve that lies further from the origin than basket B.
From this we know that
A) the prices of the goods in A are more than the prices of the goods in B.
B) the satisfaction from consuming A is more than the satisfaction from consuming B.
C) the marginal utility from consuming A is more than the marginal utility from
consuming B.
D) all other consumers would also rank B above A.
7) Basket of goods A is on an indifference curve that lies closer to the origin than basket B. From
this we know that
A) the prices of the goods in A are less than the prices of the goods in B.
B) the satisfaction from consuming A is more than the satisfaction from consuming B.
C) the marginal utility from consuming A is less than the marginal utility from
consuming B.
D) the satisfaction from consuming A is less than the satisfaction from consuming B.
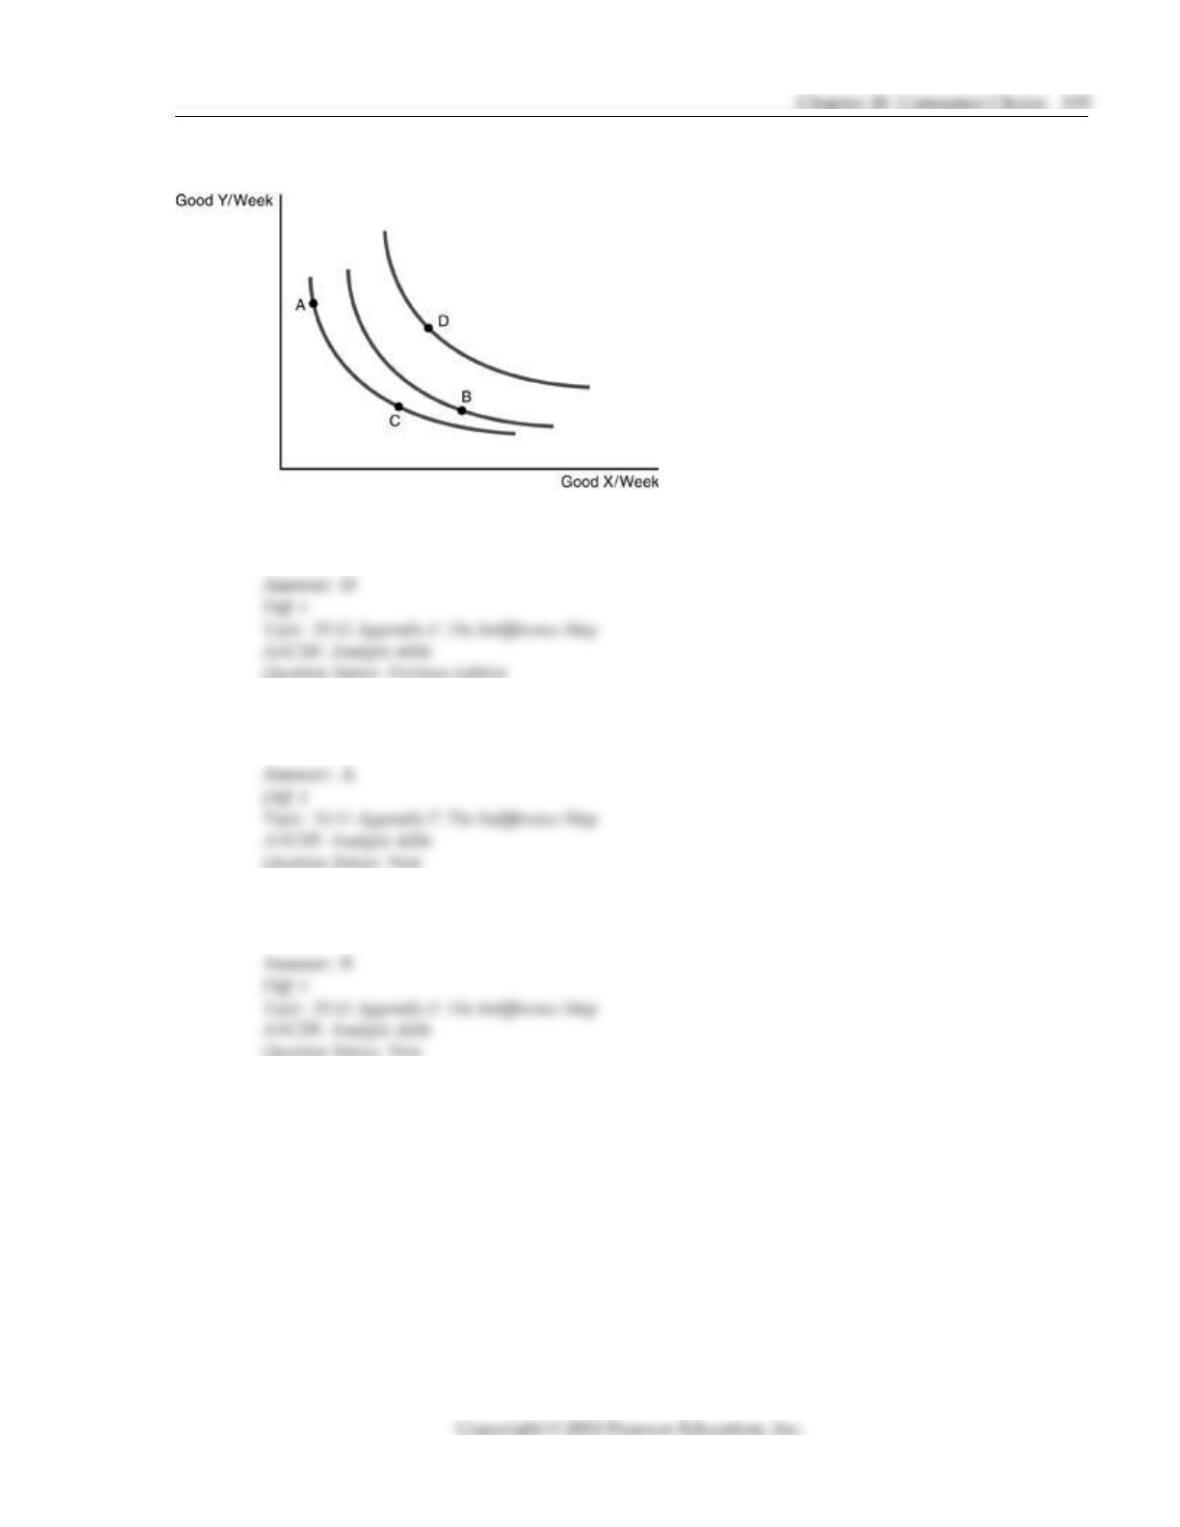
8) Refer to the above figure. Which point represents the highest level of utility?
A) Point A B) Point B C) Point C D) Point D
9) Refer to the above figure. Which point(s) represents the lowest level of utility?
A) Points A & C B) Point B C) Point C only D) Point D
10) Refer to the above figure. Which point represents the second highest level of utility?
A) Point A B) Point B C) Point C D) Point D