Chapter 2/Thinking Like an Economist ❖ 81
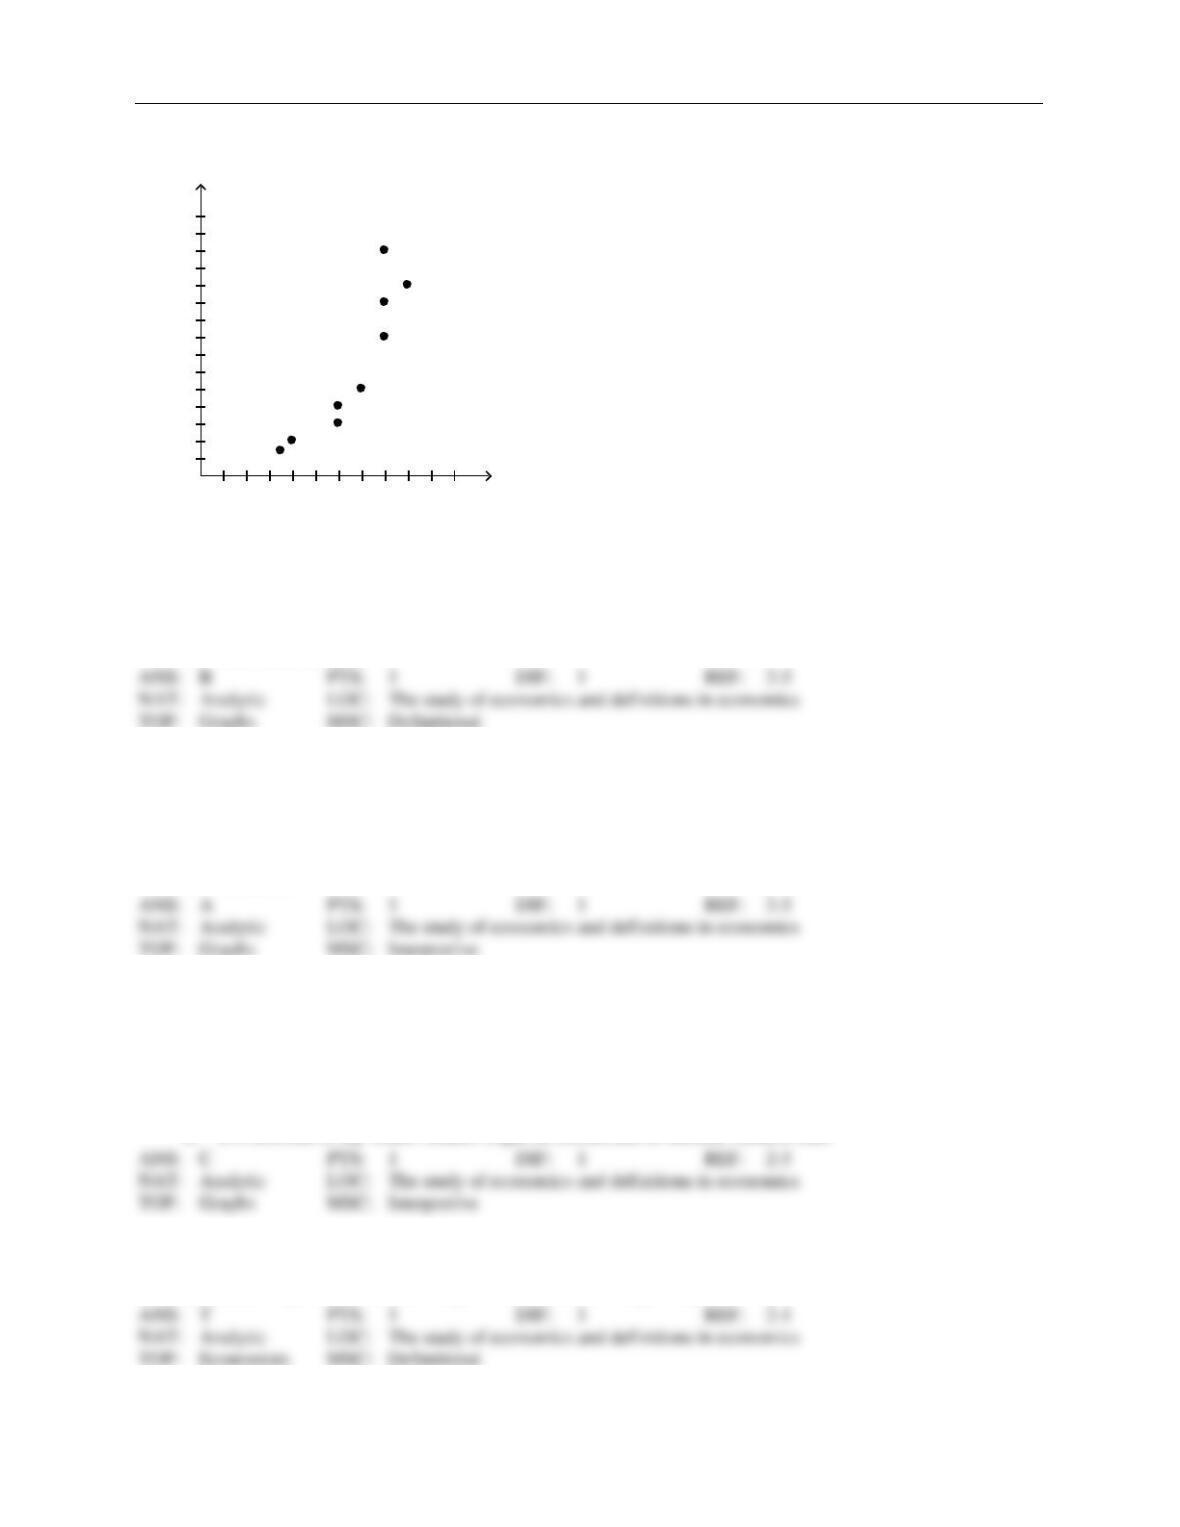
Figure 2-17
Relationship Between Years of Education and Annual Income
income
education
2 4 6 8 10 12 14 16 18 20 years of
20000
40000
60000
80000
100000
120000
140000
annual
66. Refer to Figure 2-17. The graph above is a
a.
bar graph
b.
scatterplot
c.
pie chart
d.
time series analysis
67. Refer to Figure 2-17. According to the graph, the correlation between years of education and annual income
is
a.
positive
b.
negative
c.
inverse
d.
normative
68. Refer to Figure 2-17. Senator Smith observes the graph and concludes that people who earn higher incomes
attend school for more years. Senator Jones observes the graph and concludes that people who attend school
for more years earn higher incomes. Who is correct?
a.
Senator Smith is correct.
b.
Senator Jones is correct.
c.
It is difficult to say which senator might be correct due to the reverse causality problem.
d.
It is difficult to say which senator might be correct due to omitted variable bias.
TRUE/FALSE
1. Economists try to address their subject with a scientist’s objectivity.
82 ❖ Chapter 2/Thinking Like an Economist
2. Economists devise theories, collect data, and then analyze these data in an attempt to verify or refute their the-
ories.
3. The scientific method is the dispassionate development and testing of theories about how the world works.
4. The scientific method can be applied to the study of economics.
5. While the scientific method is applicable to studying natural sciences, it is not applicable to studying a na-
tion’s economy.
6. For economists, conducting experiments is often difficult and sometimes impossible.
7. Economists usually have to make do with whatever data the world happens to give them.
8. It is difficult for economists to make observations and develop theories, but it is easy for economists to run
experiments to generate data to test their theories.
9. Since economists cannot use natural experiments offered by history, they must use carefully constructed la-
boratory experiments instead.
10. Historical episodes are not valuable to economists.
11. Historical episodes allow economists to illustrate and evaluate current economic theories.
Chapter 2/Thinking Like an Economist ❖ 83
12. Good assumptions simplify a problem without substantially affecting the answer.
13. Assumptions can simplify the complex world and make it easier to understand.
14. Economists often find it worthwhile to make assumptions that do not necessarily describe the real world.
15. Economists use one standard set of assumptions to answer all economic questions.
16. Economic models are most often composed of diagrams and equations.
17. Economic models omit many details to allow us to see what is truly important.
18. Economic models can help us understand reality only when they include all details of the economy.
19. An economic model can accurately explain how the economy is organized because it is designed to include, to
the extent possible, all features of the real world.
20. All scientific models, including economic models, simplify reality in order to improve our understanding of it.
21. The circular-flow diagram explains, in general terms, how the economy is organized and how participants in
the economy interact with one another.
84 ❖ Chapter 2/Thinking Like an Economist
22. A circular-flow diagram is a visual model of the economy.
23. The circular flow model is not used anymore because it fails to perfectly replicate real world situations.
24. In the circular-flow diagram, households and firms are the decision makers.
25. In the circular-flow diagram, firms produce goods and services using the factors of production.
26. In the circular-flow diagram, factors of production are the goods and services produced by firms.
27. In the circular-flow diagram, factors of production include land, labor, and capital.
28. In the circular-flow diagram, firms own the factors of production and use them to produce goods and services.
29. In the circular-flow diagram, firms consume all the goods and services that they produce.
30. In the circular-flow diagram, the two types of markets in which households and firms interact are the markets
for goods and services and the markets for factors of production.
31. In the markets for goods and services in the circular-flow diagram, households are buyers and firms are sellers.
Chapter 2/Thinking Like an Economist ❖ 85
32. In the markets for the factors of production in the circular-flow diagram, households are buyers and firms are
sellers.
33. In the circular-flow diagram, one loop represents the flow of goods, services, and factors of production, and
the other loop represents the corresponding flow of dollars.
34. In the circular-flow diagram, one loop represents the flow of goods and services, and the other loop represents
the flow of factors of production.
35. In the circular-flow diagram, payments for labor, land, and capital flow from firms to households through the
markets for the factors of production.
36. The production possibilities frontier is a graph that shows the various combinations of outputs that the econo-
my can possibly produce given the available factors of production and the available production technology.
Figure 2-14
houses
A
DB
C
dishwashers
15 30 45 60 75 dog-
5
10
15
20
25
30
35
40
45
37. Refer to Figure 2-14. If this economy uses all its resources in the dishwasher industry, it produces 35 dish-
washers and no doghouses.
86 ❖ Chapter 2/Thinking Like an Economist
38. Refer to Figure 2-14. It is possible for this economy to produce 75 doghouses.
39. Refer to Figure 2-14. It is possible for this economy to produce 30 doghouses and 20 dishwashers.
40. Refer to Figure 2-14. It is possible for this economy to produce 45 doghouses and 30 dishwashers.
41. Refer to Figure 2-14. When this economy produces 30 doghouses and 25 dishwashers there is full employ-
ment.
42. Refer to Figure 2-14. This economy fully employs its resources when it produces 35 dishwashers and zero
doghouses.
43. Refer to Figure 2-14. Given the technology available for manufacturing doghouses and dishwashers, this
economy does not have enough of the factors of production to support the level of output represented by point
C.
44. Refer to Figure 2-14. Points A, B, and D represent feasible outcomes for this economy.
45. Refer to Figure 2-14. Points B and C represent infeasible outcomes for this economy.
46. Refer to Figure 2-14. Points A, B, and D represent efficient outcomes for this economy.
47. Refer to Figure 2-14. Point B represents an inefficient outcome for this economy.
Chapter 2/Thinking Like an Economist ❖ 87
48. Refer to Figure 2-14. Unemployment could cause this economy to produce at point B.
49. Refer to Figure 2-14. The opportunity cost of moving from point A to point D is 10 dishwashers.
50. Refer to Figure 2-14. The opportunity cost of moving from point B to point D is 15 doghouses.
51. Refer to Figure 2-14. The opportunity cost of moving from point B to point A is zero.
52. Refer to Figure 2-14. The opportunity cost of an additional doghouse increases as more doghouses are pro-
duced.
53. With the resources it has, an economy can produce at any point on or outside the production possibilities fron-
tier, but it cannot produce at points inside the frontier.
54. Points inside the production possibilities frontier represent feasible levels of production.
55. Points inside the production possibilities frontier represent inefficient levels of production.
56. Points on the production possibilities frontier represent efficient levels of production.
57. Points outside the production possibilities frontier represent infeasible levels of production.
88 ❖ Chapter 2/Thinking Like an Economist
58. If a major union goes on strike, then the country would be operating inside its production possibilities frontier.
59. An outcome is said to be efficient if an economy is getting all it can from the scarce resources it has available.
60. An outcome is said to be efficient if an economy is conserving the largest possible quantity of its scarce re-
sources while still meeting the basic needs of society.
61. A production point is said to be efficient if there is no way for the economy to produce more of one good
without producing less of another.
62. If an economy can produce more of one good without giving up any of another good, then the economy’s cur-
rent production point is inefficient.
63. Unemployment causes production levels to be inefficient.
64. The opportunity cost of something is what you give up to get it.
65. The production possibilities frontier shows the opportunity cost of one good as measured in terms of the other
good.
66. When a production possibilities frontier is bowed outward, the opportunity cost of one good in terms of the
other is constant.
67. When a production possibilities frontier is bowed outward, the opportunity cost of one good in terms of the
other depends on how much of each good is being produced.
Chapter 2/Thinking Like an Economist ❖ 89
68. When a production possibilities frontier is bowed outward, the opportunity cost of the first good in terms of
the second good increases as more of the second good is produced.
69. When a production possibilities frontier is bowed outward, the opportunity cost of the second good in terms of
the first good increases as more of the second good is produced.
70. A production possibilities frontier has a bowed shape if the opportunity cost is constant at all levels of output.
71. Economists believe that production possibilities frontiers rarely have a bowed shape.
72. A production possibilities frontier will be bowed outward if some of the economy’s resources are better suited
to producing one good than another.
73. The trade-off between the production of one good and the production of another good can change over time
because of technological advances.
74. A technological advance in the production of the first good increases the opportunity cost of the first good in
terms of the second good.
75. While the production possibilities frontier is a useful model, it cannot be used to illustrate economic growth.
76. Economic growth causes a production possibilities frontier to shift outward.
90 ❖ Chapter 2/Thinking Like an Economist
77. If new government regulations designed to protect wetlands remove very productive farmland from produc-
tion, then the production possibilities frontier will shift inward.
78. Production possibilities frontiers can be used to illustrate scarcity, trade-offs, opportunity cost, efficiency, un-
employment, technological advances, and economic growth.
79. Microeconomics is the study of how households and firms make decisions and how they interact in specific
markets.
80. Macroeconomics is the study of economy-wide phenomena.
81. The effects of borrowing by the federal government would be studied by a microeconomist rather than a mac-
roeconomist.
82. The effects of foreign competition on the U.S. textile industry would be studied by a microeconomist rather
than a macroeconomist.
83. A macroeconomist, rather than a microeconomist, would study the effects on a market from two firms merg-
ing.
84. Microeconomics and macroeconomics are closely intertwined.
85. When economists are trying to explain the world, they are scientists, and when they are trying to help improve
the world, they are policy advisers.
Chapter 2/Thinking Like an Economist ❖ 91
86. Economists acting as scientists make positive statements, while economists acting as policy advisers make
normative statements.
87. Normative statements describe how the world is, while positive statements prescribe how the world should be.
88. Positive statements are descriptive, while normative statements are prescriptive.
89. Positive statements can be evaluated using data alone, but normative statements cannot.
90. Evaluating normative statements involves values as well as facts.
91. “Society would be better off if the welfare system were abolished” is a normative statement, not a
positive statement.
92. “Other things equal, an increase in supply causes a decrease in price” is a normative statement, not
a positive statement.
93. “Minimum wage laws result in unemployment” is a normative statement, while “the minimum
wage should be higher” is a positive statement.
94. “The US should not restrict employers from outsourcing work to foreign countries” is a normative
statement.
95. Trade-offs are involved in most policy decisions.
96. Since 1946, the president of the United States has received guidance from the Council of Economic Advisers.
92 ❖ Chapter 2/Thinking Like an Economist
97. The Council of Economic Advisers consists of thirty members and a staff of several dozen economists.
98. The duties of the Council of Economic Advisers are to advise the president of the United States and to deter-
mine U.S. monetary policy.
99. The Council of Economic Advisers’ Economic Report of the President discusses recent developments in the
economy and presents the council’s analysis of current policy issues.
100. The President counts among his economic advisors the Congressional Budget Office.
101. Economists at the U.S. Department of the Treasury help design U.S. coins and paper money.
102. Economists at the U.S. Department of Justice help enforce the nation’s antitrust laws.
103. Economists work both inside and outside the administrative branch of the U.S. government.
104. The Congressional Budget Office, which is staffed by economists, provides Congress with independent evalu-
ations of policy proposals.
105. There is only one explanation for why economists give conflicting advice on policy issues, and it is that they
have different values about what policy should try to accomplish.
106. Economists may disagree about the validity of alternative positive theories about how the world works.
Chapter 2/Thinking Like an Economist ❖ 93
107. Different values are not a reason for disagreement among economists.
108. In surveys of professional economists, fourteen propositions were endorsed by an overwhelming majority of
respondents.
109. Because almost all economists oppose policies that restrict trade among nations, policymakers do not restrict
imports of certain goods.
110. According to John Maynard Keynes, an economist must possess a rare combination of skills including being a
mathematician, historian, statesman, and philosopher.
111. In economics, graphs serve two purposes: they offer a way to visually express ideas, and they provide a way of
finding and interpreting patterns when analyzing economic data.
112. Examples of graphs of a single variable include pie charts, bar graphs, and time-series graphs.
113. A pie chart is a way to display information regarding two variables.
114. In the ordered pair (10,30), 10 is the y-coordinate and 30 is the z-coordinate.
115. In the ordered pair (10,30), 10 is the horizontal location of the point and 30 is the vertical location of the point.
116. Two variables that have a positive correlation move in the same direction.
94 ❖ Chapter 2/Thinking Like an Economist
117. Two variables that have a negative correlation move in opposite directions.
118. When two variables move in opposite directions, the curve relating them is upward sloping, and we say the
variables are positively related.
119. When two variables move in the same direction, the curve relating them is downward sloping, and we say the
variables are negatively related.
120. When a variable that is named on an axis of a graph changes, the curve shifts.
121. When a variable that is not named on either axis of a graph changes, we read the change as a movement along
the curve.
122. The concept of slope can be used to answer questions about how much one variable responds to changes in
another variable.
123. The slope of a line is equal to the change in the x-variable divided by the change in the y-variable.
124. The slope of an upward-sloping line is positive, and the slope of a downward-sloping line is negative.
125. The slope of a horizontal line is infinite, and the slope of a vertical line is zero.
126. The slope of a line is the ratio of the vertical distance covered to the horizontal distance covered along the line.
Chapter 2/Thinking Like an Economist ❖ 95
127. If a line passes through the points (20,5) and (10,10), then the slope of the line is 1/2.
128. If a line passes through the points (20,5) and (10,10), then the slope of the line is –2.
129. Changes in one variable on a graph might be caused by the other variable on the graph or by a third omitted
variable.
130. Deciding that A causes B when in fact B causes A is a mistake called omitted variable bias.
SHORT ANSWER
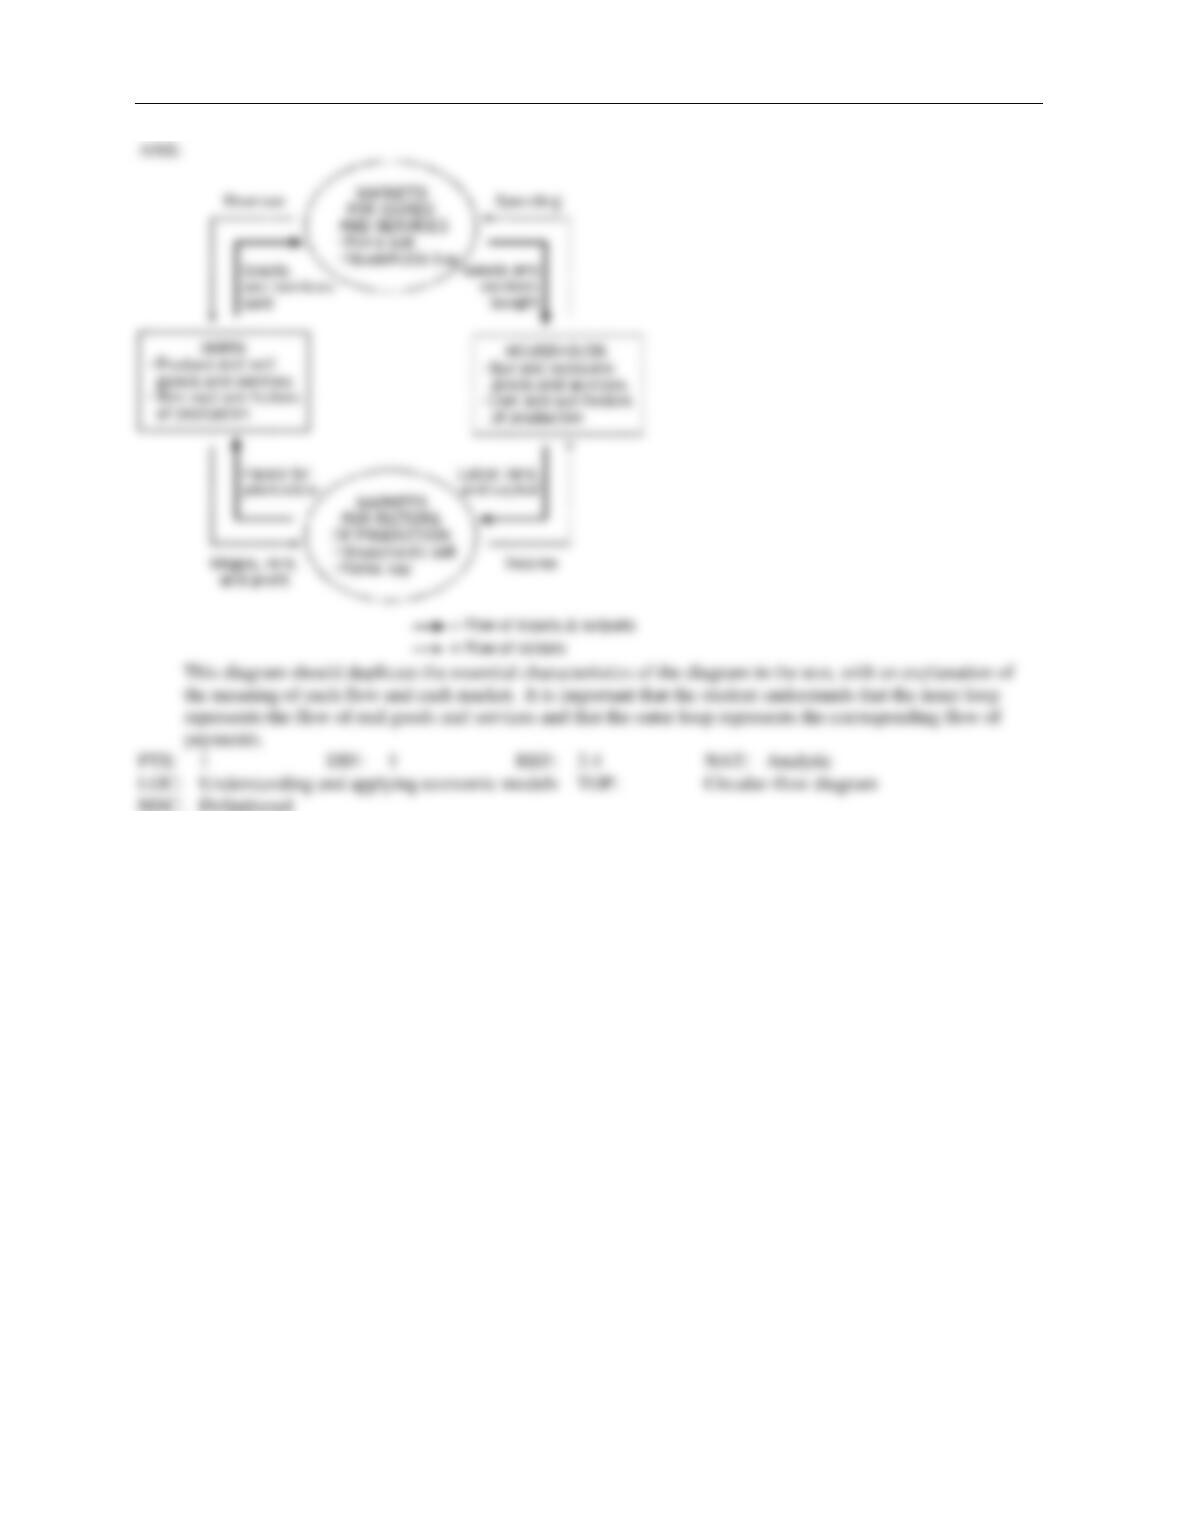
1. Using the outline below, draw a circular-flow diagram representing the interactions between households and
firms in a simple economy. Explain briefly the various parts of the diagram.
96 ❖ Chapter 2/Thinking Like an Economist
2. The prairie dog has always been considered a problem for American cattle ranchers. They dig holes that cattle
and horses can step in, and they eat grass necessary for cattle. Recently, ranchers have discovered that there is
a demand for prairie dogs as pets. In some areas, prairie dogs can sell for as high as $150 each. Cattlemen are
now fencing off prairie dog towns on their land so these towns will not be disturbed by their cattle.
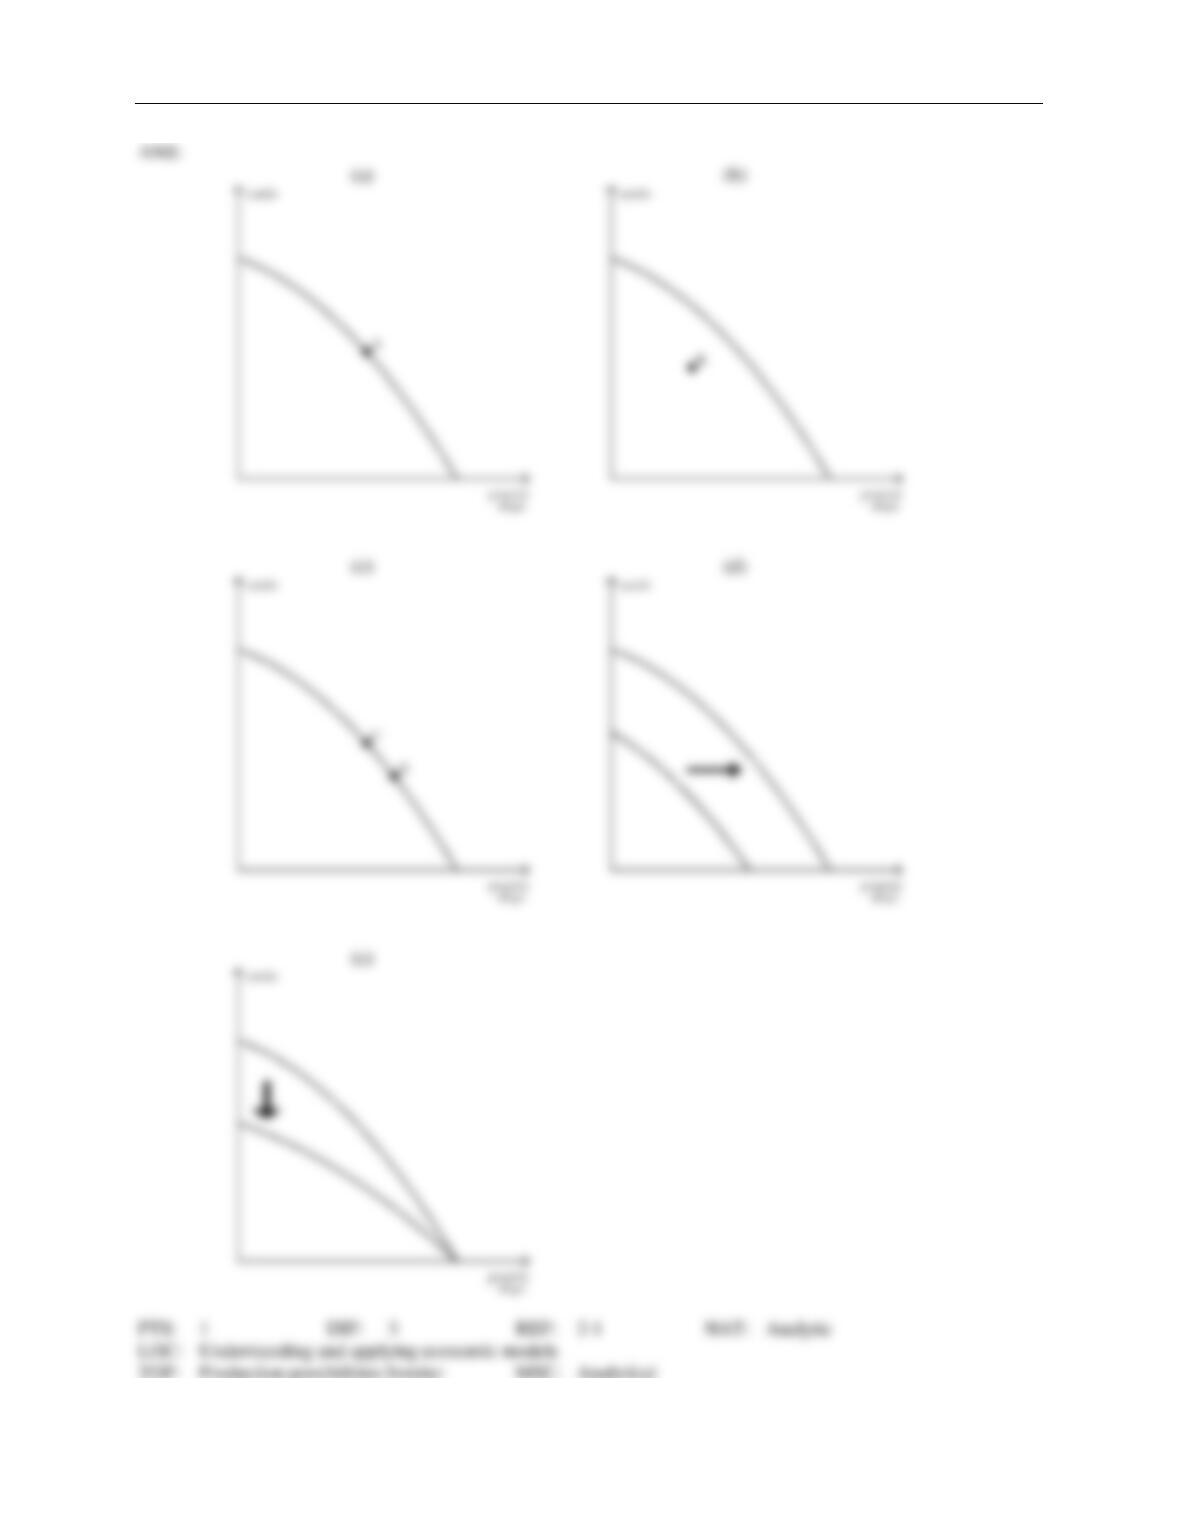
Draw a rancher’s production possibilities frontier showing increasing opportunity cost of cattle production in
terms of prairie dog production. Using a separate graph for each situation, show what would happen to the
initial production possibilities frontier in each of the following situations:
a.
The outcome is efficient, with ranchers choosing to produce equal numbers of cattle and prairie
dogs.
b.
As a protest against the government introducing the gray wolf back into the wild in their state,
ranchers decide to withhold 25 percent of the available grassland for grazing.
c.
The price of prairie dogs increases to $200 each, so ranchers decide to allot additional land for
prairie dogs.
d.
The government grants new leases to ranchers, giving them 10,000 new acres of grassland each
for grazing.
e.
A drought destroys most of the available grass for grazing of cattle, but not for prairie dogs since
they also eat plant roots.
Chapter 2/Thinking Like an Economist ❖ 97
98 ❖ Chapter 2/Thinking Like an Economist
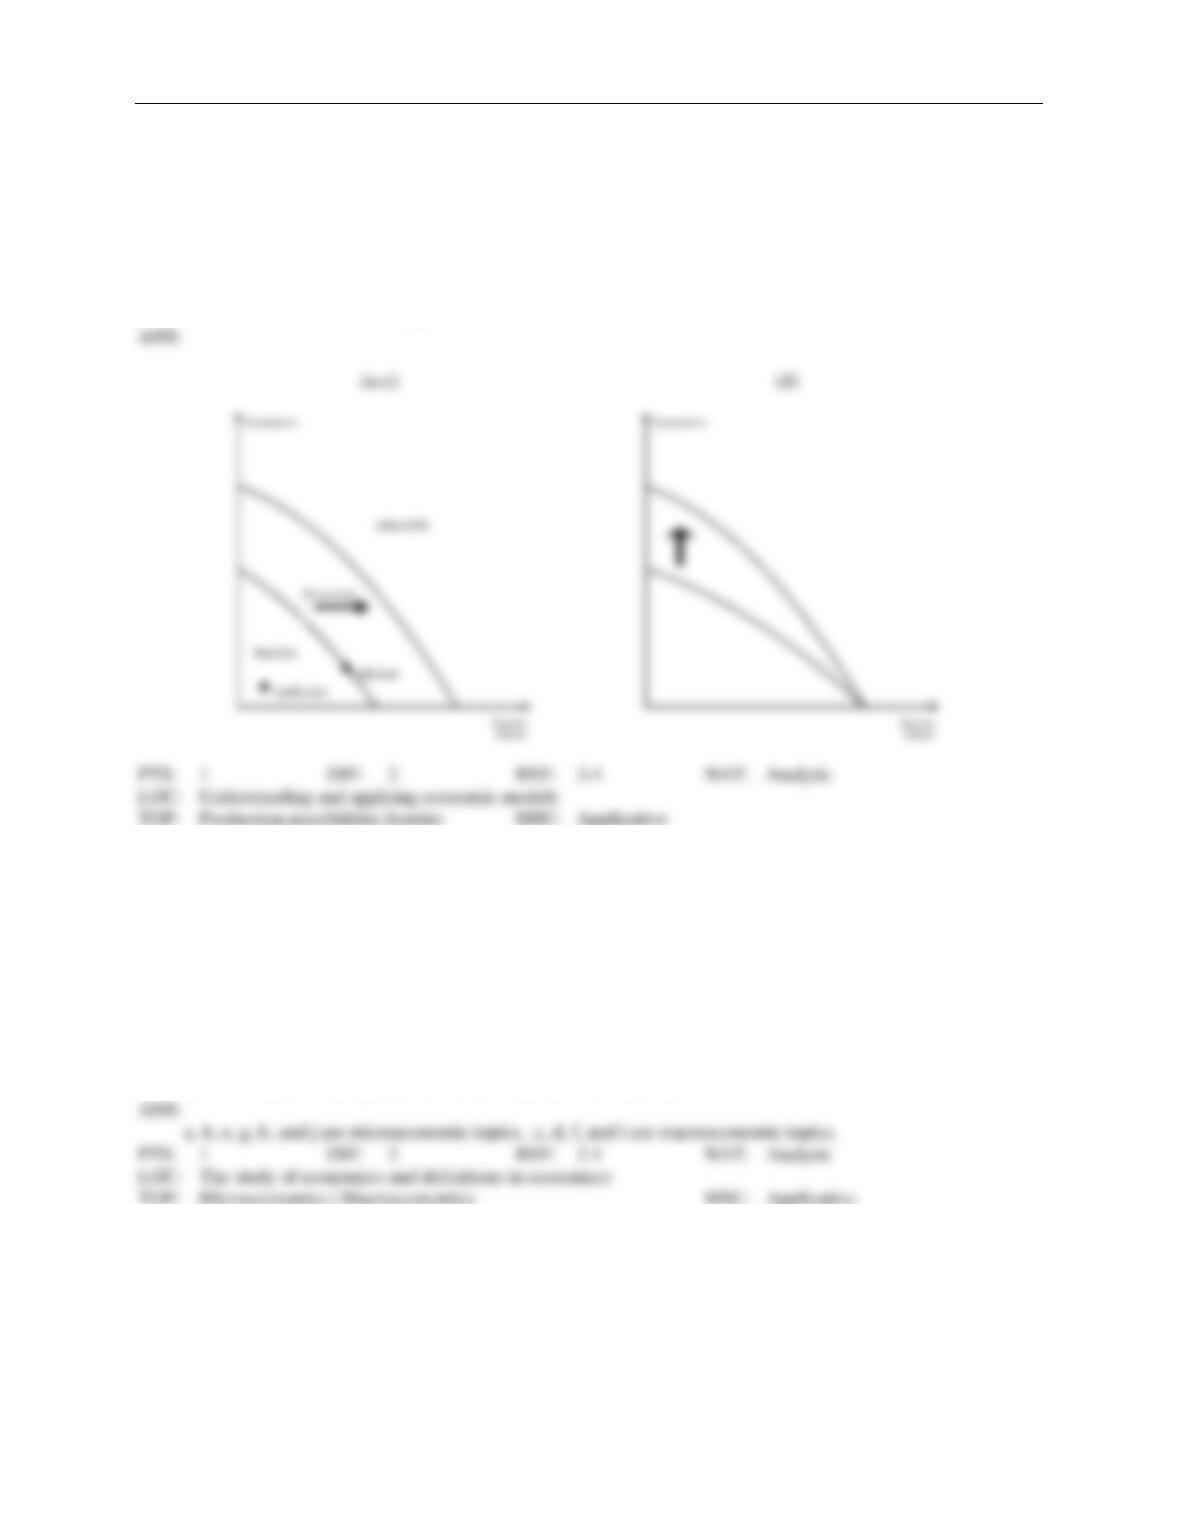
3. Draw a production possibilities frontier showing increasing opportunity cost of hammers in terms of horse-
shoes.
a.
On the graph, identify the area of feasible outcomes and the area of infeasible outcomes.
b.
On the graph, label a point that is efficient and a point that is inefficient.
c.
On the graph, illustrate the effect of the discovery of a new vein of iron ore, a resource needed to
make both horseshoes and hammers, on this economy.
d.
On a second graph, illustrate the effect of a new computerized assembly line in the production of
hammers on this economy.
4. Identify each of the following topics as being part of microeconomics or macroeconomics:
a.
the impact of a change in consumer income on the purchase of luxury automobiles
b.
the effect of a change in the price of Coke on the purchase of Pepsi
c.
the impact of a war in the Middle East on the rate of inflation in the United States
d.
factors influencing the rate of economic growth
e.
factors influencing the demand for tractors
f.
the impact of tax policy on national saving
g.
the effect of pollution taxes on the U.S. copper industry
h.
the degree of competition in the cable television industry
i.
the effect of a balanced-budget amendment on economic stability
j.
the impact of deregulation on the savings and loan industry
Chapter 2/Thinking Like an Economist ❖ 99
5. Which of the following statements are positive and which are normative?
a.
The minimum wage creates unemployment among young and unskilled workers.
b.
The minimum wage ought to be abolished.
c.
If the price of a product in a market decreases, then, other things equal, quantity demanded will increase.
d.
A little bit of inflation is worse for society than a little bit of unemployment.
e.
There is a tradeoff between inflation and unemployment in the short run.
f.
If consumer income increases, then, other things equal, the demand for automobiles will increase.
g.
The U.S. income distribution is not fair.
h.
U.S. workers deserve more liberal unemployment benefits.
i.
If interest rates increase, then investment will decrease.
j.
If welfare benefits were reduced, then the country would be better off.
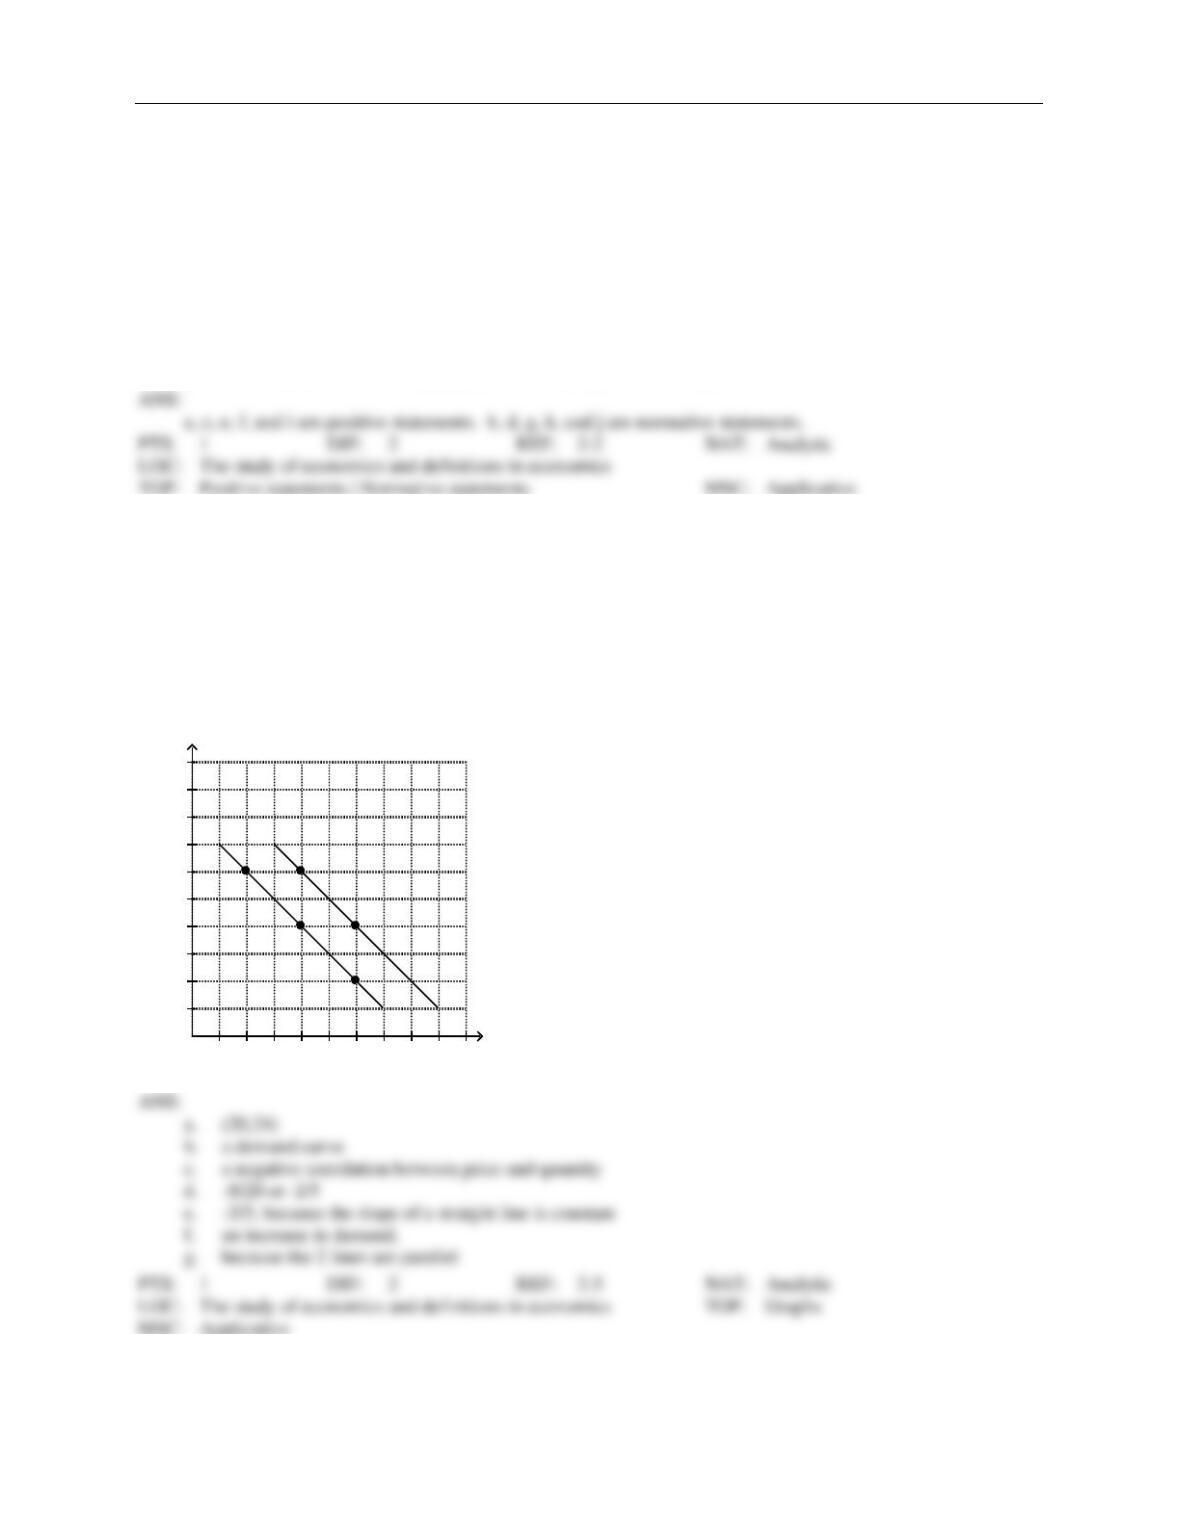
6. Use the following graph to answer the following questions.
a.
How would point J be represented as an ordered pair?
b.
What type of curve is this?
c.
Does this curve show a positive or negative correlation between price and quantity?
d.
Compute the slope of D1 between points J and L.
e.
What is the slope of D1 between points L and N? Why would you not have to calculate this
answer?
f.
What is it called if we move from D1 to D2?
g.
How do you know that the slope of D2 is the same as the slope of D1?
D1 D2
J K
L M
N
10 20 30 40 50 60 70 80 quantity
4
8
12
16
20
24
28
32
36
40 price
a.
(20,24)
b.
a demand curve
c.
a negative correlation between price and quantity
d.
-8/20 or -2/5
e.
-2/5; because the slope of a straight line is constant
f.
an increase in demand.