Chapter 2/Thinking Like an Economist ❖ 61
59. Congress relies on economists at the Congressional Budget Office to
a.
enforce the nation’s antitrust laws.
b.
set the nation’s monetary policy.
c.
provide evidence that incumbent members of Congress are performing well in their jobs.
d.
provide independent evaluations of policy proposals.
60. The President receives economic policy advice from economists at each of the following except
a.
the Council of Economic Advisors.
b.
the Department of the Treasury.
c.
the Congressional Budget office.
d.
the Department of Labor.
61. The Federal Reserve
a.
designs tax policy.
b.
enforces the nation’s antitrust laws.
c.
sets the nation’s monetary policy.
d.
analyzes data on workers.
62. Economists hold many positions advising the president and Congress including
a.
being a member of the Council of Economic Advisers.
b.
helping to enforce antitrust laws at the Department of Justice.
c.
conducting research at the Congressional Budget Office.
d.
All of these are possible positions that economists hold.
63. John Maynard Keynes believed the ideas of economists to be
a.
generally incorrect.
b.
powerful.
c.
academic and without practical application.
d.
rantings of madmen.
64. One difference between a hypothetical benevolent king implementing the best policy and the president imple-
menting the best policy in the real world is the president has to be concerned about
a.
any misunderstandings in communicating the policy to the public.
b.
whether the policy will affect his standing among different groups in the electorate.
c.
what amendments will be suggested by members of Congress.
d.
All of the above are correct.
62 ❖ Chapter 2/Thinking Like an Economist
65. Policymaking in a representative democracy
a.
is straightforward and does not involve any disagreement.
b.
benefits from the input of economists, even if their advice is not always followed.
c.
is conducted without the input of economists.
d.
is always based exclusively on the results of economic analysis.
66. John Maynard Keynes observed that during rare times of deep financial and economic crisis, when the “invisi-
ble hand” has temporarily ceased to function,
a.
there is a more urgent need for government to play an active role in restoring markets to their
healthy function.
b.
government should avoid intervening in the market and wait patiently for proper market function to
return.
c.
economists need to re-evaluate all of their basic principles.
d.
the economy can rely on entrepreneurs to take creative actions to end the crisis.
67. Larry Summers, a chief economic adviser to President Obama, stated that as a result of using Keynesian poli-
cies in 2008 and 2009,
a.
US government policy moved in a strongly activist direction.
b.
the US has shifted from worrying about an economic depression to thinking about what kind of
expansion the country will have.
c.
the US has shifted from rescuing the economy to economic recovery.
d.
All of the above are correct.
68. Economist Joseph Schumpeter coined the phrase “creative destruction” to describe the process by which
a.
the government destroys the failing markets that caused an economic crisis.
b.
innovation and enterpreneurial initiative have great power to drive economic growth.
c.
economists destroy long-held beliefs about how markets function.
d.
free markets need government intervention to create economic growth.
TOP: Economics of President Obama | Economists MSC: Interpretive
WHY ECONOMISTS DISAGREE
1. “If all economists were laid end to end, they would not reach a conclusion.” Who made this
whimsical observation?
a.
Harry Truman
b.
George Bernard Shaw
c.
John Maynard Keynes
d.
Ronald Reagan
Chapter 2/Thinking Like an Economist ❖ 63
2. President Ronald Reagan once joked that a Trivial Pursuit game designed for economists would
a.
have no questions but hundreds of answers.
b.
have 100 questions and 3,000 answers.
c.
have 1,000 questions but no answers.
d.
never produce a winner.
3. Economists sometimes give conflicting advice because
a.
graduate students in economics are encouraged to argue with each other.
b.
economists have different values and scientific judgment.
c.
economists acting as scientists do not like to agree with economists acting as policy advisers.
d.
economics is more of a belief system than a science.
4. The two basic reasons why economists often appear to give conflicting advice to policymakers are differences
in
a.
opinions and education.
b.
opinions and values.
c.
scientific judgments and education.
d.
scientific judgments and values.
5. Sometimes economists disagree because their scientific judgments differ. Which of the following instances
best reflects this source of disagreement?
a.
One economist believes income tax cuts are unfair to those with low incomes; another economist
believes income tax cuts are not unfair to those with low incomes.
b.
One economist believes unemployment causes more human suffering than does inflation; another
economist believes inflation causes more human suffering than does unemployment.
c.
One economist believes the policies of the Democratic party offer the best hope for America’s
future; another economist believes the policies of the Republican party offer the best hope for
America’s future.
d.
One economist believes increases in the minimum wage increase unemployment; another
economist believes increases in the minimum wage do not increase unemployment.
64 ❖ Chapter 2/Thinking Like an Economist
6. Sometimes economists disagree because their values differ. Which of the following instances best reflects this
source of disagreement?
a.
One economist believes the North American Free Trade Agreement (NAFTA) has led to a loss of
American jobs; another economist disputes this claim.
b.
One economist believes that when income taxes are cut, people will increase their spending;
another economist believes that when income taxes are cut, people will increase their saving.
c.
One economist advises against increases in sales taxes because she thinks such increases are unfair
to low-income people; another economist disputes the idea that increases in sales taxes are unfair to
low-income people.
d.
One economist believes that, prior to the Civil War, slavery contributed to economic growth in the
South; another economist believes that slavery held back the South’s economic growth.
7. Which of the following is one of the basic reasons why economists often appear to give conflicting advice to
policymakers?
a.
similar opinions about the validity of economic theories
b.
significant differences in education
c.
differences in personal values
d.
a reliance on normative statement for research theories
8. Erma and Wayne are both economists. Erma thinks that taxing consumption, rather than income, would result
in higher household saving because income that is saved would not be taxed. Wayne does not think that
household saving would respond much to a change in the tax laws. In this example, Erma and Wayne
a.
have different normative views about tax policy.
b.
disagree about the validity of a positive theory.
c.
must both be incorrect because economists always agree on policy issues.
d.
None of the above is correct.
9. Which of the following statements is correct about the extent of disagreement among economists?
a.
There is a great deal of agreement among economists on virtually every economic issue.
b.
There is a great deal of agreement among economists on many important economic issues.
c.
All disagreements among economists are attributable to differences in their values.
d.
All disagreements among economists are attributable to the fact that different economists have
different degrees of faith in the validity of alternative economic theories.
Chapter 2/Thinking Like an Economist ❖ 65
10. A survey which sought the opinion of professional economists on fourteen propositions about economic policy
found that
a.
the respondents were almost equally divided on the propositions.
b.
the respondents favored the propositions by a slight margin.
c.
the respondents disagreed with the propositions by a slight margin.
d.
there was overwhelming endorsement of the propositions among the respondents.
11. A survey of professional economists revealed that more than three-fourths of them agreed with a number of
statements, including which of the following?
a.
Tariffs and import quotas usually reduce general economic welfare.
b.
A large federal budget deficit has an adverse effect on the economy.
c.
Minimum wage increases unemployment among young and unskilled workers.
d.
All of the above are correct.
12. A survey of professional economists revealed that more than three-fourths of them agreed with fourteen eco-
nomic propositions. Which of the following is not one of those propositions?
a.
The United States should not restrict employers from outsourcing work to foreign countries.
b.
The United States should withdraw from the North American Free Trade Agreement (NAFTA).
c.
The United States should eliminate agricultural subsidies.
d.
Local and state governments should eliminate subsidies to professional sports franchises.
13. A survey of professional economists revealed that more than three-fourths of them agreed with fourteen eco-
nomic propositions. Which of the following is not one of those propositions?
a.
A ceiling on rents reduces the quantity and quality of housing available.
b.
Fiscal policy has a significant stimulative impact on a less than fully employed economy.
c.
The gap between Social Security funds and expenditures will become unsustainably large within
the next fifty years if current policies remain unchanged.
d.
The United States should implement universal health care for its citizens.
14. Almost all economists agree that rent control
a.
has no effect on the rental income of landlords.
b.
allows the market for housing to work more efficiently.
c.
adversely affects the availability and quality of housing.
d.
is a very inexpensive way to help the most needy members of society.
66 ❖ Chapter 2/Thinking Like an Economist
15. Policies such as rent control and trade barriers persist in spite of the fact that economists are virtually united in
their opposition to such policies, probably because
a.
economists have not yet convinced the general public that the policies are undesirable.
b.
economists engage in positive analysis, not normative analysis.
c.
economists have values that are different from the values of most non-economists.
d.
economists’ theories are not easily confirmed or refuted in laboratory analysis.
16. Policies such as rent control and trade barriers persist
a.
because economists are about evenly divided as to the merits of those policies.
b.
because almost all economists agree that those policies have no discernible economic effects.
c.
because almost all economists agree that those policies are desirable.
d.
despite the fact that almost all economists agree that those policies are undesirable.
17. Almost all economists agree that tariffs and import quotas
a.
reduces general economic welfare.
b.
increases general economic welfare.
c.
have no effect on general economic welfare.
d.
stimulate a less than fully employed economy.
18. Almost all economists agree that local and state governments should
a.
eliminate subsidies to professional sports franchises.
b.
increase subsidies to professional sports franchises.
c.
copy economic policy from Washington, D.C.
d.
prevent companies from outsourcing work.
19. Differences in scientific judgement between economists is similar to all of the following except
a.
astronomers debating whether the sun or earth was at the center of the solar system.
b.
meteorologists debating the existence of global warming.
c.
two politicians arguing about the fairness of the tax code.
d.
explorers debating whether or not the earth was flat before the time of Christopher Columbus.
Chapter 2/Thinking Like an Economist ❖ 67
LET’S GET GOING
1. John Maynard Keynes referred to economics as an easy subject,
a.
at which very few excel.
b.
but not as easy as philosophy or the pure sciences.
c.
which very few can enjoy.
d.
which deals primarily with common sense.
2. How did the influential economist John Maynard Keynes explain his remark that though economics is an easy
subject compared with the higher branches of philosophy or pure science, it is a subject at which few excel?
a.
Most people who study economics are not very bright.
b.
Good economists must possess a rare combination of gifts.
c.
Economics is quite boring; hence, people tend to lose interest in it before mastering it.
d.
Good thinkers become frustrated with economics because it does not make use of the scientific
method.
3. According to economist John Maynard Keynes, a great economist must also be a(n)
a.
mathematician.
b.
historian.
c.
philosopher.
d.
All of the above are correct.
4. The 1990 amendment to the Clean Air Act
a.
banned all forms of pollution.
b.
implemented tradable allowances for acid rain.
c.
created a research council on asthma.
d.
made global warming a national priority.
5. Economists have helped modify the debate over the environment
a.
by pointing out that nature is invaluable.
b.
by focusing discussion on issues of resource allocation.
c.
by lobbying Congress for acid rain legislation.
d.
by arguing against tradeable permits for pollution.
68 ❖ Chapter 2/Thinking Like an Economist
6. In the past, environmentalists thought of economics as a method of maximizing profits. Presently,
a.
there is now realization that economics offers a framework for natural resource allocation.
b.
economists are helping to formulate the intellectual framework behind approaches to protecting
endangered species, reducing pollution, and preventing climate change.
c.
economics informs environmental studies but economists still do not work for environmental
advocacy groups.
d.
More than one of the above is correct.
GRAPHING: A BRIEF REVIEW
1. Which of the following is not correct?
a.
When developing economic theories, graphs offer a way to visually express ideas that might be less
clear if described with equations or words.
b.
Graphs are one way of expressing the relationships among variables.
c.
When studying the relationship between two economic variables, graphs allow economists to draw
indisputable conclusions about causes and effects.
d.
When analyzing economic data, graphs provide a powerful way of finding and interpreting patterns.
2. Which of the following is not an example of a graph of a single variable?
a.
a pie chart
b.
a bar graph
c.
a time-series graph
d.
a scatterplot
3. Graphs such as bar graphs and pie charts are limited in that they
a.
can only show variables that are positively related.
b.
can only show variables that have a negative correlation.
c.
provide information on only one variable.
d.
provide information on no more than two variables.
4. Philip wants to create a graph containing the prices of apples and the corresponding quantities of apples de-
manded by customers. He should use a(n)
a.
pie chart.
b.
bar graph.
c.
time-series graph
d.
coordinate system.
Chapter 2/Thinking Like an Economist ❖ 69
5. The use of the coordinate system allows
a.
for the display of the flows of dollars, goods and services, and factors of production in an economic
system.
b.
for the display of how labor and other resources are organized in the production process.
c.
for the display of two variables on a single graph.
d.
for the creation of pie charts and bar graphs.
6. In order to display information on two variables, an economist must use
a.
a bar graph.
b.
a pie chart.
c.
the coordinate system.
d.
a time-series graph.
7. Which of the following allows you to provide information about the relationship between two variables?
a.
coordinate system.
b.
pie chart
c.
bar graph
d.
time-series graph
8. An ordered pair is
a.
the process of checking calculations twice before placing them on a graph.
b.
two numbers that can be represented by a single point on a graph.
c.
two numbers that are represented by two points on a graph.
d.
two points on a graph that are of equal distance from the origin.
9. The x-coordinate is the
a.
first number of an ordered pair and represents the point’s horizontal location.
b.
second number of an ordered pair and represents the point’s horizontal location.
c.
first number of an ordered pair and represents the point’s vertical location.
d.
second number of an ordered pair and represents the point’s vertical location.
10. The x-coordinate of an ordered pair specifies the
a.
diagonal location of the point.
b.
vertical location of the point.
c.
horizontal location of the point.
d.
quadrant location in which the point is located.
70 ❖ Chapter 2/Thinking Like an Economist
11. The first number in any ordered pair is
a.
the x-coordinate.
b.
the y-coordinate.
c.
the vertical location of the point.
d.
the slope.
12. The y-coordinate is the
a.
first number of an ordered pair and represents the point’s horizontal location.
b.
second number of an ordered pair and represents the point’s horizontal location.
c.
first number of an ordered pair and represents the point’s vertical location.
d.
second number of an ordered pair and represents the point’s vertical location.
13. The y-coordinate of an ordered pair specifies the
a.
diagonal location of the point.
b.
vertical location of the point.
c.
horizontal location of the point.
d.
quadrant location in which the point is located.
14. The second number in any ordered pair is
a.
the x-coordinate.
b.
the y-coordinate.
c.
the horizontal location of the point.
d.
the slope.
15. In the ordered pair (17, 75), 17 is the
a.
vertical location of the point.
b.
the slope.
c.
the x-coordinate.
d.
the y-coordinate.
16. In the ordered pair (17, 75), 75 is the
a.
horizontal location of the point.
b.
the slope.
c.
the x-coordinate.
d.
the y-coordinate.
Chapter 2/Thinking Like an Economist ❖ 71
17. The point where both x and y are zero is known as the
a.
origin.
b.
null.
c.
zero coordinate.
d.
center.
18. The ordered pair that represents the origin on a graph is
a.
(1, 1).
b.
(0, 0).
c.
(-1, -1).
d.
().
19. When two variables have a positive correlation,
a.
they tend to move in opposite directions.
b.
they tend to move in the same direction.
c.
one variable will move while the other remains constant.
d.
the variables’ values are never negative.
20. When two variables have a positive correlation,
a.
when the x-variable increases, the y-variable decreases.
b.
when the x-variable decreases, the y-variable increases.
c.
when the x-variable increases, the y-variable increases.
d.
More than one of the above is correct.
21. When two variables have a negative correlation,
a.
they tend to move in opposite directions.
b.
they tend to move in the same direction.
c.
one variable will move while the other remains constant.
d.
the variables’ values are never positive.
22. When two variables have a negative correlation,
a.
when the x-variable decreases, the y-variable decreases.
b.
when the x-variable decreases, the y-variable increases.
c.
when the x-variable increases, the y-variable increases.
d.
More than one of the above is correct.
72 ❖ Chapter 2/Thinking Like an Economist
23. When two variables have a negative correlation and the x-variable decreases,
a.
the y-variable increases.
b.
the y-variable decreases.
c.
the y-variable stays the same.
d.
the x-variable can never be positive.
TOP: Graphs MSC: Interpretive
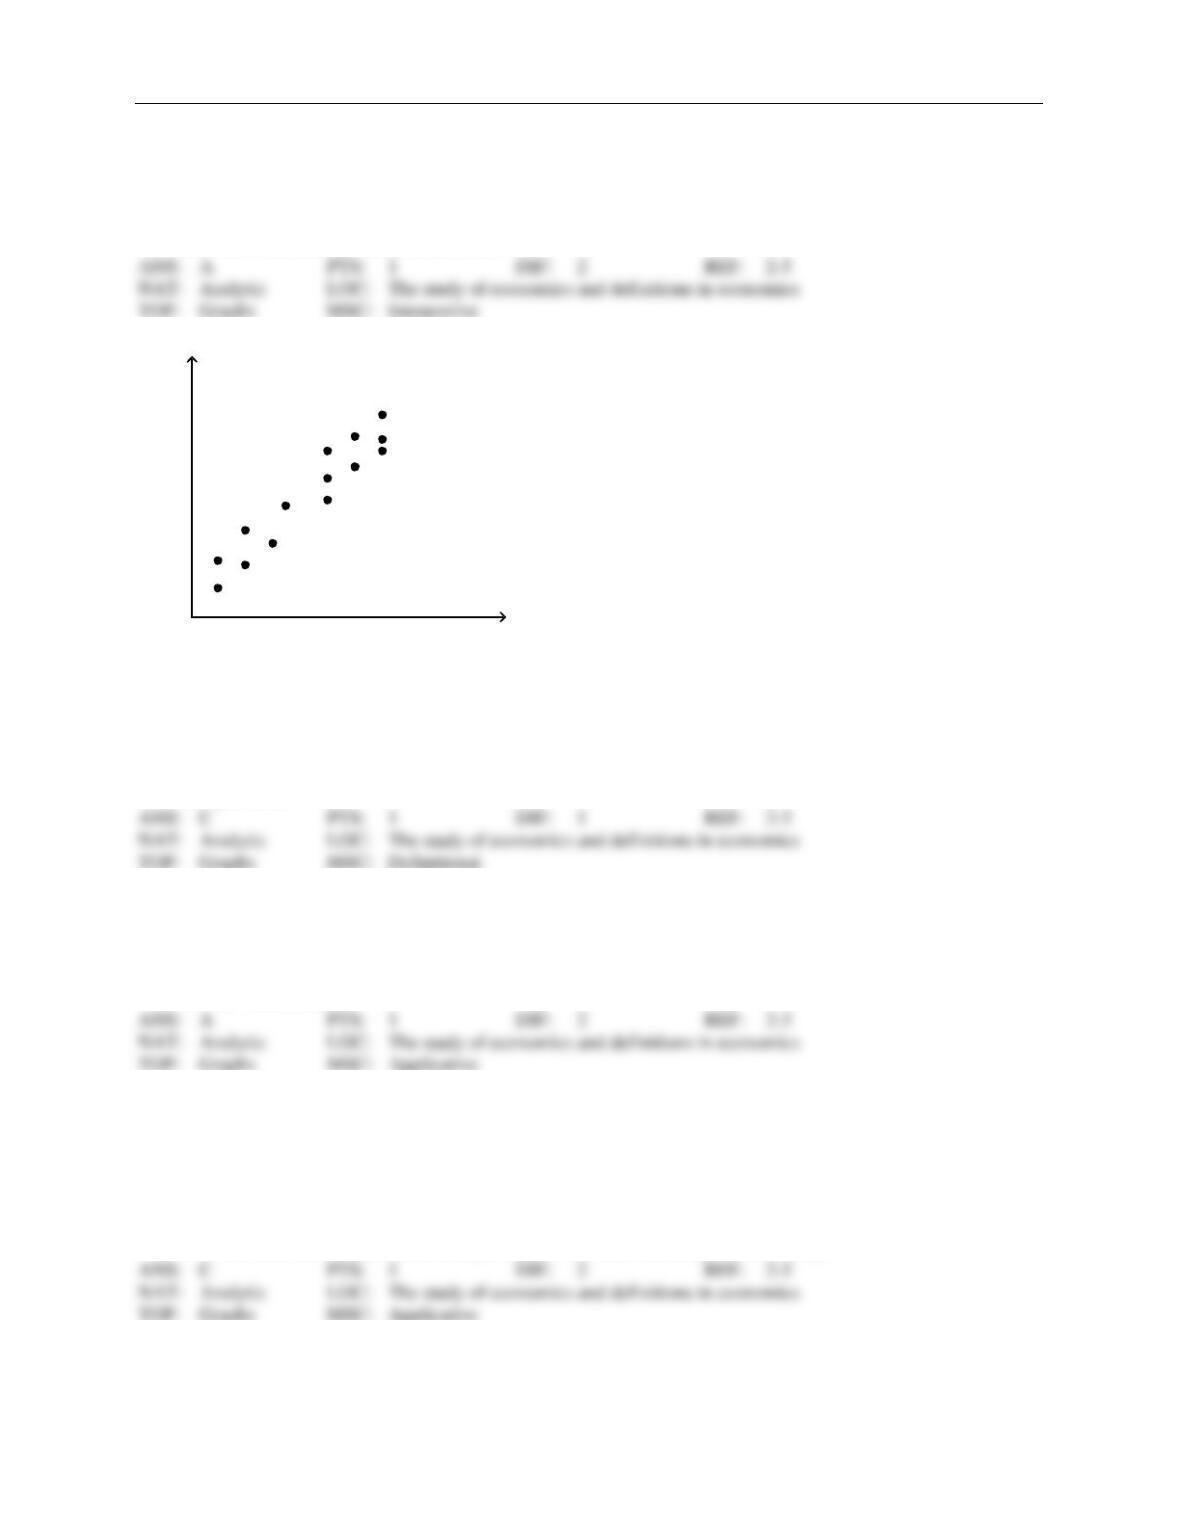
Figure 2-13
cups of coffee per day
hours without sleep
24. Refer to Figure 2-13. The graph shown is known as a
a.
time-series graph.
b.
bar graph.
c.
scatterplot.
d.
pie chart.
25. Refer to Figure 2-13. Cups of coffee per day and the hours that someone can go without sleep appear to have
a.
a positive correlation.
b.
a negative correlation.
c.
a random correlation.
d.
no correlation.
26. Refer to Figure 2-13. Taking cause and effect into account, which of the following interpretations would be
most reasonable regarding the relationship between coffee and hours without sleep?
a.
The less coffee a person drinks per day, the more time he can go without sleep.
b.
There is no relationship between how much coffee per day a person drinks and how long he can go
without sleep.
c.
The more coffee a person drinks per day, the more time he can go without sleep.
d.
The more coffee a person drinks per day, the less time he can go without sleep.
Chapter 2/Thinking Like an Economist ❖ 73
27. When two variables move in opposite directions, the curve relating them is
a.
upward sloping, and we say the variables are positively related.
b.
upward sloping, and we say the variables are negatively related.
c.
downward sloping, and we say the variables are positively related.
d.
downward sloping, and we say the variables are negatively related.
28. When two variables move in the same direction, the curve relating them is
a.
upward sloping, and we say the variables are positively related.
b.
upward sloping, and we say the variables are negatively related.
c.
downward sloping, and we say the variables are positively related.
d.
downward sloping, and we say the variables are negatively related.
29. When a relevant variable that is not named on either axis changes,
a.
there will be a movement along the curve.
b.
the curve will rotate clockwise.
c.
the curve will be unaffected since only the variables on the axis affect the curve.
d.
the curve will shift.
30. Suppose price is measured along the vertical axis on a graph. When price changes, there will be a
a.
rotation of the curve.
b.
shift of the curve.
c.
movement along the curve.
d.
change in the slope of the curve.
31. A demand curve shows the relationship
a.
between income and quantity demanded.
b.
between price and income.
c.
between price and quantity demanded.
d.
among income, price, and quantity demanded.
32. A demand curve shows the relationship between price and
a.
income.
b.
quantity demanded.
c.
production.
d.
income and quantity demanded.
74 ❖ Chapter 2/Thinking Like an Economist
33. A demand curve displaying the relationship between the price of cars and the quantity demanded of cars
should have a slope that is
a.
less than 0.
b.
between zero and 1.
c.
between one and infinity.
d.
undefined.
34. Which of the following is not held constant when looking at an individual’s demand curve?
a.
income
b.
price
c.
preferences
d.
the availability of alternative goods
35. If Erin’s income decreases and, as a result, she chooses to buy fewer milkshakes per month at each price, then
her demand curve will
a.
shift to the right.
b.
shift to the left.
c.
not shift; instead, Erin will move along her demand curve downward and to the right.
d.
not shift; instead, Erin will move along her demand curve upward and to the left.
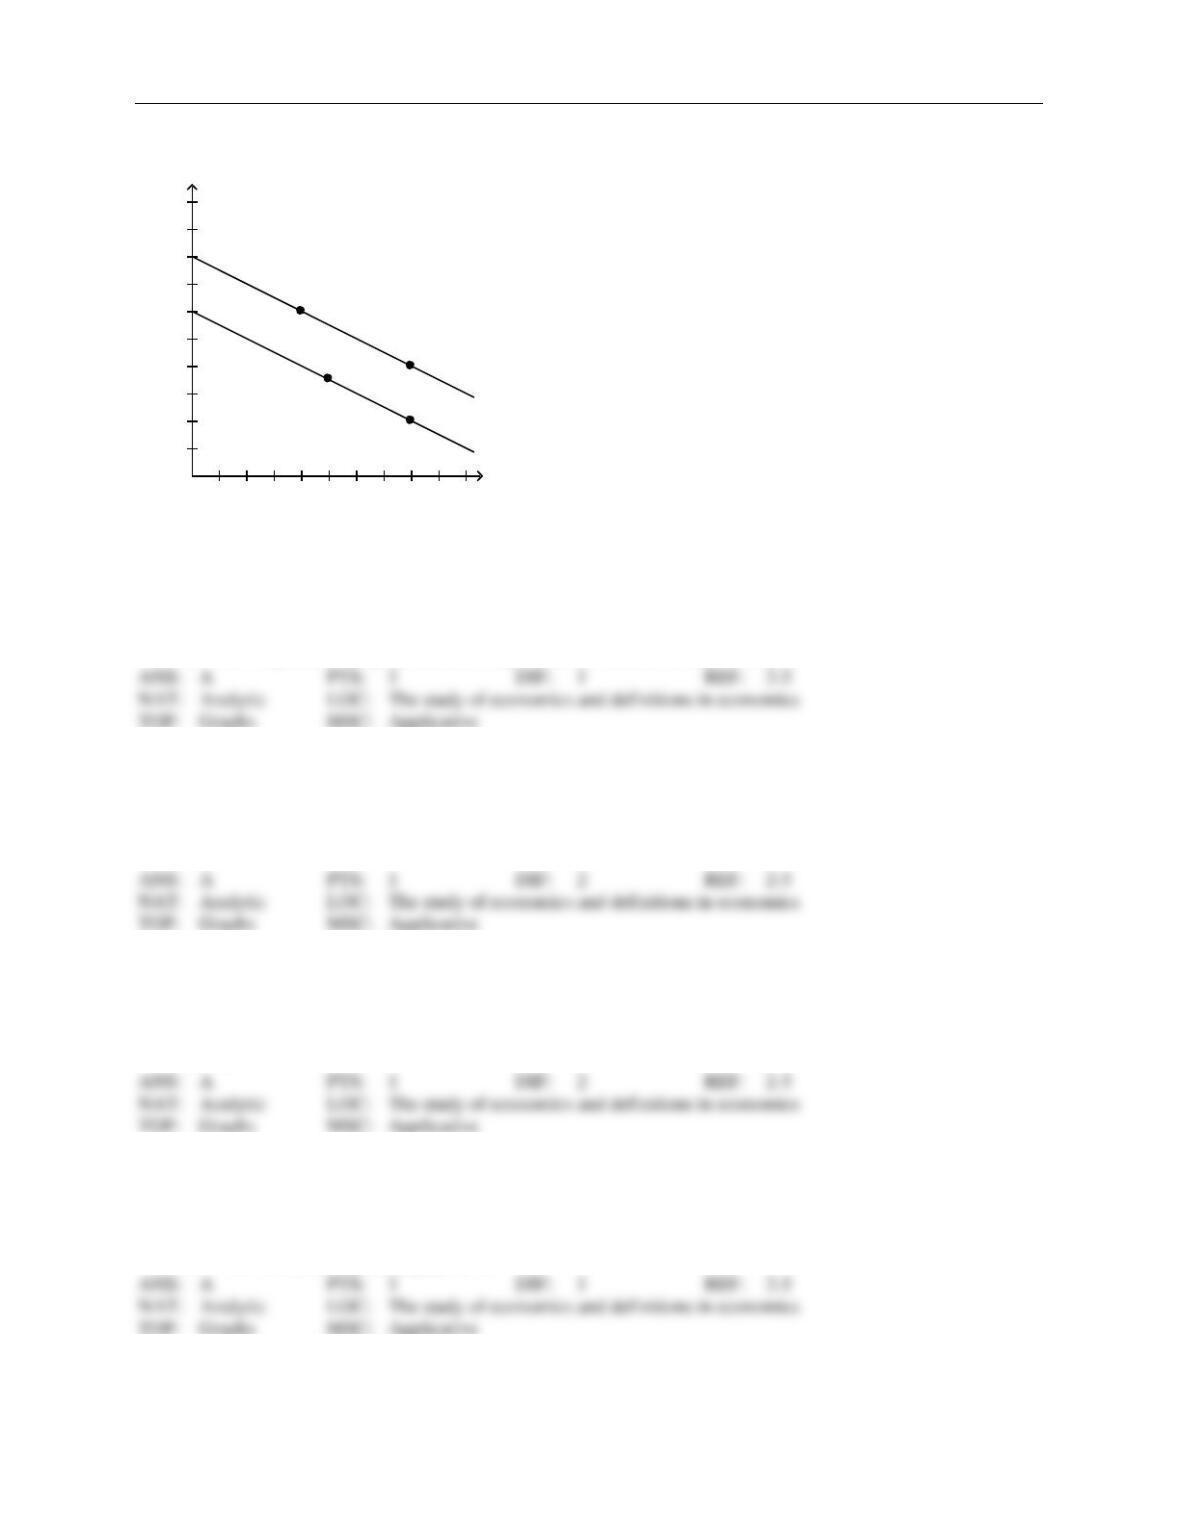
Figure 2-14
dozens of pounds of grapes
price of a pound of grapes
A
B
C
2 4 6 8 10 12 14 16 18 20 22
10
20
30
40
50
60
70
80
36. Refer to Figure 2-14. The curves shown are
a.
supply curves.
b.
demand curves.
c.
preference curves.
d.
income-consumption curves.
Chapter 2/Thinking Like an Economist ❖ 75
37. Refer to Figure 2-14. The movement from point A to point B is a(n)
a.
shift of the demand curve.
b.
indication of a change in preferences for grapes.
c.
movement along the demand curve.
d.
indication of an increase in income.
38. Refer to Figure 2-14. The movement from point B to point C is a(n)
a.
shift of the demand curve.
b.
movement along the demand curve.
c.
indication that the price of grapes has changed.
d.
indication that the costs incurred by firms that produce grapes have changed.
39. Refer to Figure 2-14. The movement from point B to point C could have been caused by
a.
inflation.
b.
a change in income.
c.
a change in the price of grapes.
d.
a change in the cost of producing grapes.
40. Refer to Figure 2-14. The slope of the curve between points A and B is
a.
-5
b.
-1/5
c.
1/5
d.
5
41. The slope of a line is equal to
a.
the change in the value of x divided by the change in the value of y.
b.
the change in the value of y divided by the change in the value of x.
c.
the horizontal distance divided by the vertical distance.
d.
the value of y divided by the value of x.
42. The slope of a line is equal to
a.
rise divided by run.
b.
run divided by rise.
c.
rise minus run.
d.
rise plus run.
76 ❖ Chapter 2/Thinking Like an Economist
43. Which of the following is not correct?
a.
The slope of a line will be a small positive number for a fairly flat upward-sloping line.
b.
The slope of a line will be a large positive number for a steep upward-sloping line.
c.
The slope of a line will be a negative number for a downward-sloping line.
d.
The slope of a line will be infinite for a horizontal line.
44. Which of the following is correct?
a.
A horizontal line has an infinite slope, and a vertical line has a zero slope.
b.
A horizontal line has a slope of 1, and a vertical line has a slope of –1.
c.
A horizontal line has a zero slope, and a vertical line has an infinite slope.
d.
A horizontal line has a slope of -1, and a vertical line has a slope of 1.
45. The slope of a fairly flat upward-sloping line will be a
a.
small positive number.
b.
large positive number.
c.
small negative number.
d.
large negative number.
46. The slope of a steep upward-sloping line will be a
a.
small positive number.
b.
large positive number.
c.
small negative number.
d.
large negative number.
47. The slope of a line that passes through the points (10, 15) and (20, 7) is
a.
-5/4.
b.
-4/5.
c.
4/5.
d.
5/4.
48. The slope of a line that passes through the points (15, 10) and (7, 30) is
a.
-5/2.
b.
-2/5.
c.
2/5.
d.
5/2.
Chapter 2/Thinking Like an Economist ❖ 77
49. The slope of a line passing through the points (12, 8) and (16, 5) is
a.
-3/4.
b.
3/4.
c.
-4/3.
d.
4/3.
50. A relatively steep demand curve indicates that
a.
quantity demanded will adjust only slightly to a price change.
b.
quantity demanded will adjust significantly to a price change.
c.
quantity demanded will not adjust to a price change.
d.
the change in quantity demanded will exactly equal a change in price.
51. A relatively flat demand curve indicates that
a.
quantity demanded will adjust only slightly to a price change.
b.
quantity demanded will adjust significantly to a price change.
c.
quantity demanded will not adjust to a price change.
d.
the change in quantity demanded will exactly equal a change in price.
52. When income increases the slope of an individual’s demand curve, the demand curve
a.
turns positive.
b.
becomes undefined.
c.
remains negative.
d.
becomes infinite.
78 ❖ Chapter 2/Thinking Like an Economist
Figure 2-15
Relationship between Price and Cups of Coffee
A (4,6)
B (8,4)
Y (5, 3.5)
Z (8,2)
1 2 3 4 5 6 7 8 9 Cups
1
2
3
4
5
6
7
8
9
10 Price
53. Refer to Figure 2-15. In the ordered pair (4, 6)
a.
the x-coordinate is 4 and the y-coordinate is 6.
b.
the x-coordinate is 6 and the y-coordinate is 4.
c.
the numbers tell the location of the origin.
d.
the 4 represents the price and the 6 represents the number of cups of coffee.
54. Refer to Figure 2-15. The slope of the line containing points Y and Z is
a.
-0.5.
b.
–1.
c.
–2.
d.
–4.
55. Refer to Figure 2-15. The slope of the line containing points A and B is
a.
-1/2.
b.
–2.
c.
1/2.
d.
2.
56. Refer to Figure 2-15. A movement from point A to point Z is called
a.
a shift in demand.
b.
a movement along the demand curve.
c.
a shift in supply.
d.
a movement along the supply curve.
Chapter 2/Thinking Like an Economist ❖ 79
57. Refer to Figure 2-15. A movement from point A to point B is called
a.
a shift in demand.
b.
a movement along the demand curve.
c.
a shift in supply.
d.
a movement along the supply curve.
58. Refer to Figure 2-15. Which of the following could result in a movement from point A to point B?
a.
a change in income
b.
a change in preferences
c.
a change in the price of coffee
d.
a change in the price of tea
59. Refer to Figure 2-15. Which of the following could result in a movement from point B to point Z?
a.
a change in the price of coffee
b.
a change in the number of cups of coffee demanded
c.
a change in income
d.
More than one of the above is correct.
60. Suppose that someone makes the argument that because empty alcohol containers are found at many acci-
dents, the containers cause accidents. This would be an example of
a.
sound logic.
b.
reverse causality.
c.
omitted variables.
d.
bias.
61. Alfonso has noticed that increases in unemployment insurance claims are associated with recessions, and
therefore he advocates limits on unemployment insurance so as to prevent recessions. Mary has noticed that
most drug addicts once attended schools, and therefore she advocates getting rid of schools so as to prevent
drug addiction.
a.
The reasoning of both Alfonso and Mary suffers from the omitted variable problem.
b.
The reasoning of both Alfonso and Mary suffers from the reverse causality problem.
c.
Alfonso’s reasoning suffers from the reverse causality problem, and Mary’s reasoning suffers from
the omitted variable problem.
d.
Mary’s reasoning suffers from the reverse causality problem, and Alfonso’s reasoning suffers from
the omitted variable problem.
62. In the early 19th century, the Russian government sent doctors to southern Russian villages to provide assis-
tance during a cholera epidemic. The villagers noticed that wherever doctors appeared, people died. There-
80 ❖ Chapter 2/Thinking Like an Economist
fore, many doctors were chased away from villages, and some were even killed. This reaction to the correla-
tion between doctors and deaths is most likely a problem of
a.
omitted variables.
b.
reverse causality.
c.
government propaganda.
d.
medical incompetence.
63. The argument that purchases of minivans cause large families is an example of
a.
omitted variables.
b.
normative statements.
c.
reverse causality.
d.
bias.
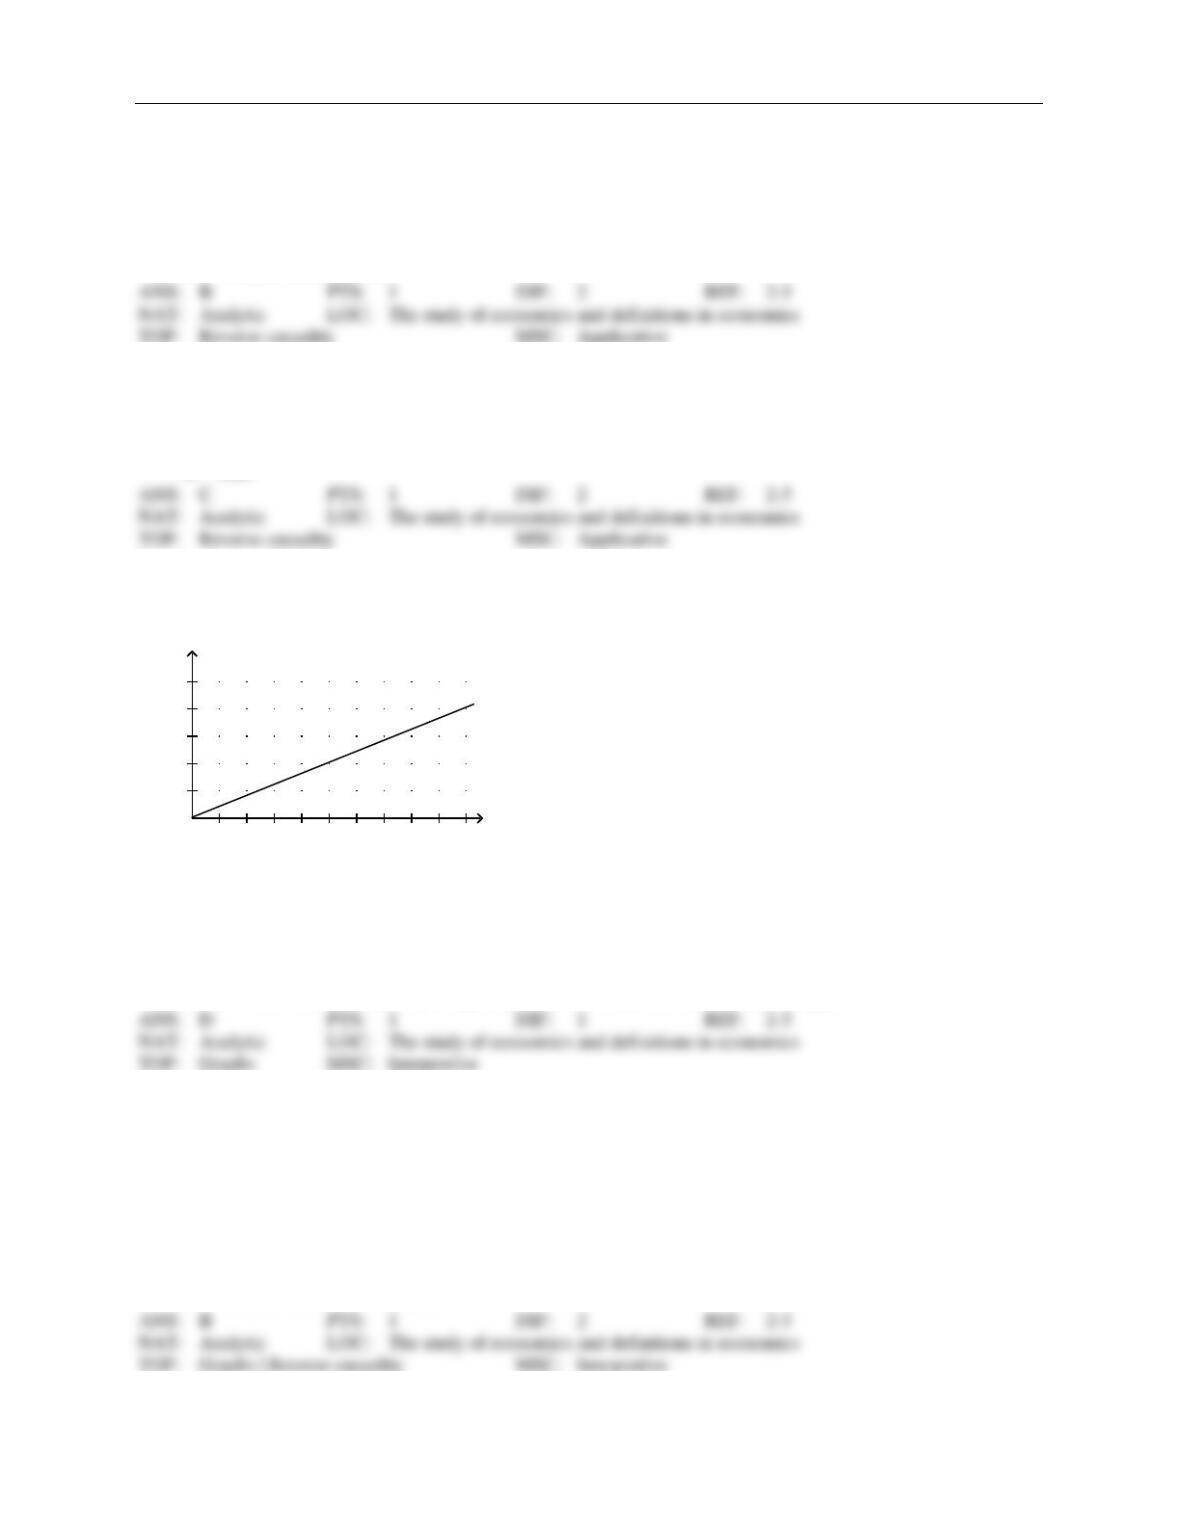
Figure 2-16
In the following graph the x-axis shows the number of times a commuter rail train stops at a station per hour
and the y-axis shows the number of commuter rail passengers per hour.
Commuter Rail Passengers by Frequency of Service
number of stops per hour
passengers per hour
1 2 3 4 5 6 7 8 9 10
100
200
300
400
500
64. Refer to Figure 2-16. Which of the following conclusions should not be drawn from observing this graph?
a.
There is a positive correlation between the frequency of service and the number of passengers.
b.
When there are 5 stops per hour, there are approximately 200 passengers.
c.
More stops per hour is associated with more passengers per hour.
d.
No other factors besides the frequency of service affect the number of passengers.
65. Refer to Figure 2-16. A policymaker observes this graph and concludes that increasing the frequency of
commuter rail service is a certain way to get more commuters to choose the commuter rail instead of driving
their own cars. You warn the policymaker about making a reverse causality mistake with which of the follow-
ing statements?
a.
Higher gas prices are causing more people to choose the commuter rail over driving.
b.
The service frequency was increased in response to an increase in the number of passengers per
hour.
c.
There is a positive relationship between frequency of stops and number of passengers.
d.
None of the above is correct.