122 Miller Economics Today, 16th Edition
23) The curve that represents all possible combinations of goods that can be produced is called
A) the production possibilities curve. B) the resource allocation curve.
C) the efficiency curve. D) the supply curve.
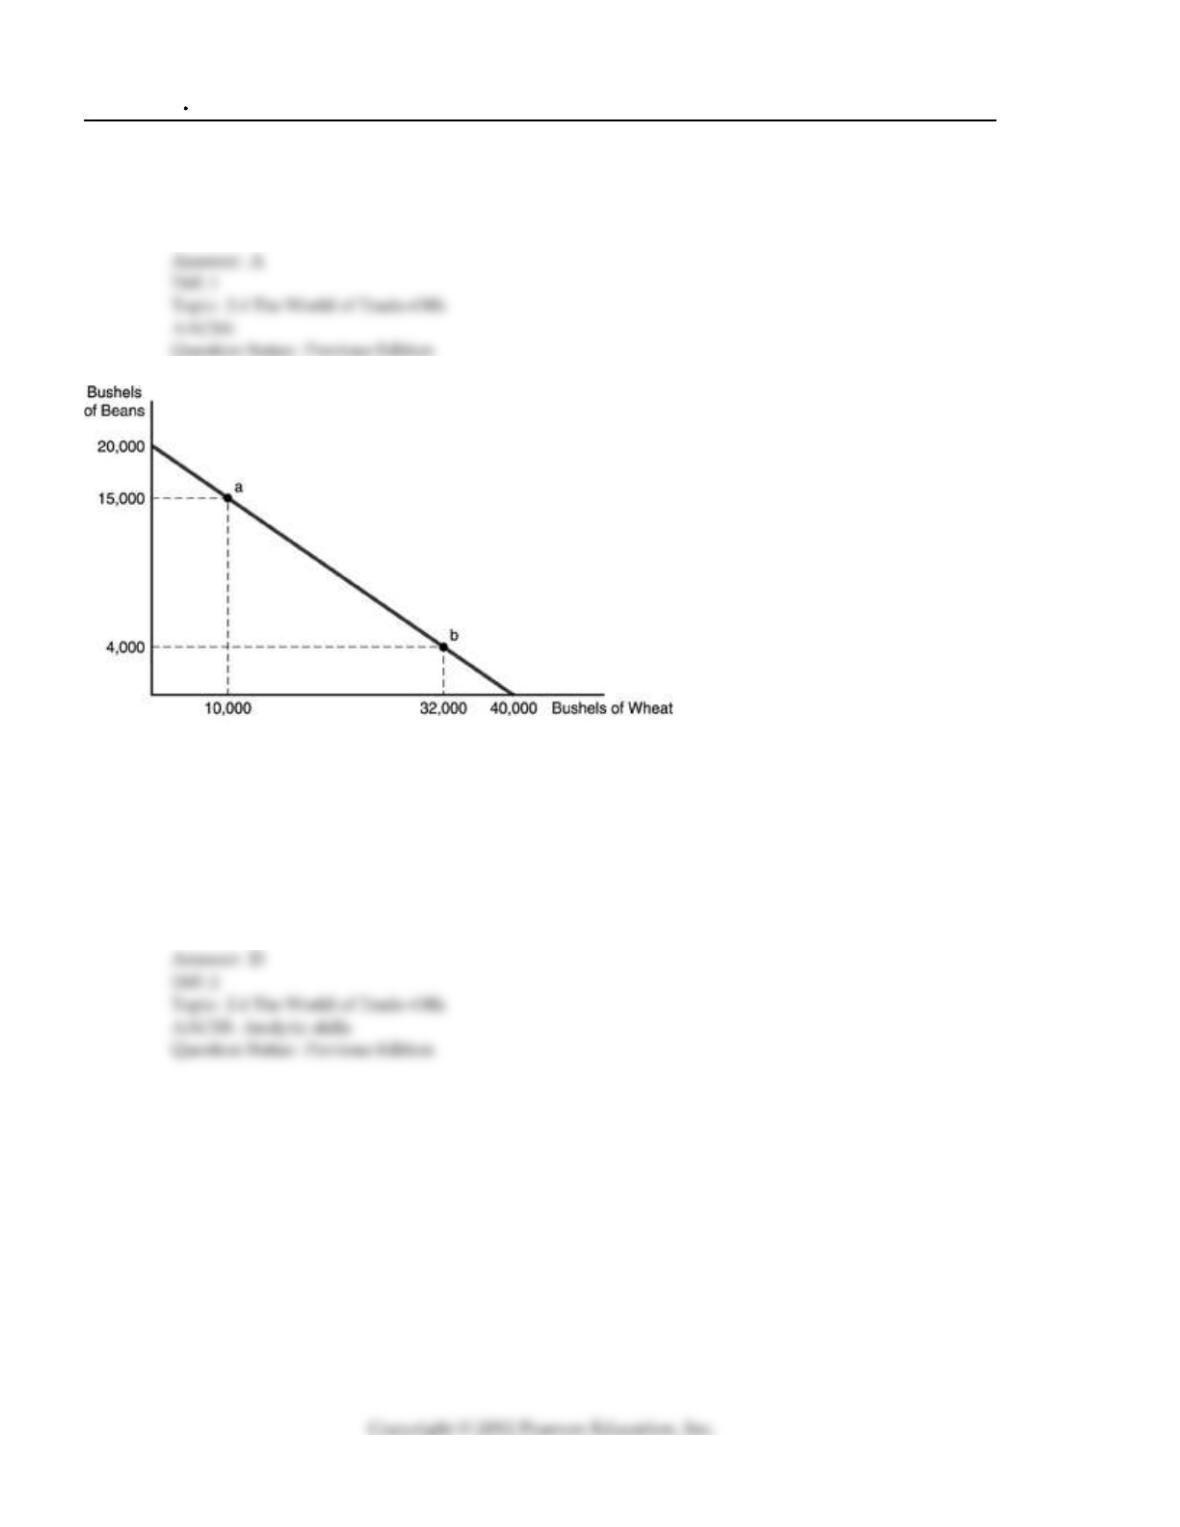
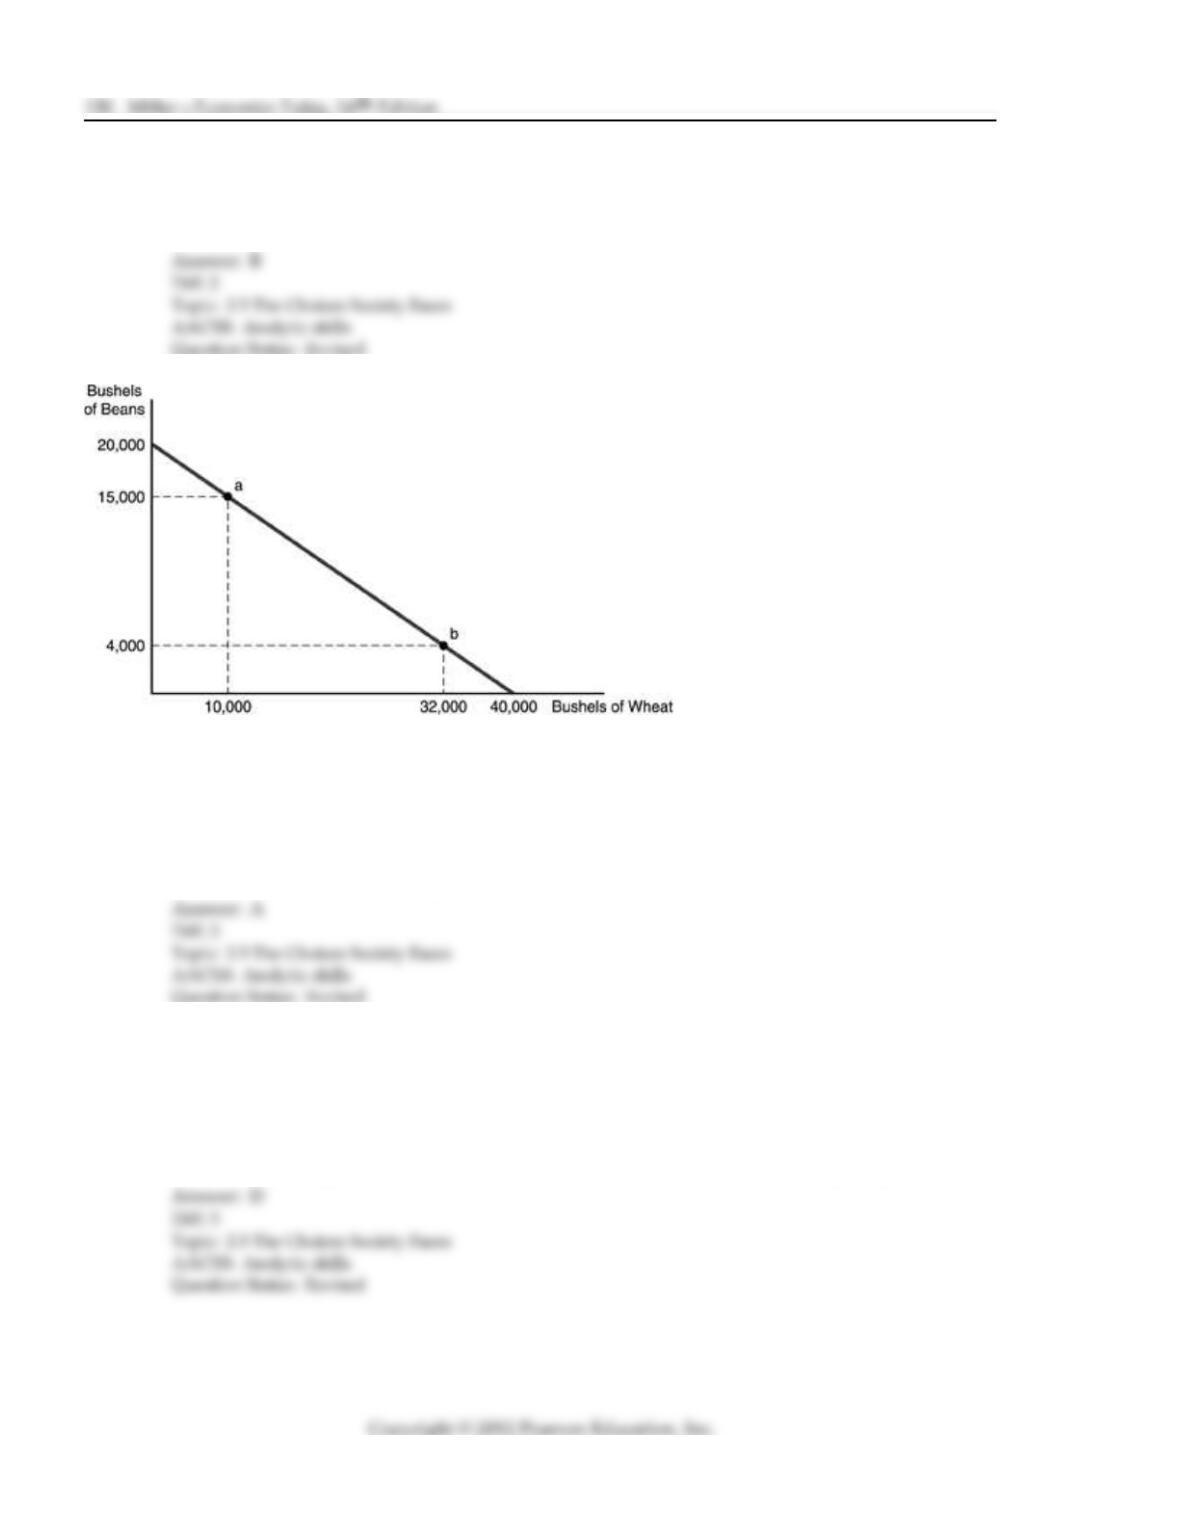
24) Refer to the above figure. A farmer has 50 acres of land on which to grow wheat or beans. An
acre of land yields 400 bushels of beans or 800 bushels of wheat. Which of the following is a
possible combination of beans and wheat that can be grown, assuming the land is farmed
efficiently?
A) 30,000 bushels of each
B) 20,000 bushels of beans and 40,000 bushels of wheat
C) 5,000 bushels of beans and 5,000 bushels of wheat
D) 16,000 bushels of beans and 8,000 bushels of wheat
25) Refer to the above figure. A farmer has 50 acres of land on which to grow wheat or beans. An
acre of land yields 400 bushels of beans or 800 bushels of wheat. Which of the following is a
possible combination of beans and wheat that can be grown, assuming the land is farmed
efficiently?
A) 30,000 bushels of each
B) 15,000 bushels of beans and 10,000 bushels of wheat
C) 25,000 bushels of beans and 25,000 bushels of wheat
D) 20,000 bushels of beans and 40,000 bushels of wheat
26) In the above figure, the farmer faces a trade off between beans and wheat equal to
A) one to one. B) three to one. C) one to two. D) one to four.
27) The above figure is referred to as a(n)
A) trade off curve. B) opportunity curve.
C) production possibilities curve. D) scarcity shortage curve.
28) Refer to the above figure. If the farmer has 50 acres of land, the farmer is producing at point a,
and an acre of land yields 400 bushels of beans or 800 bushels of wheat, how much land is
devoted to the production of wheat?
A) 8.5 acres B) 10 acres C) 12.5 acres D) 15 acres
29) The production possibilities curve demonstrate which of the following concepts?
A) scarcity B) choice
C) trade offs D) all of the above
30) The production possibilities curve shows all possible combinations of
A) two goods that are desired by society.
B) two goods that can be efficiently produced with a given set of resources.
C) two goods that can be purchased given the prices of the goods.
D) two goods that two countries can trade with each other.
31) A straight line production possibilities curve has
A) an increasing opportunity cost between the two goods.
B) a decreasing opportunity cost between the two goods.
C) a constant opportunity cost between the two goods.
D) no opportunity cost between the two goods.
32) Which of the following would result in a movement along the production possibilities curve?
A) A fall in the unemployment rate
B) Growth in the capital stock
C) Population growth
D) A change in the outputs of two goods that a society chooses to produce
33) A movement along the production possibilities curve would imply that
A) the labor force has grown.
B) productivity has increased.
C) society has chosen a different set of outputs.
D) productivity has declined because workers are demanding more leisure.
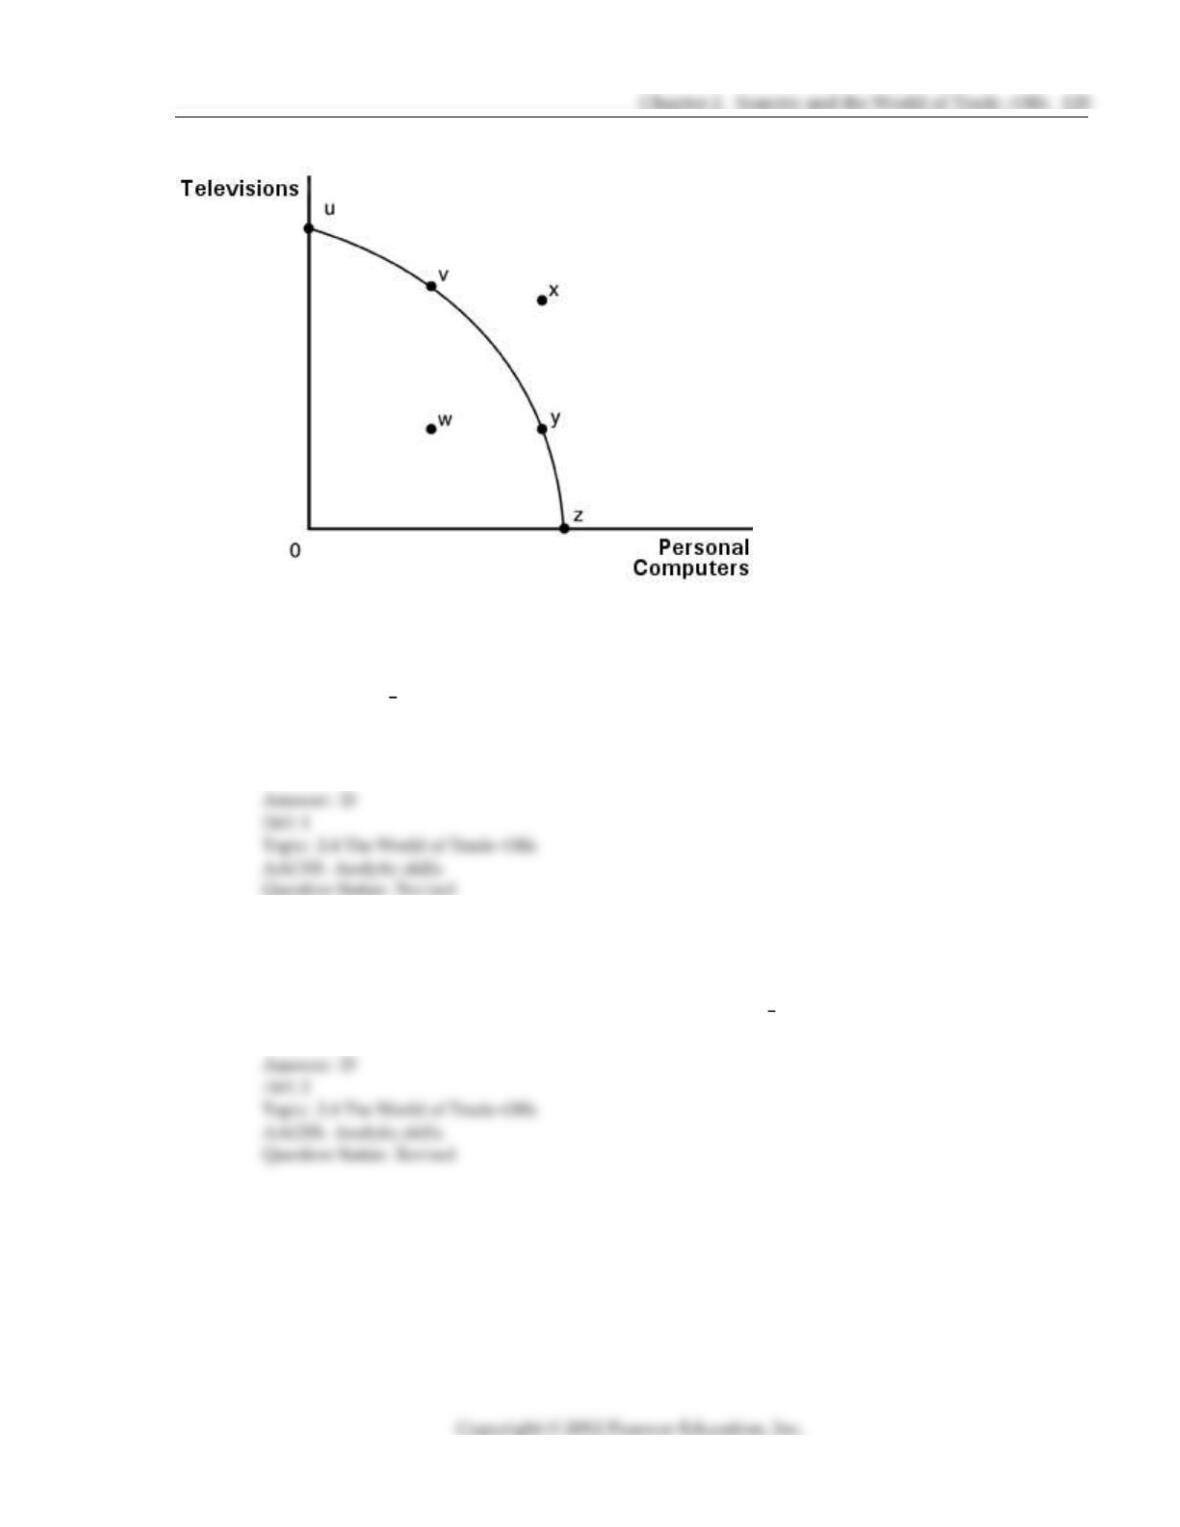
34) Which of the following statements about a movement along the production possibilities curve in
the above figure is FALSE?
A) An additional computer can be produced only if fewer televisions are produced.
B) The trade off between computers and televisions is not constant.
C) Society cannot have more of both goods at the same time.
D) There are no opportunity costs involved in choosing one point on the curve over all other
points.
35) If the production possibilities curve is a downward sloping straight line, then
A) resources are highly specialized, making it difficult to use them for alternative uses.
B) technological change has increased.
C) production is efficient only when producing at the mid point.
D) all resources must be perfectly adaptable for alternative uses.
36) A graphical representation which shows the trade off that occurs when more of one output is
obtained at the sacrifice of another is called
A) a Laffer Curve. B) a production possibilities curve.
C) a bell curve. D) a supply curve.
37) Suppose an acre of land yields 100 bushels of corn and that one bushel of corn provides enough
seed for one quarter of an acre of land. The opportunity cost of consuming another 100 bushels
of corn today is
A) 100 bushels of corn next year. B) 25 bushels of corn next year.
C) 10 bushels of corn next year. D) 2.5 bushels of corn next year.
38) What does the slope of the production possibilities curve represent? Explain.
39) What does a production possibilities curve show?
40) How can the concepts of opportunity costs, scarcity and choice by illustrated by the production
possibilities curve?
2.5 The Choices Society Faces
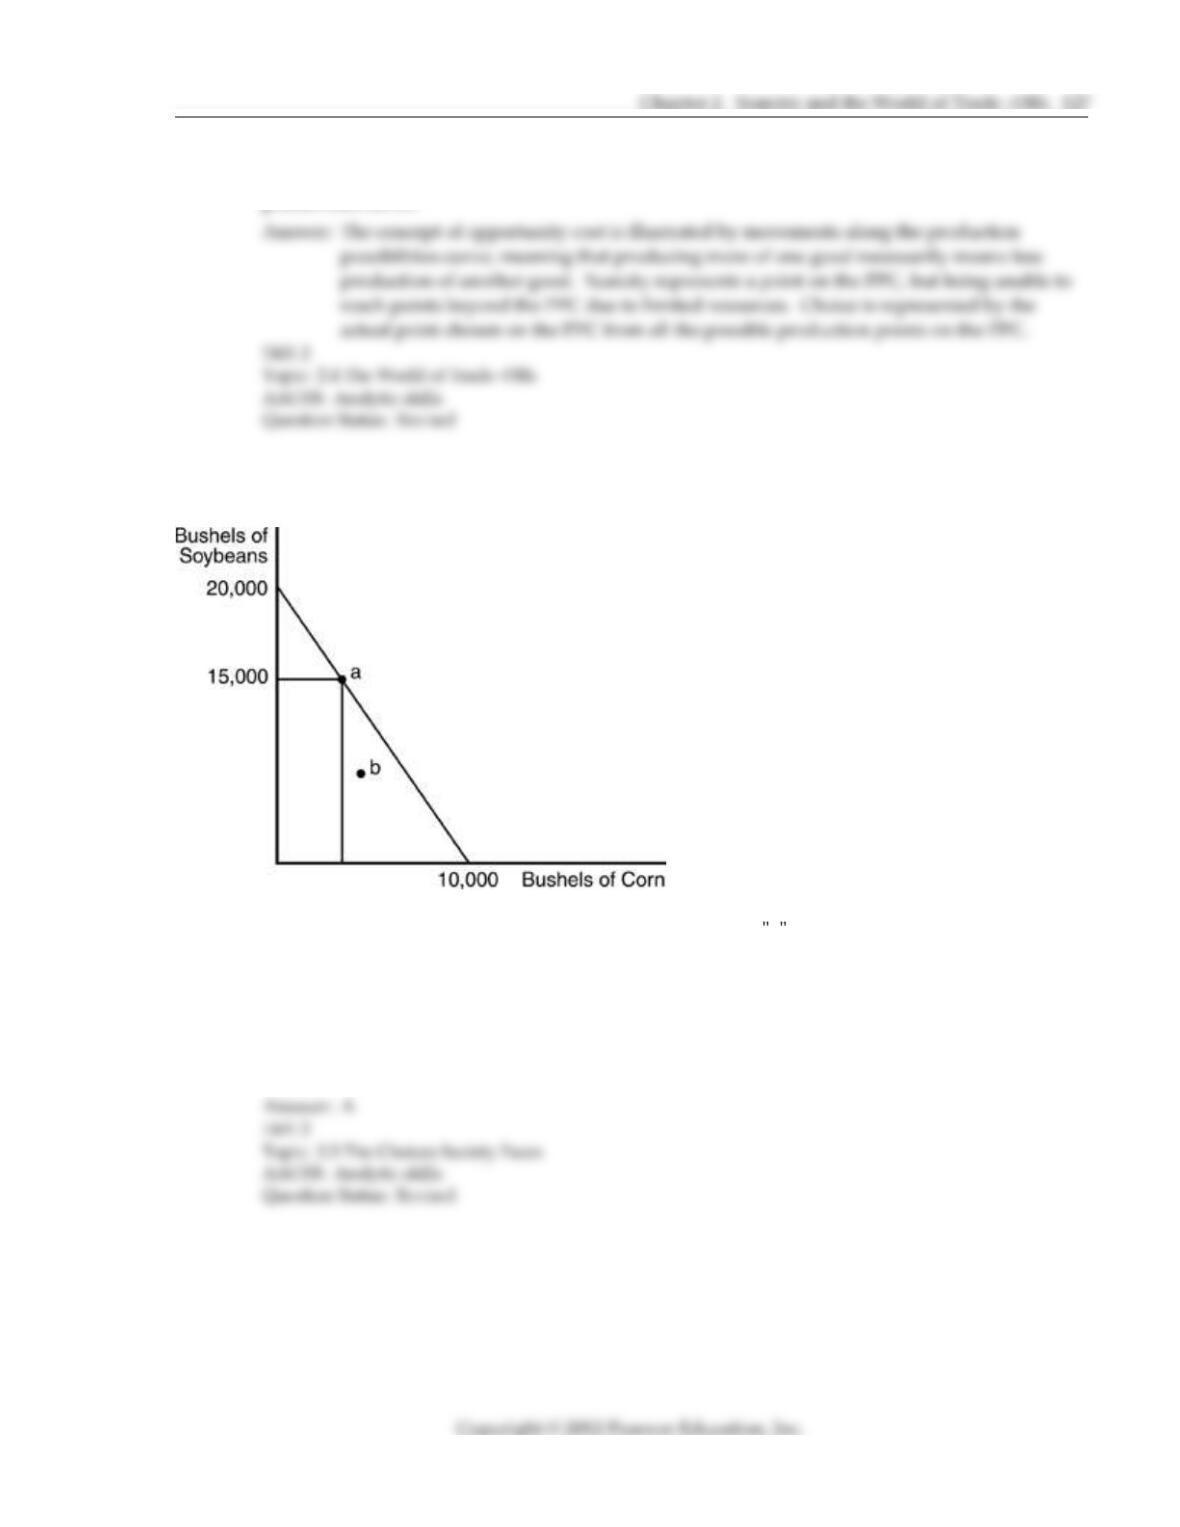
1) If the farmer is producing 5000 bushels of soybeans at point b in the above figure, we know
that
A) the farmer is not using his resources efficiently.
B) the farmer is using his land to produce a crop other than soybeans or corn.
C) the farmer must be using more land than was used in constructing the production
possibilities curve.
D) the farmer is using his resources efficiently.
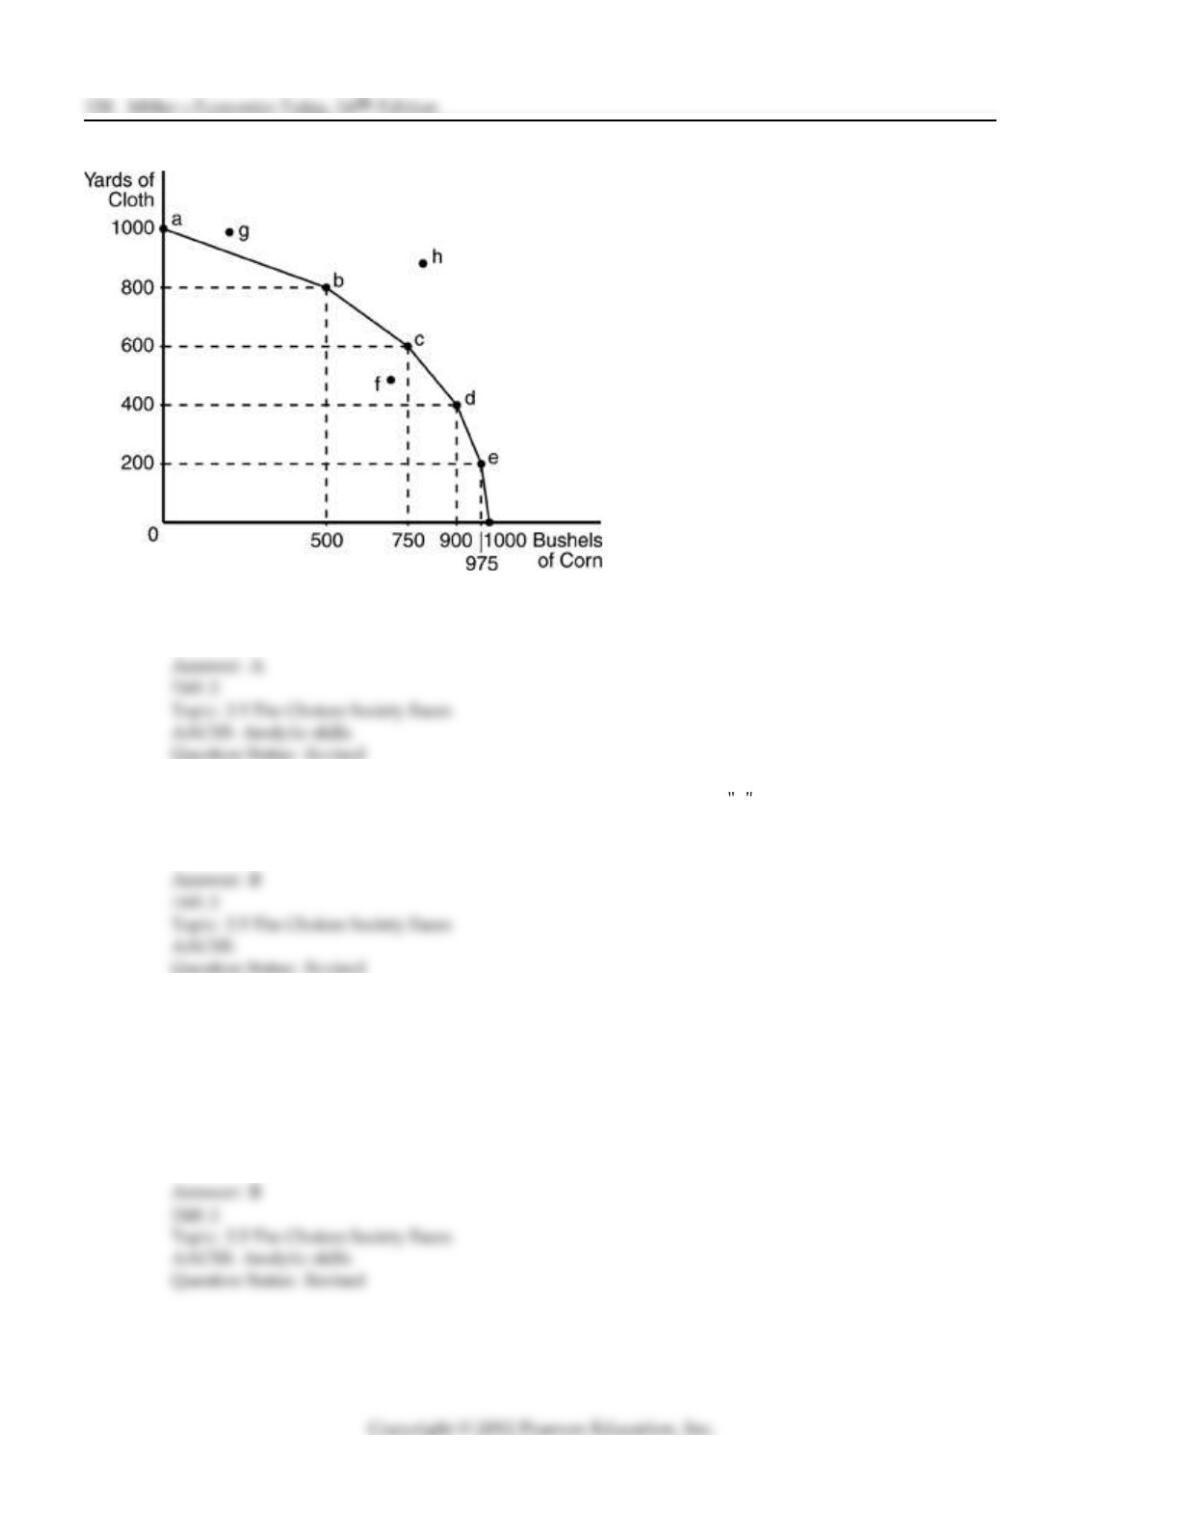
2) In the above figure, which of the following points indicates the efficient use of resources?
A) a B) f C) g D) h
3) Which of the following would NOT allow society to move to point h in the above figure?
A) An improvement in technology B) More efficient use of current resources
C) An increase in quantity of labor D) An increase in quantity of capital
4) The shape of the production possibilities curve in the above figure indicates that
A) production of corn is characterized by increasing costs while the production of cloth is
characterized by decreasing costs.
B) production of both corn and cloth is characterized by increasing costs.
C) production of both corn and cloth is characterized by constant costs.
D) production of corn is characterized by constant costs and the production of cloth is
characterized by increasing costs.
5) Between points b and c in the above figure, the opportunity cost of 250 more bushels of corn
is
A) 200 yards of cloth. B) 250 yards of cloth.
C) 600 yards of cloth. D) 800 yards of cloth.
6) If an economy is operating at a point inside the production possibilities curve, then
A) society s resources are being inefficiently utilized.
B) the curve will move to the left.
C) society s resources are being used to produce too many consumer goods.
D) economic policy must implemented to slow growth of the economy further.
7) A country operates inside its production possibilities curve; this may be caused by
A) unemployed resources.
B) total efficiency in industry.
C) a new resource being discovered.
D) a lack of modern products being produced.
8) The production possibilities curve bows out because
A) production is efficient. B) of the law of increasing additional cost.
C) production is inefficient. D) resources are not being fully utilized.
9) When deriving the production possibilities curve, it is assumed that
A) the amount of each good that is to be produced is fixed.
B) the prices of resources are fixed along the curve.
C) most resources can be used to produce only one good.
D) resources are efficiently used.
10) All points inside the production possibilities curve indicate
A) a lack of sufficient supply. B) inefficiency in production.
C) the law of increasing relative cost. D) the law of decreasing relative cost.
11) Refer to the above figure. If the farmer is growing 8,000 bushels of beans and 8,000 bushels of
wheat, then we know that
A) the farmer is not using resources efficiently.
B) the farmer is using more land for wheat than for beans.
C) the farmer should increase the amount of wheat grown and reduce the amount of beans.
D) the farmer cannot be using the amount of land that was used to construct the curve.
12) Refer to the above figure. If the farmer is producing 4,000 bushels of beans and 38,000 bushels of
wheat, then we know the farmer
A) is using resources efficiently.
B) is producing too much wheat.
C) is inefficient because point a is the most efficient point on the curve.
D) must be using more resources than were assumed available in constructing the graph.
13) How does an economy represented by a straight line production possibilities curve differ from
one represented by a traditional production possibilities curve with a bowed shape?
A) In the economy represented by a straight line production possibilities curve, there is no
opportunity cost.
B) In the economy represented by a straight line production possibilities curve, neither good
is scarce.
C) In the economy represented by a straight line production possibilities curve, the law of
increasing relative cost does not apply.
D) In the economy represented by a straight line production possibilities curve, changing the
amount of resources devoted to the production of each good will not alter the amount of
each good actually produced.
14) Look at the following production possibilities table for drill presses and corn. The table shows
the maximum combination of drill presses and bushels of corn that can be produced, when all
resources are fully employed.
Production Possibilities
Good A B C D E
Drill Presses 10 20 30 40 50
Corn (bushels) 150 140 120 90 50
Based on the above information,
A) there is a constant trade off between corn and drill presses.
B) the opportunity cost of producing 30 instead of 20 drill presses is 120 bushels of corn.
C) the opportunity cost of producing 40 instead of 30 drill presses is 30 bushels of corn.
D) the production possibilities curve for drill presses and corn will be a straight line.
15) A bowed Production Possibilities Curve (PPC) indicates
A) inefficient production.
B) that the trade off between the 2 goods is not constant.
C) changing technology.
D) only 1 good is always being produced.
16) A production point that lies outside the Production Possibilities Curve (PPC)
A) denotes inefficiency.
B) indicates unemployment.
C) is currently not attainable.
D) can never be reached, even in future periods.
17) Which of the following will most likely happen when better technology is used in production?
A) an upward movement along the production possibilities curve
B) an outward shift of the production possibilities curve
C) an inward shift of the production possibilities curve
D) a downward movement along the production possibilities curve
18) One of the assumptions underlying the production possibilities curve is that
A) at least one of the factors of production is a free good.
B) the quantity of the resources available for the production of economic goods is fixed over a
given time period.
C) there is at least one factor of production that is employed inefficiently.
D) some of the factors of production are not being used.
19) Which of the following statements is NOT an assumption underlying the production
possibilities curve?
A) Resources are fully and efficiently employed.
B) Technology is fixed.
C) Production occurs over some specified time period.
D) The amount of resources available for production can be changed quickly.
20) A production possibilities curve with quantities of clothing and food on the axes shows which of
the following?
I. A society cannot have an unlimited amount of each good.
II. For an efficient society, an increase in clothing production will necessitate a decrease in food
production.
III. A society will always produce the maximum amount of both clothing and food.
A) I only B) II only C) III only D) Both I and II
21) It is correct to state that a society which is on its production possibilities curve is
A) underutilizing is resources. B) technologically inefficient.
C) consuming too much output. D) fully utilizing its productive resources.
22) Technology is best defined as
A) society s pool of applied knowledge concerning the production of goods and services.
B) the maximum output that can be obtained from a stock of physical capital.
C) output inside the production possibilities curve.
D) the utilization of more resources for the same amount of production.
23) A technological improvement can cause the production possibilities curve to shift outward
because
A) it increases costs and contributes to lower production rates.
B) maximum feasible outputs of both goods increase.
C) production will fall, but jobs will be saved.
D) it causes increases in unemployment.
24) Suppose the current unemployment rate is 15 percent. If it rises to 20 percent,
A) the economy will move up along the production possibilities curve.
B) the economy will move closer to the production possibilities curve.
C) the production possibilities curve will shift inward.
D) the economy will operate farther inside the production possibilities curve.
25) Which of the following would cause an economy to produce at a point inside its production
possibilities curve?
A) The efficient allocation of all factors of production
B) Population growth
C) Unemployment and an inefficient use of available resources
D) Capital accumulation
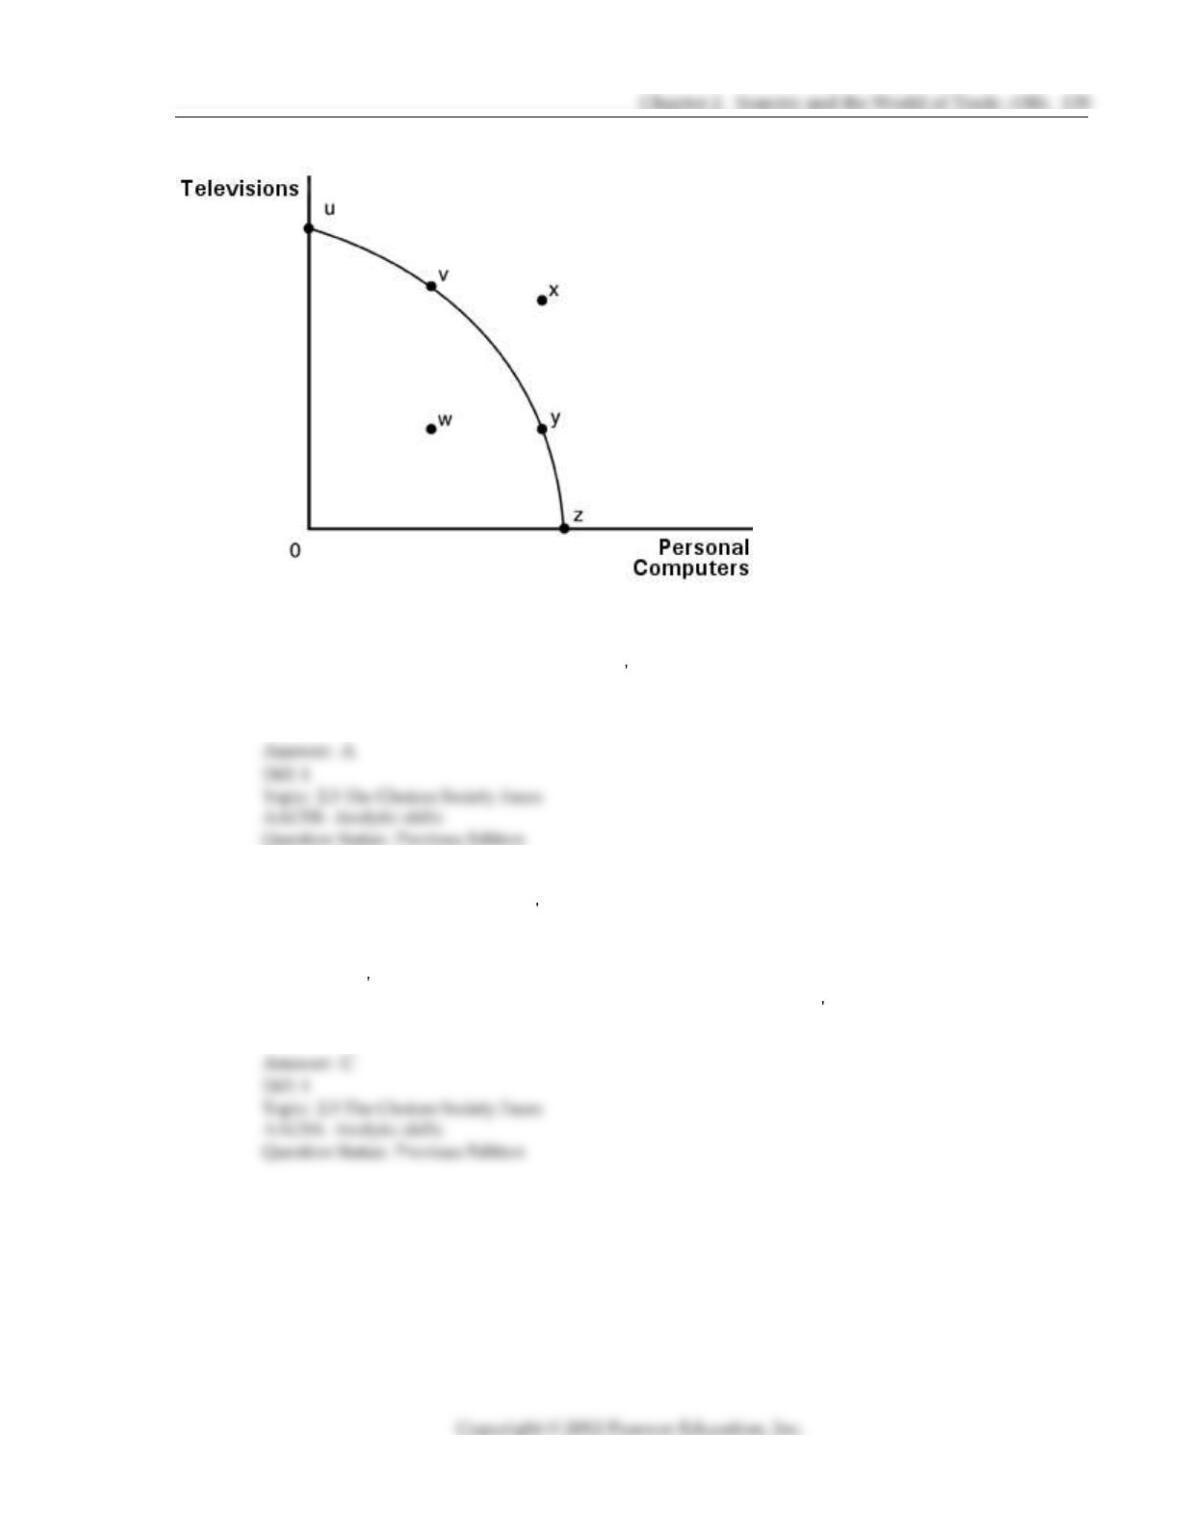
26) In the above figure, the combination of computers and televisions shown by point x
A) is not attainable at the point in time for which the graph is drawn.
B) can be attained only if some of society s resources are unemployed.
C) suggests that the law of increasing relative costs does not hold.
D) results only because society allocates its resources inefficiently.
27) In the above figure, the combination of personal computers and televisions shown by point w
A) is an efficient use of society s resources because it is below the production possibilities
curve.
B) is more desirable than point x because producing at point w does not put a strain on
society s resources.
C) is attainable but involves the inefficient use of some of society s resources.
D) is beyond the capacity of society to produce.
28) In the above figure, points u, v, y, and z show
A) an inefficient allocation of society s scarce resources.
B) possible combinations of televisions and personal computers.
C) a constant trade off between televisions and personal computers.
D) that society prefers more televisions than computers.
29) The president of the United States promises that the nation s economy will simultaneously
produce more defense goods without any decreases in the production of other goods. Under
which of the following conditions could such a promise be valid?
A) If the United States were producing at a point on its production possibilities curve
B) If the United States were producing inside its production possibilities curve
C) If the United States were producing to the right of its production possibilities curve
D) None of the above; the production possibilities curve must shift to the right.
30) A point outside a society s production possibilities curve is one that is
A) unattainable given the resources of the society.
B) technologically inefficient.
C) undesirable given the implied underemployment of resources.
D) desirable since it satisfies the desires of the population.
31) A point inside a society s production possibilities curve represents
A) an unattainable combination of outputs.
B) an output combination that satisfies the needs of the population.
C) an underutilization of productive resources.
D) a technically superior output combination.
32) A point outside a production possibilities curve indicates
A) that resources are not being used efficiently.
B) an output combination that society cannot attain given its current level of resources and
technology.
C) that resources are being used very efficiently.
D) that both goods are characterized by increasing costs.
33) Efficiency can correctly be defined as
A) producing outside the production possibilities boundary.
B) minimizing opportunity cost.
C) producing the maximum output with given technology and resources.
D) providing for the immediate needs of the greatest proportion of the population.
34) When an economy is operating efficiently, which is true?
A) All resources are fully employed.
B) It would be possible to increase the output of 1 good without decreasing the output of the
other.
C) Resources are not fully employed or current technology is not being fully utilized.
D) This economy is operating to the right of its production possibilities curve (PPC).
35) Typically, the greater the specialization of resources,
A) the less production that takes place.
B) the greater the bow of the production possibilities curve.
C) the poorer the country becomes.
D) the greater the unemployment in the country.
36) The production possibilities curve bows outward because
A) opportunity costs are decreasing as the production of a good increases.
B) opportunity costs are increasing as the production of a good increases.
C) opportunity costs are fixed as the production of a good increases.
D) resources are of uniform quality.
Possibility
Good A B C D E F G
Televisions 21 20 18 15 11 6 0
Personal computers 0 1 2 3 4 5 6
37) When the economy moves from point D to E in the above table, the opportunity cost of a
computer in terms of televisions is
A) 3. B) 4. C) 2. D) 5.
38) According to the above table, the opportunity cost of each additional computer in terms of
televisions
A) remains constant.
B) falls as more computers are produced.
C) increases as more computers are produced.
D) is meaningless because the cost of computers cannot be expressed in terms of televisions.
39) Given the production possibilities schedule in the above table, a combination of 9 televisions
and 4 personal computers
A) is attainable but involves an inefficient use of society s resources.
B) would be attainable only if a new technology of producing televisions or computers were
introduced.
C) is not attainable because it is not listed in the schedule.
D) is not attainable because society does not have enough resources to produce this
combination.
40) Given the production possibilities schedule in the above table, a combination of 23 televisions
and 6 personal computers
A) is attainable but involves the unemployment of some of society s resources.
B) clearly illustrates the trade off between televisions and computers.
C) cannot be produced by society, given its current level of resources and production
technology.
D) can be produced only if society is willing to have some of its resources used inefficiently.
41) A bowed production possibilities curve is consistent with
A) an unchanged opportunity cost.
B) a technologically inefficient society.
C) the underutilization of productive resources.
D) highly specialized resources.
42) A bowed outward production possibilities curve occurs when
A) opportunity costs are constant.
B) resources are not scarce.
C) additional units of output of one good necessitate greater reductions in the other good.
D) there are shortages in the goods being produced.
43) The law of increasing additional costs is due to
A) taxes.
B) scarcity.
C) the fact that it is more difficult to use resources efficiently the more society produces.
D) the fact that resources are not perfectly adaptable for alternative uses.
44) The law of increasing opportunity cost implies that
A) producing additional units of one good results in proportionately smaller reductions in
output of the other good.
B) producing additional units of one good results in increasing amounts of lost output of the
other good.
C) the production possibilities curve will be a straight line.
D) the society will be producing on its production possibilities curve.
45) Which of the following is NOT an assumption used in deriving a production possibilities curve?
A) The labor force is growing at a constant rate.
B) Resources are fully employed.
C) Technology is constant.
D) The quantity of resources is constant.
46) When determining the production possibilities curve
A) the trade off between the goods in the economy remains constant.
B) the amount of productive resources remains constant.
C) the prices of the goods are used.
D) the prices of resources are used.
47) Which of the following is an assumption used in deriving a production possibilities curve?
A) Poverty always exists in society.
B) The wages in an industry increase constantly.
C) Prices will continue to increase.
D) The amount of resources is fixed.
48) All of society s applied knowledge on how to produce goods and services is
A) held by university professors. B) called technology.
C) opportunity cost. D) efficiency.
49) Economists define technology as
A) machines such as computers.
B) entrepreneurship.
C) absolute advantage.
D) society s knowledge concerning the production of goods.
50) A point outside a production possibilities curve indicates
A) that resources are not being used efficiently.
B) that resources are being used very efficiently.
C) opportunity costs are constant.
D) an output combination that is unobtainable with the current resource and technology
levels.