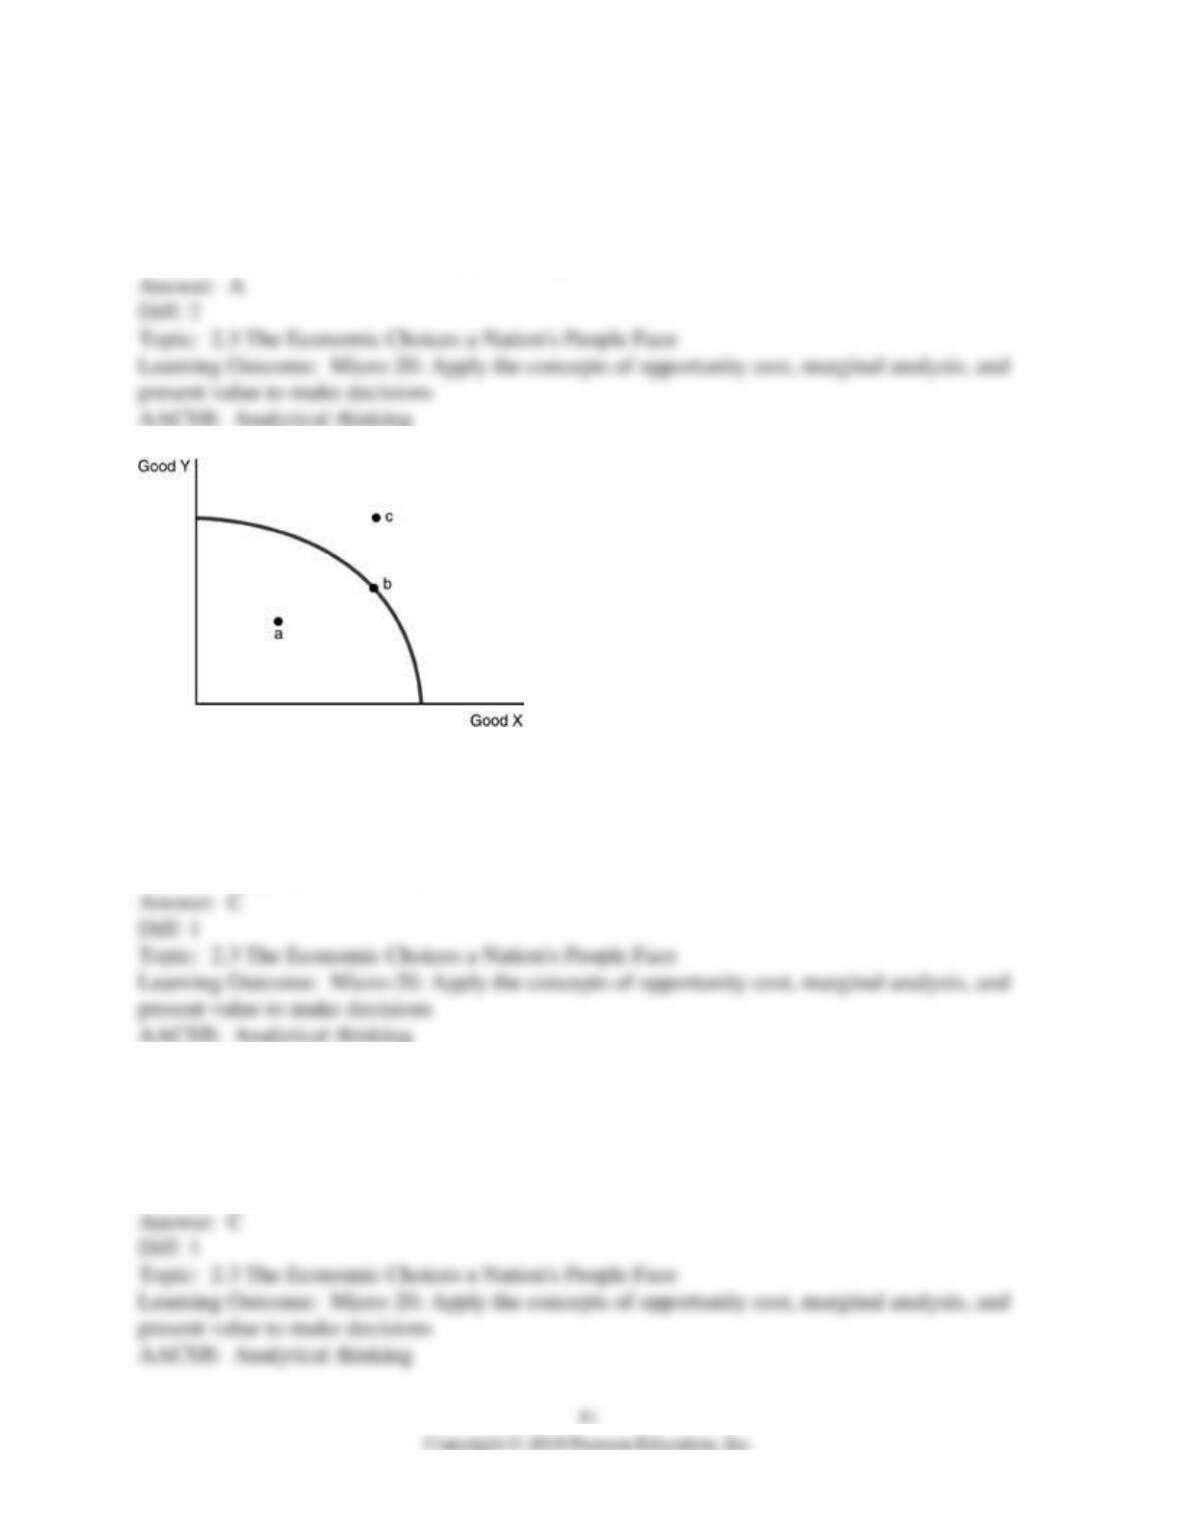
53) An efficient point of production is
A) a point on the production possibilities curve.
B) a point inside the production possibilities curve.
C) the point where scarcity no longer exists.
D) the point where we are currently producing.
54) Refer to the above figure. Which of the following statements is TRUE?
A) Point a is efficient, Point b is efficient, point c is inefficient.
B) Point a is unobtainable, point b is efficient and point c is inefficient.
C) Point a is inefficient, point b is efficient and point c is unobtainable.
D) All of the points are efficient.
55) Refer to the above figure. Point c is
A) efficient.
B) where economists always want a nation or company to achieve.
C) unobtainable.
D) inefficient but obtainable.
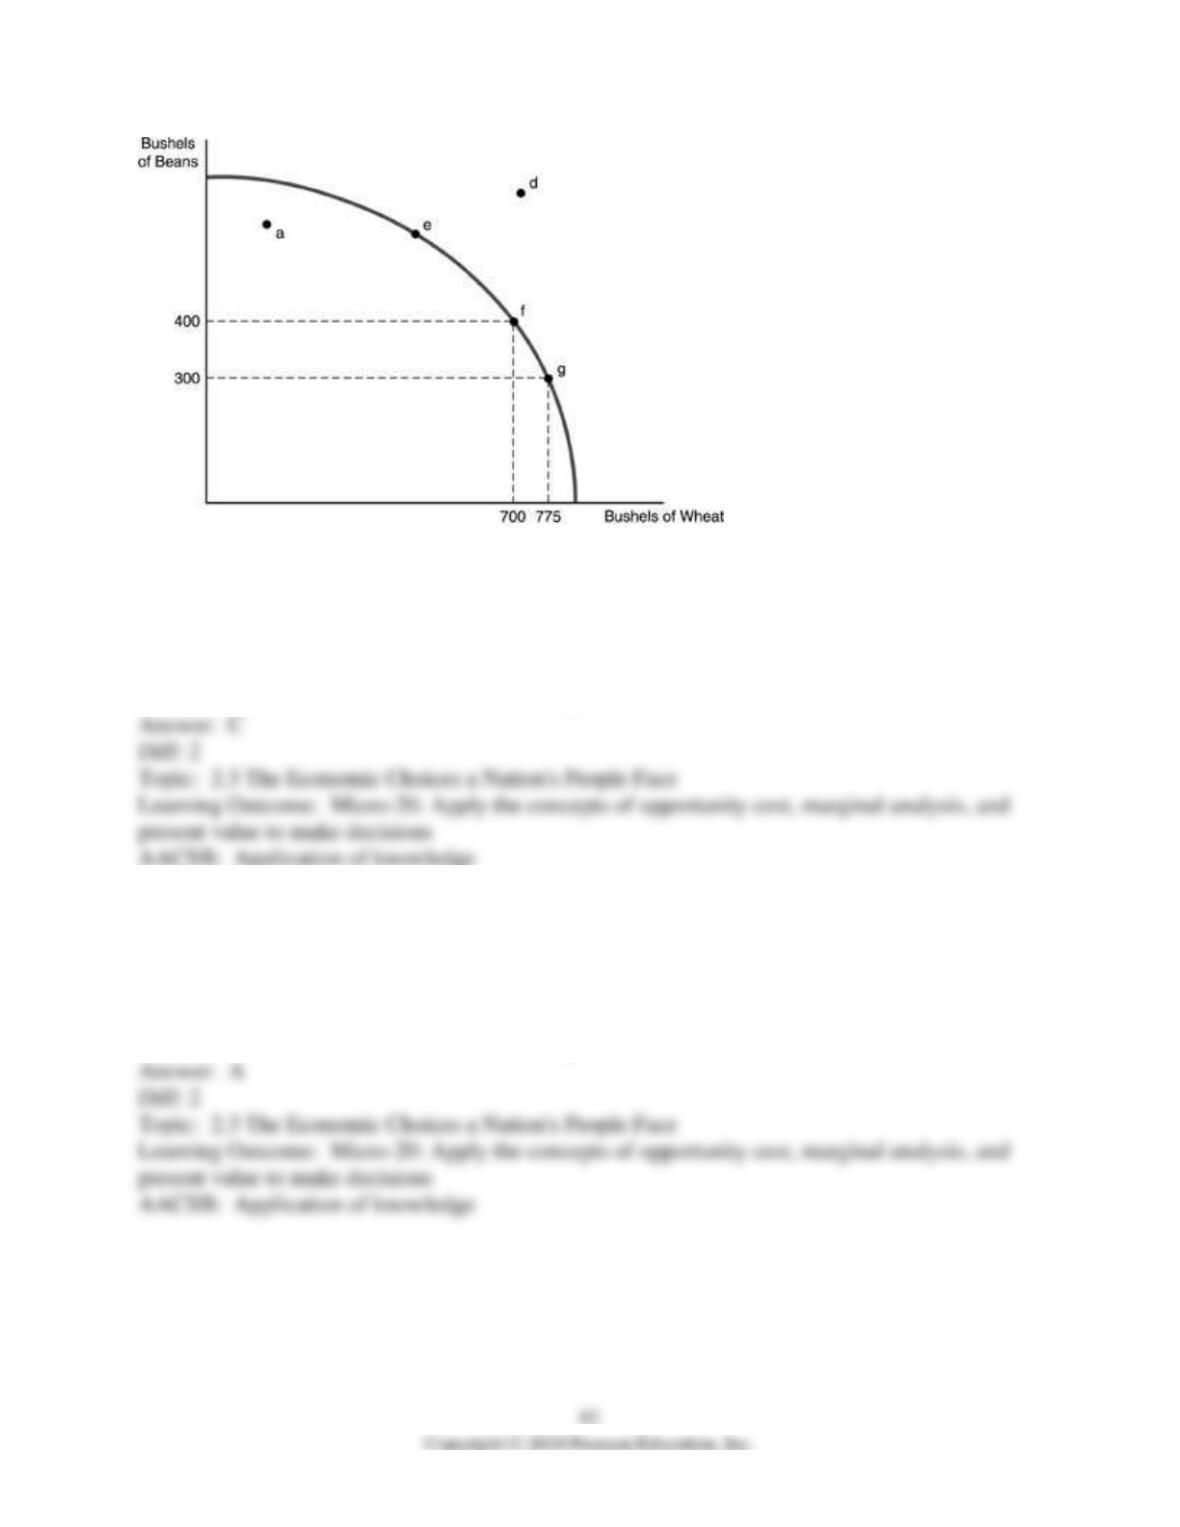
56) Refer to the above figure. Which of the following points indicates an efficient use of
resources?
A) a
B) d
C) e
D) More information is needed to answer the question.
57) Refer to the above figure. Which of the following points indicates an inefficient use of
resources?
A) a
B) d
C) e
D) More information is needed to answer the question.
58) Refer to the above figure. Which of the following points indicates an unobtainable point of
production?
A) a
B) d
C) e
D) More information is needed to answer the question.
59) Refer to the above figure. The shape of the production possibility curve indicates that
production of
A) wheat is characterized by increasing costs while the production of beans is characterized by
decreasing costs.
B) wheat is characterized by decreasing costs while the production of beans is characterized by
increasing costs.
C) both goods are characterized by increasing costs.
D) both goods are characterized by decreasing costs.
60) Refer to the above figure. Between points f and g, the opportunity cost of producing 75 more
bushels of wheat is
A) 1 bushel of beans.
B) 4 bushels of beans.
C) 25 bushels of beans.
D) 100 bushels of beans.
84
61) Production is efficient when
A) it generates a point beyond the production possibility curve.
B) the economy cannot produce more of one good without giving up the production of another
good.
C) technological change occurs.
D) the maximum amounts of the most important good are produced.
62) Whenever the economy is producing the maximum amount of goods given the level of
technology and the amount of resources
A) the number of resources used should be decreased since society must protect its scarce
resources.
B) the concept of opportunity costs does not exist.
C) more goods will be available than customers want to buy.
D) the economy is producing efficiently.
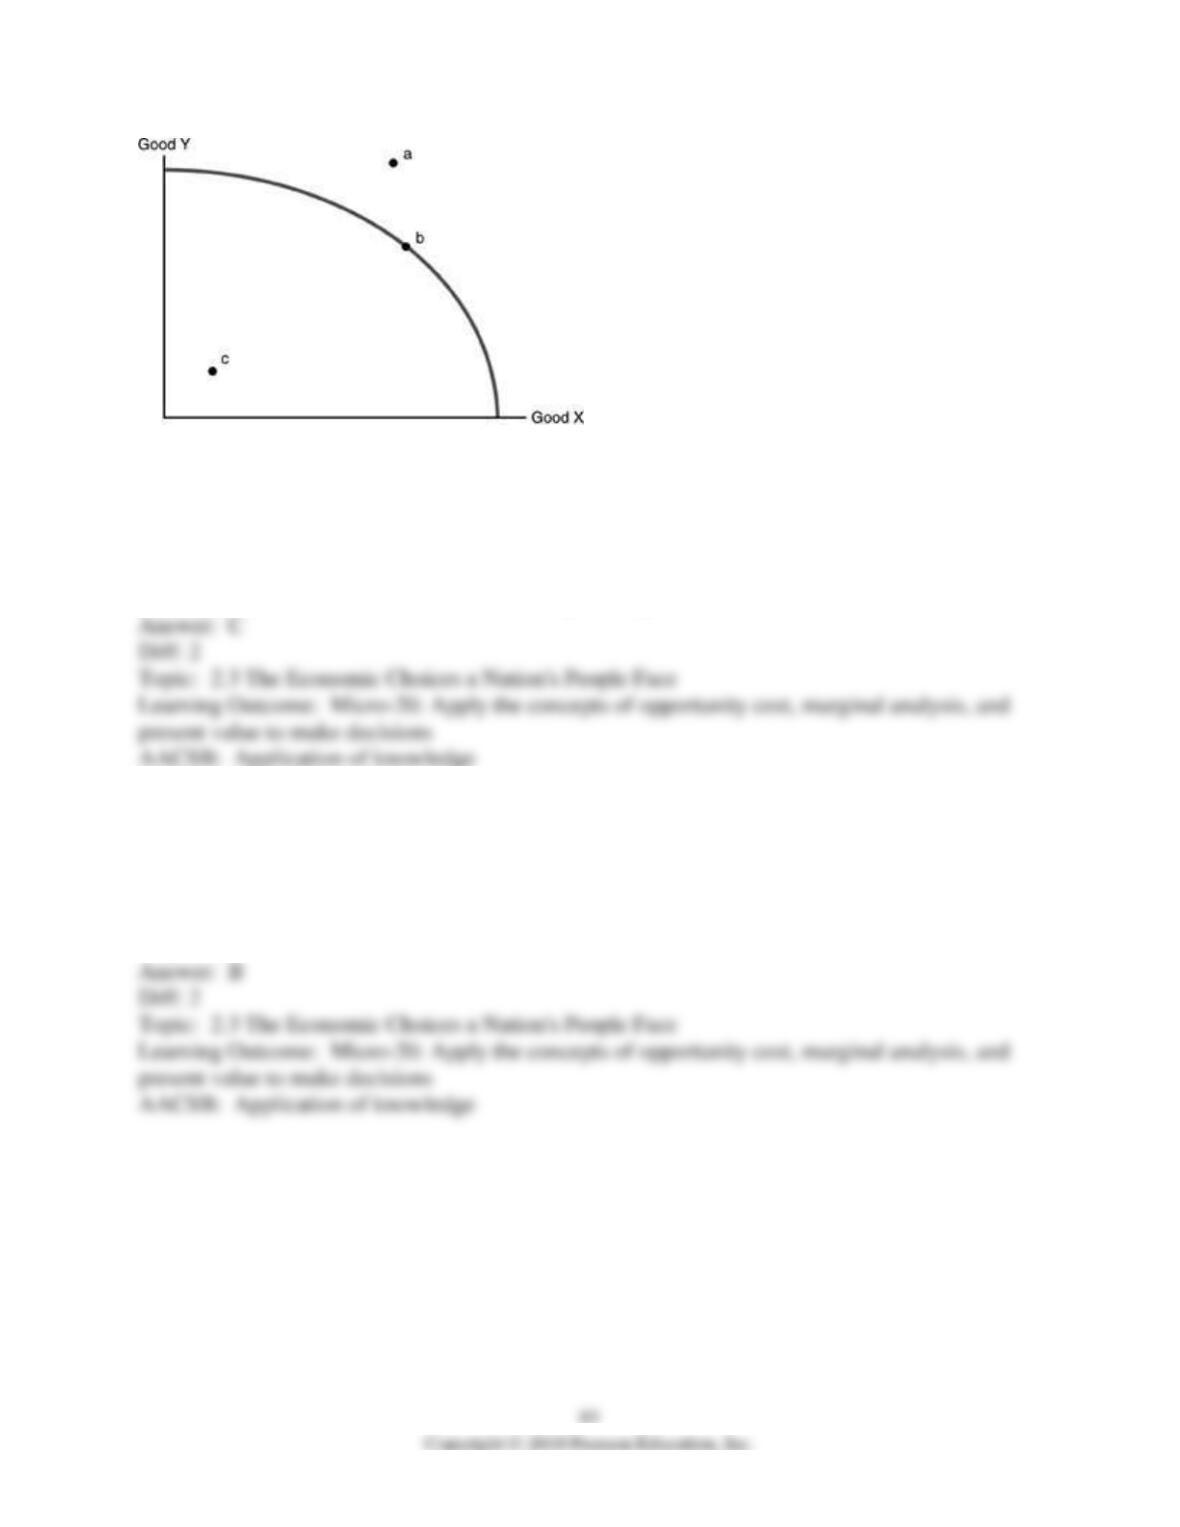
63) Refer to the above figure. Assume that only two goods can be produced in the economy.
Which of the following statements is TRUE?
A) Points a, b, and c are all obtainable points of production.
B) Points a and b are obtainable points of production.
C) Points b and c are obtainable and efficient points of production.
D) Only point b is an obtainable and efficient point of production.
64) Refer to the above figure. Given our current level of technology and resources, the
unobtainable point(s) of production would be
A) points a and c.
B) point a.
C) point b.
D) point c.
65) Refer to the above figure. We are currently producing at point c. Which of the following
statements is TRUE?
A) Resources are not being efficiently utilized.
B) Resources are being efficiently utilized.
C) The only way to produce more of Goods X or Y is to have an increase in the amount of
resources.
D) The Law of Increasing Additional Cost does not hold.
66) All mutually beneficial trades have taken place. This implies that
A) the production possibilities curve is bowed out.
B) society is inside the production possibilities curve.
C) economic efficiency prevails in the society.
D) society is on the constant cost portion of its production possibilities curve.
67) Technology is
A) society’s pool of knowledge of how to produce goods and services.
B) a resource like land or physical capital.
C) computers and lasers.
D) not obtainable by engaging in activities that increase human capital.
68) The law of increasing additional cost occurs when
A) there are always shortages in some goods.
B) technology is not used.
C) resources are not perfectly adaptable for alternative uses.
D) there are always alternatives and it is costly to figure out which alternative is best.
69) The reason the production possibilities curve is bowed outward (concave) is
A) the law of increasing additional cost.
B) that technology is constantly changing.
C) that the number of resources is increasing.
D) that the economy has more capital goods than entrepreneurial effort.
70) Some resources are better suited to produce certain goods than other resources. This fact
leads to
A) a linear production possibilities curve.
B) inefficiency in the economy.
C) the law of increasing additional cost.
D) increases in technology.
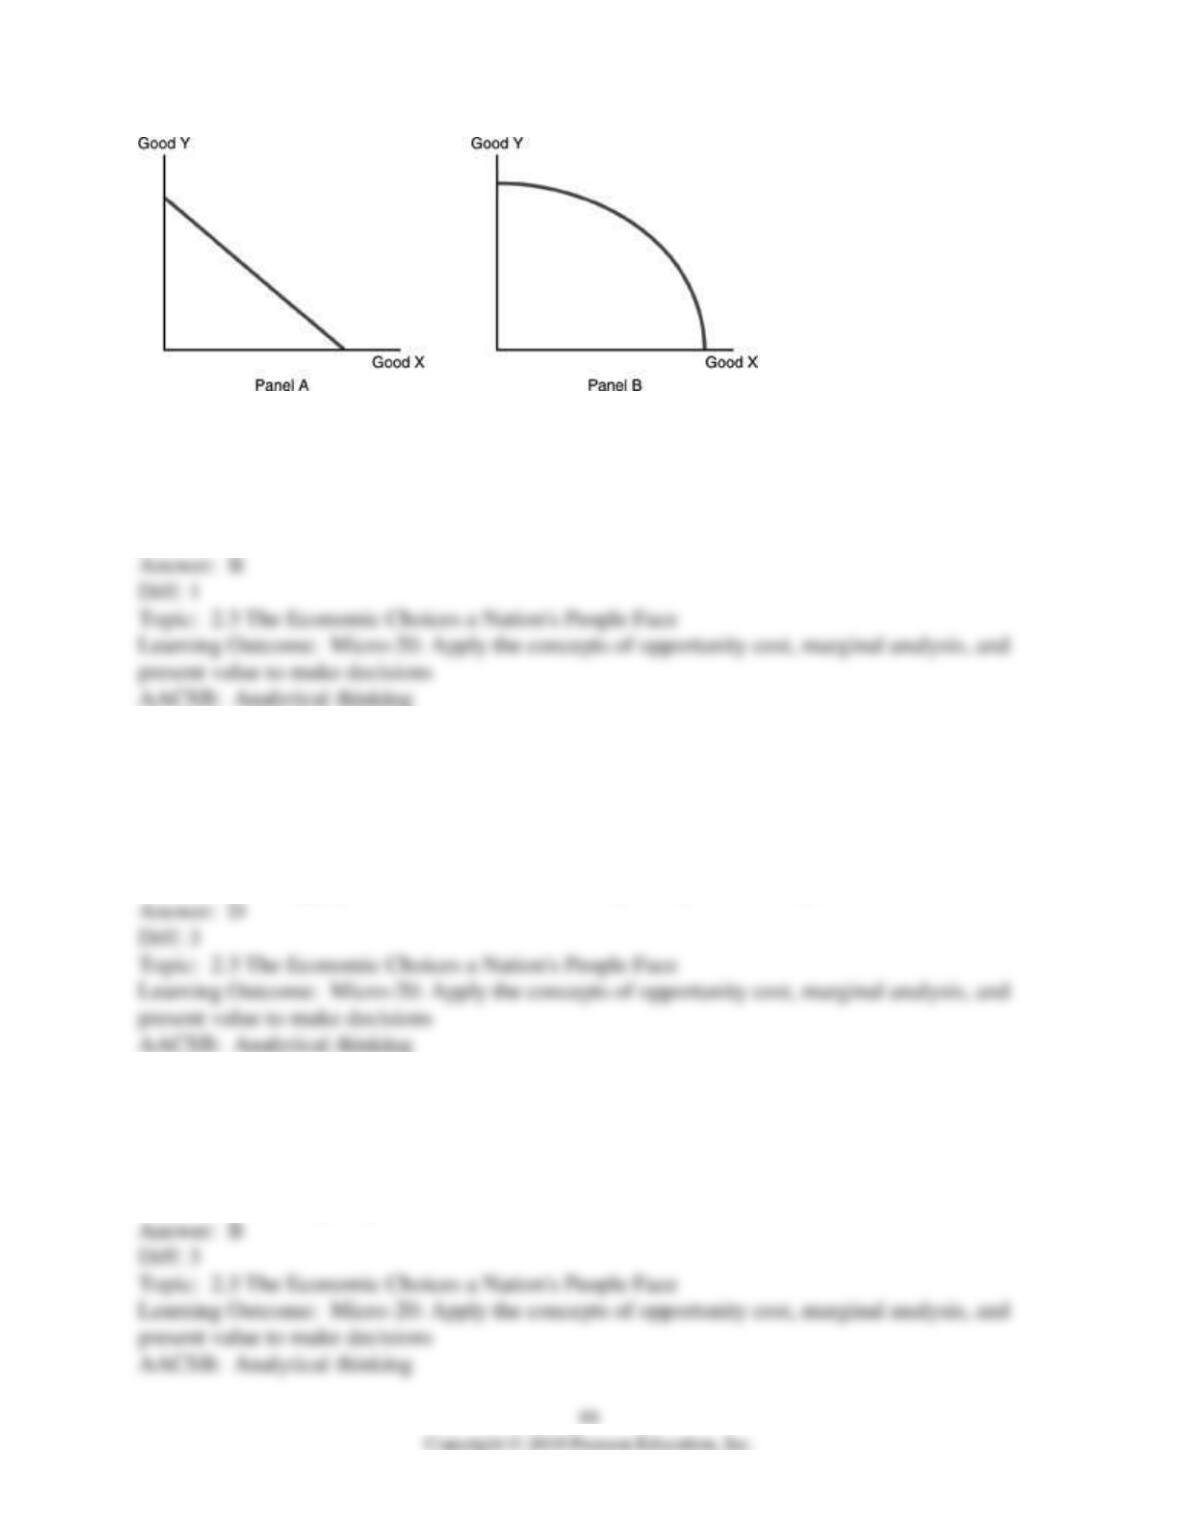
71) Refer to the above figure. The Law of Increasing Additional Costs applies in
A) Panel A only.
B) Panel B only.
C) Panels A and B.
D) neither Panel A nor B.
72) Refer to the above figure. Which of the following statements is TRUE?
A) Panel A does not represent an economy that is producing efficiently while Panel B does.
B) Panel A represents an economy that has a lower level of technology than Panel B.
C) Opportunity costs do not apply to Panel A but apply to Panel B.
D) In Panel A, equal amounts of Y must be given up to obtain equal increments of X while in
Panel B increasingly greater amounts of Y must be given up to obtain equal increments of X.
73) The bowed shape of the traditional production possibilities curve reflects the
A) negative side effects of economic growth.
B) fact that not all resources are equally well-suited to producing all goods.
C) costs of unemployment.
D) problems of inequality.
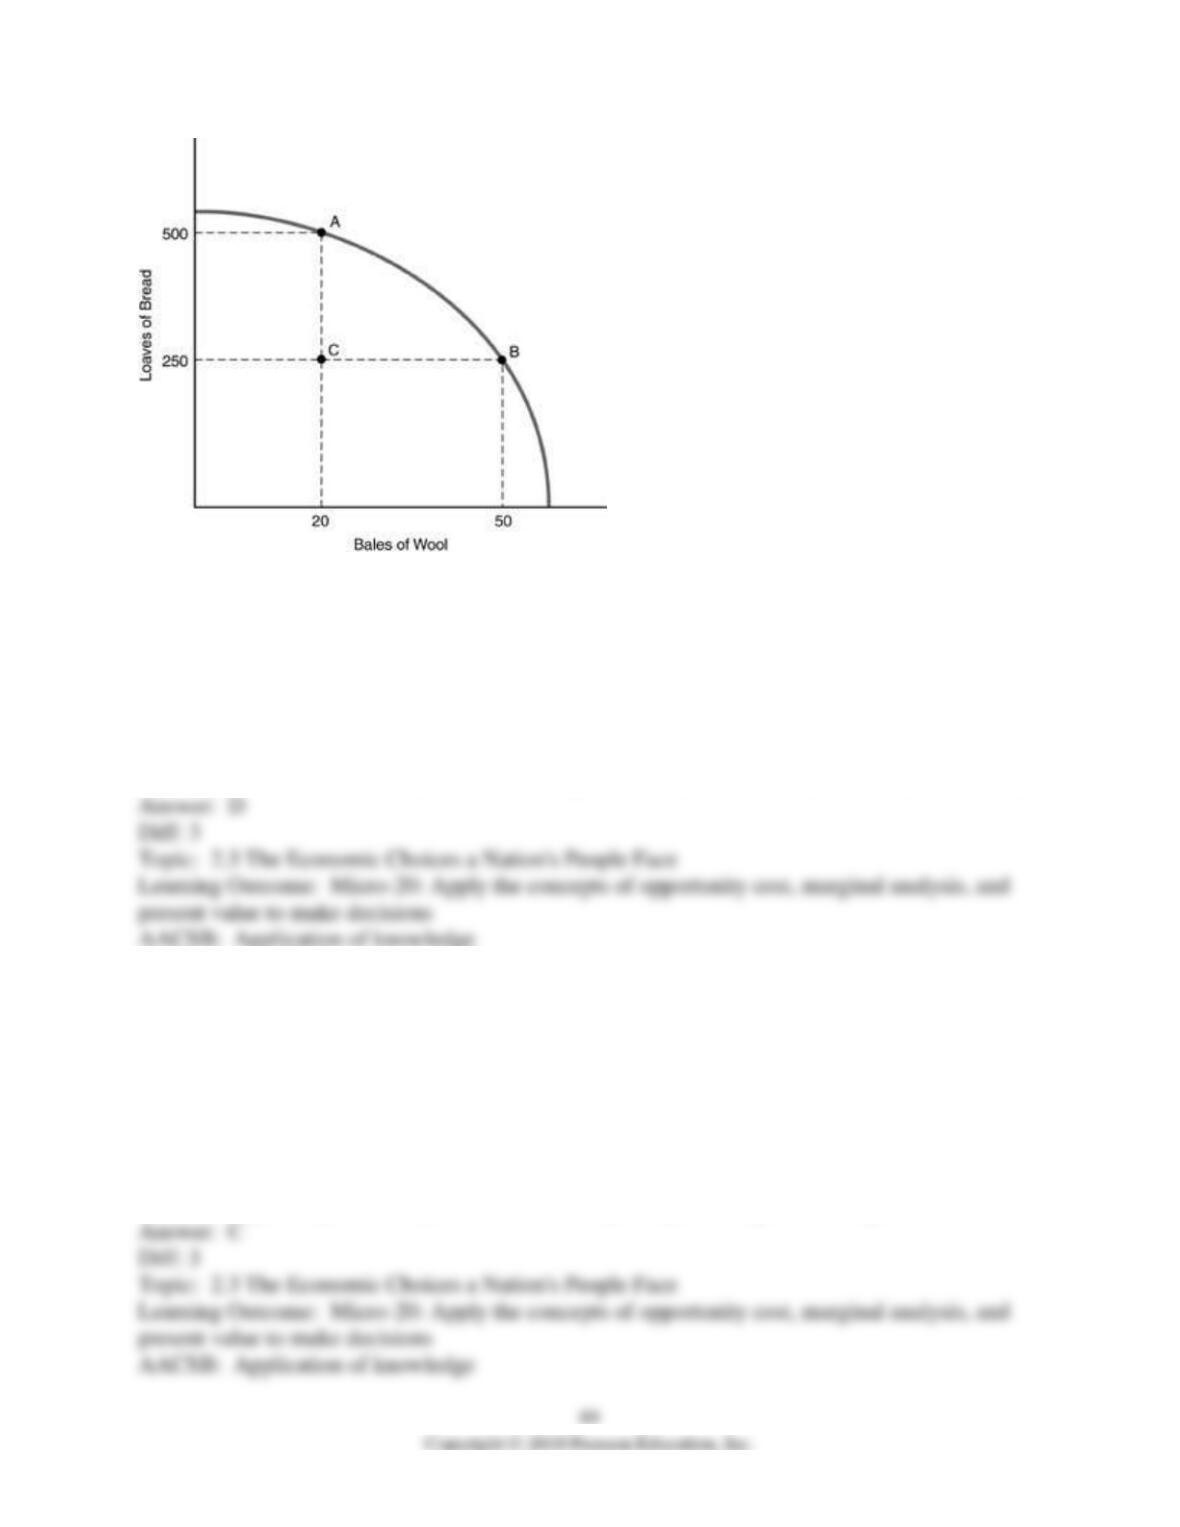
74) Refer to the above figure. Which one of the following statements is TRUE with regard to the
economy depicted in the graph?
A) Point C cannot be produced.
B) The best production point is 500 loaves of bread and 50 bales of wool.
C) The total amount of resources it takes to produce 20 bales of wool and 500 loaves of bread is
more than the amount of resources needed to produce 50 bales of wool and 250 loaves of bread.
D) The total amount of resources it takes to produce 20 bales of wool and 500 loaves of bread is
the same as the amount of resources needed to produce 50 bales of wool and 250 loaves of bread.
75) Refer to the above figure. Which one of the following statements is TRUE with regard to the
economy depicted in the graph?
A) Starting from point A, this economy does not incur any opportunity cost in producing more
bread.
B) Starting from point A, this economy does not incur any opportunity cost in producing more
wool.
C) In moving from point A to point B, the economy produces 30 additional bales of wool at an
opportunity cost of 250 loaves of bread.
D) In moving from point A to point B, the economy is experiencing economic growth.
76) Refer to the above figure. How do you describe what is happening as the economy moves
from point C to point B?
A) Previously unemployed resources are now being devoted to the production of wool.
B) Previously unemployed resources are now being devoted to the production of bread.
C) The economy has increased its wool production by 30 bales at an opportunity cost of 250
loaves of bread.
D) The economy has acquired new resources for making bread.
77) Refer to the above figure. How do you describe what is happening as the economy moves
from point A to point B?
A) The economy has acquired new resources that are well suited for producing wool.
B) Land that was once used to grow wheat is now being used to graze sheep.
C) The economy is producing more bread by choosing to produce less wool.
D) The technology for growing wheat has improved.
78) Refer to the above figure. How do you describe what is happening as the economy moves
from point A to point C?
A) The economy has acquired new resources that are well suited for producing bread.
B) Land that was once used to graze sheep is now being used to grow wheat.
C) Resources are becoming unemployed.
D) The technology for growing wheat has improved.
79) During periods of unemployment
A) the economy operates at a point inside the production possibilities curve.
B) the economy operates at a point outside the production possibilities curve.
C) the production possibilities curve shifts inward.
D) the production possibilities curve shifts outward.
80) As an economy moves from point to point along its production possibilities curve, which one
of the following variables changes?
A) the total amount of resources employed
B) the level of technology
C) the level of efficiency of some factors of production
D) the amount of each good or service produced
81) Technology
A) is constantly changing at every point along a production possibilities curve.
B) is the recipe for combining land, labor, physical capital, and entrepreneurship to produce a
good.
C) does not have an effect on the amount of a good a society can produce with its given
resources.
D) only changes if resources change.
82) Which of the following is assumed when constructing a production possibilities curve?
A) a fixed amount of resources
B) the efficient use of resources
C) resources of a given quality
D) All of the above are correct.
83) Which of the following is held constant when constructing a production possibilities curve?
A) the price level
B) the amount of total resources used
C) combination of goods produced
D) all of the above
84) In constructing a production possibilities curve, all of the following are assumed EXCEPT
A) resources are fully employed.
B) the quantity and quality of resources being used is fixed.
C) the state of technology is improving.
D) the time period involved is fixed.
85) Inefficient use of resources is shown on the production possibilities curve
A) by an inward shifting of the curve.
B) by a point inside the curve.
C) by a point near the top of the curve.
D) by a point outside the curve.
93
86) A bowed-outward production possibilities curve demonstrates the concept of
A) constant opportunity costs as production shifts from the production of one good to the
production of the other good.
B) decreasing opportunity costs as production shifts from the production of one good to the
production of the other good.
C) increasing opportunity costs as production shifts from the production of one good to the
production of the other good.
D) increasing opportunity costs at first but the opportunity costs steadily decrease as you move
down along the curve.
87) The production possibilities curve for two products is bowed out because
A) as the production of a good increases, opportunity cost increases.
B) as the production of a good increases, opportunity cost is unchanged.
C) the qualities of the resources are not identical.
D) there are unemployed resources.
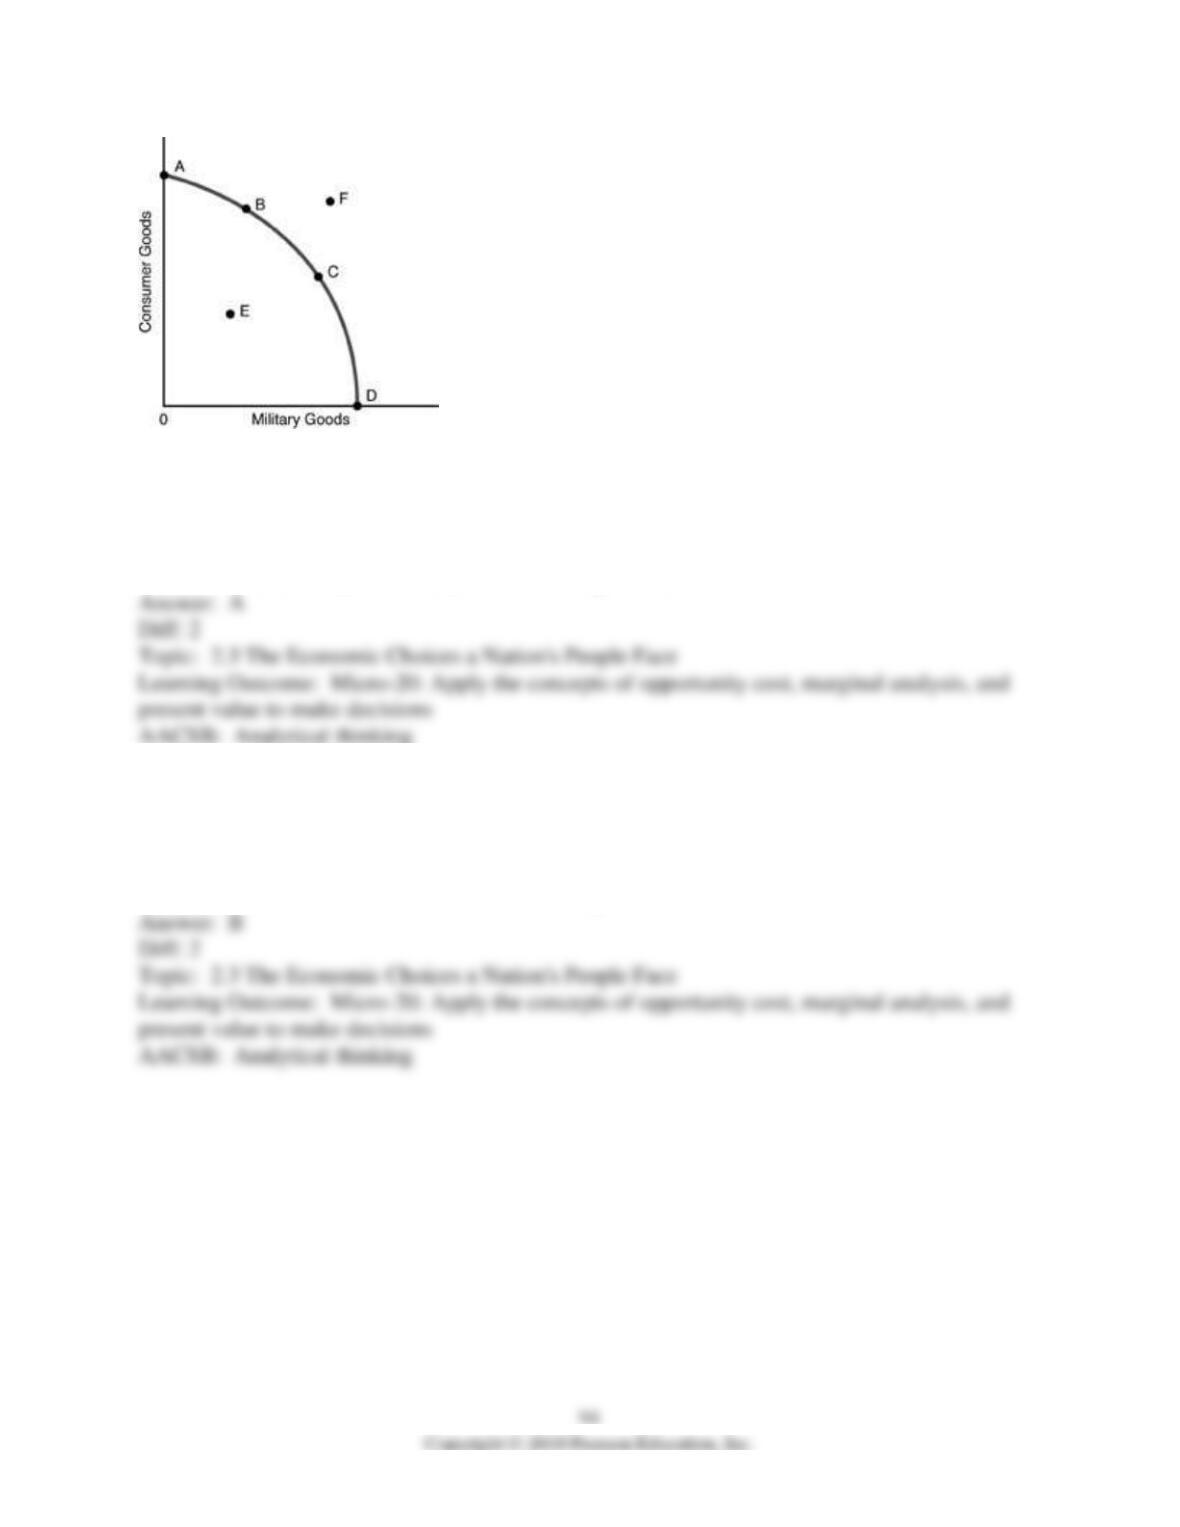
88) Refer to the above figure. Production at Point F
A) is not attainable given the underlying assumptions of the production possibilities curve (PPC).
B) would not be desirable.
C) can only be attained by giving up Point E.
D) can be attained only if a society desired more goods and services.
89) Refer to the above figure. Production at Point E
A) would indicate that this economy is producing beyond its capabilities.
B) would indicate production at a level below that which is attainable.
C) is not attainable with given resources and technology.
D) would demonstrate a total lack of technical expertise.
95
90) When a society takes increasing amounts of resources and applies them to the production of
a specific good, resulting in increasing opportunity costs for each additional unit produced,
which of the following applies?
A) the law of demand
B) the law of supply
C) the law of scarcity
D) the law of increasing additional costs
91) Efficiency is achieved
A) when output is being produced at a point inside a production possibilities curve.
B) when producers are getting the maximum possible output from the available resources.
C) when consumers are able to buy everything that they want.
D) when prices of all goods and services go to zero.
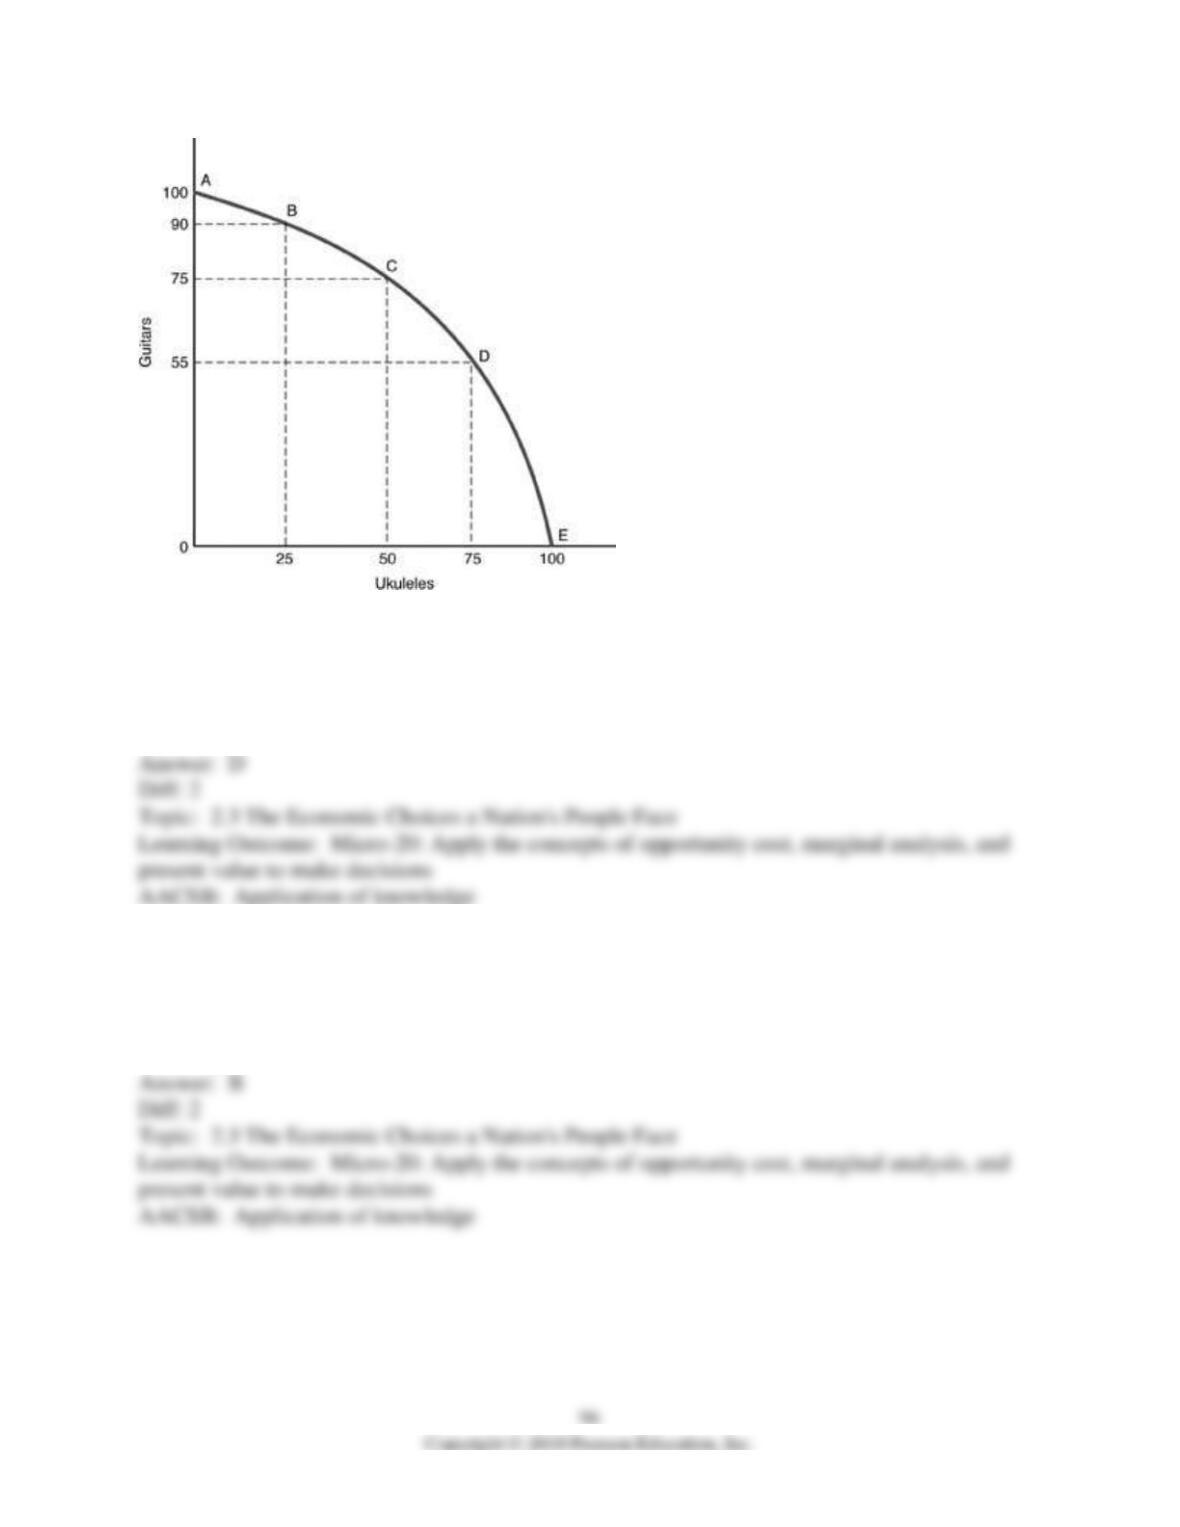
92) In the above figure, the opportunity cost of moving from point D to point C is
A) 20 guitars.
B) 50 ukuleles.
C) 55 guitars.
D) 25 ukuleles.
93) In the above figure, the opportunity cost of moving from point D to point E is
A) 75 guitars.
B) 55 guitars.
C) 100 ukuleles.
D) 100 guitars.
94) In the above figure, the opportunity cost of moving from point A to point C is
A) 50 guitars.
B) 0 guitars.
C) 25 guitars.
D) 50 ukuleles.
95) In the above figure, the production of 75 ukuleles and 75 guitars is
A) efficient production.
B) inefficient production.
C) impossible production.
D) full employment production.
96) In the above figure, the production of 25 guitars and 25 ukuleles is
A) efficient production.
B) inefficient production.
C) impossible production.
D) not possible since production always occurs along the PPC.
97) In the above figure, as more ukuleles are produced, the opportunity cost in terms of guitars is
A) decreasing.
B) increasing.
C) constant.
D) zero.
98) An outward bowed production possibilities curve illustrates
A) inefficient production.
B) the law of increasing additional cost.
C) a lack of scarcity.
D) zero opportunity cost of moving from inefficient production to currently unobtainable
production.
99) All of the following are assumptions of the production possibilities curve EXCEPT
A) resources are fully employed.
B) there is a fixed time period.
C) there is a fixed level of technology.
D) there is a fixed demand for the products.
100) Why is efficiency desirable?
A) It results in an equal distribution of income.
B) It results in the highest prices for the goods and services produced.
C) It makes best use of the available resources.
D) It is the most politically popular solution.
99
101) The law of increasing additional cost exists because
A) resources are not perfectly adaptable to both production processes.
B) the demand for the product increases.
C) the cost of resources of the products increase.
D) the cost of resources of the products decrease.
102) Efficiency is defined as
A) the maximum consumption of goods.
B) the production of goods and services.
C) the production of output at minimum cost.
D) the most profits for companies.
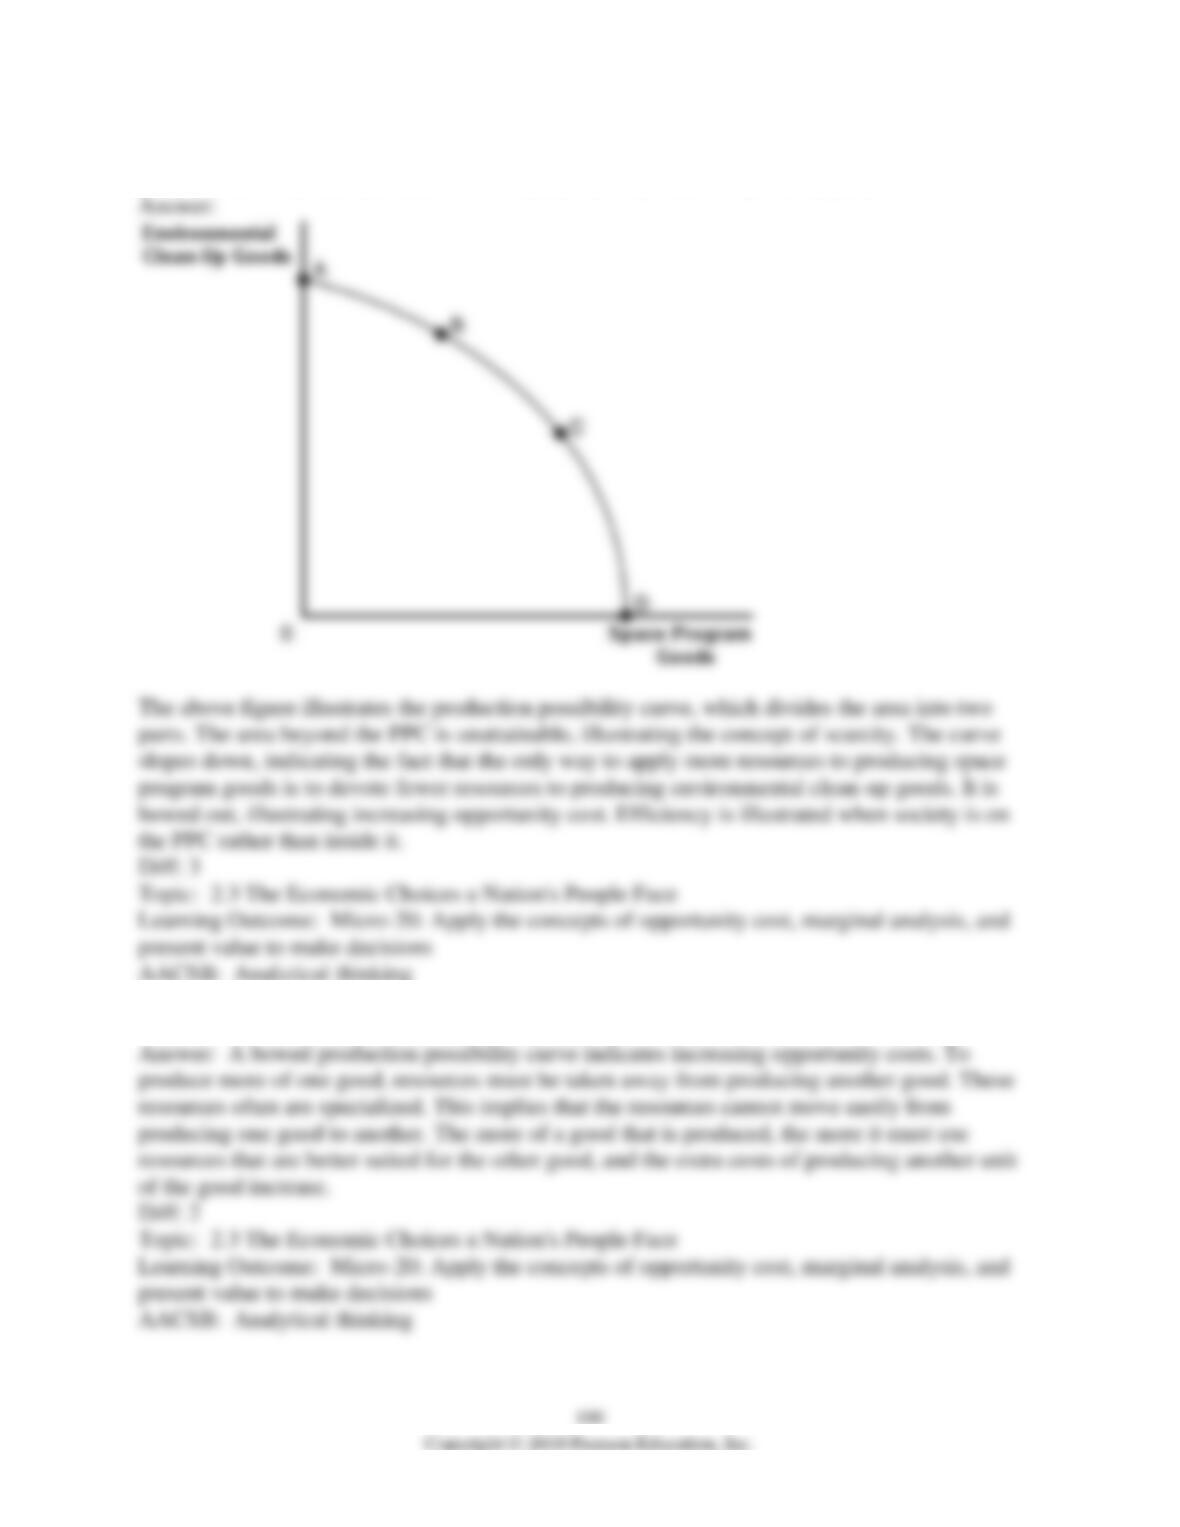
103) For a country that produces two goods: Environmental clean-up goods and space program
goods. What economic information is contained in its production possibility curve?
104) What causes the production possibility curve to be bowed out?