Chapter 2/Thinking Like an Economist ❖ 21
108. Refer to Figure 2-2. If Box A of this circular-flow diagram represents firms, then which box represents
households?
a.
Box B
b.
Box C
c.
Box D
d.
Any one of the other boxes (B, C, or D) could represent households.
109. Refer to Figure 2-2. If households are sellers in the markets represented by Box D of this circular-flow dia-
gram, then
a.
Box D must represent the markets for factors of production.
b.
Box C must represent the markets for goods and services.
c.
firms are buyers in the markets represented by Box D.
d.
All of the above are correct.
110. Refer to Figure 2-2. If households are buyers in the markets represented by Box C of this circular-flow dia-
gram, then
a.
Box C must represent the markets for the factors of production.
b.
Box D must represent the markets for goods and services.
c.
firms are sellers in the markets represented by Box C.
d.
All of the above are correct.
111. Refer to Figure 2-2. If the owners of land, labor, and capital are represented by Box B of this circular-flow
diagram, then
a.
households are represented by Box A.
b.
firms are represented by Box C.
c.
firms are represented by Box A.
d.
firms are sellers in Box B.
112. Refer to Figure 2-2. If the outer loop of this circular-flow diagram represents flows of dollars, then the inner
loop includes
a.
flows of goods and services from households to firms.
b.
flows of inputs from households to firms.
c.
flows of rent payments paid to owners of land.
d.
flows of wages and salaries paid to workers.
22 ❖ Chapter 2/Thinking Like an Economist
113. Refer to Figure 2-2. If the flow of goods and services is part of what is represented by the inner loop of this
circular-flow diagram, then
a.
the flow of factors of production is also part of what is represented by the inner loop.
b.
the flow of income paid to households is also part of what is represented by the inner loop.
c.
the flow of revenue to firms is also part of what is represented by the inner loop.
d.
households must be sellers of output.
114. Refer to Figure 2-2. Devin works as an attorney for a corporation and is paid a salary in exchange for the
legal services he performs. Juan owns office buildings and rents his buildings to companies in exchange for
rent payments. If Devin’s income is represented by a flow of dollars from Box D to Box B of this circular-
flow diagram, then Juan’s income is represented by a flow of dollars
a.
from Box A to Box C.
b.
from Box C to Box A.
c.
from Box B to Box D.
d.
from Box D to Box B.
115. Refer to Figure 2-2. Carla regularly buys fruits and vegetables at a grocery store. Roberto regularly pays a
lawn-care company to mow his lawn. If the flow of fruits and vegetables from the grocery store to Carla is
represented by an arrow from Box C to Box B of this circular-flow diagram, then the money paid by Roberto
to the lawn-care company is represented by an arrow
a.
from Box A to Box D.
b.
from Box B to Box C.
c.
from Box C to Box B.
d.
from Box D to Box A.
116. The production possibilities frontier is a graph that shows the various combinations of output that an economy
can possibly produce given the available factors of production and
a.
society’s preferences.
b.
the available production technology.
c.
a fair distribution of the output.
d.
the available demand for the output.
117. The production possibilities frontier is a graph that shows the various combinations of output that an economy
a.
should produce.
b.
wants to produce.
c.
can produce.
d.
demands.
Chapter 2/Thinking Like an Economist ❖ 23
118. When constructing a production possibilities frontier, which of the following assumptions is not made?
a.
The economy produces only two goods or two types of goods.
b.
Firms produce goods using factors of production.
c.
The technology available to firms is given.
d.
The quantities of the factors of production that are available are increasing over the relevant time
period.
119. Any point on a country’s production possibilities frontier represents a combination of two goods that an econ-
omy
a.
will never be able to produce.
b.
can produce using all available resources and technology.
c.
can produce using some portion, but not all, of its resources and technology.
d.
may be able to produce in the future with more resources and/or superior technology.
120. Which of the following is not an assumption of the productions possibilities frontier?
a.
A country produces only two goods or types of goods.
b.
Technology does not change.
c.
The amount of available resources does not change.
d.
There is a fixed quantity of money.
121. Which of the following is a correct statement about production possibilities frontiers?
a.
An economy can produce only on the production possibilities frontier.
b.
An economy can produce at any point inside or outside a production possibilities frontier.
c.
An economy can produce at any point on or inside the production possibilities frontier, but not
outside the frontier.
d.
An economy can produce at any point inside the production possibilities frontier, but not on or
outside the frontier.
122. Where can an economy not produce?
a.
inside its production possibilities frontier
b.
on its production possibilities frontier
c.
outside its production possibilities frontier
d.
at the endpoints of its production possibilities frontier
24 ❖ Chapter 2/Thinking Like an Economist
123. An economic outcome is said to be efficient if the economy is
a.
using all of the scarce resources it has available.
b.
conserving on resources, rather than using all available resources.
c.
getting all it can get from the scarce resources it has available.
d.
able to produce more than what is currently being produced without additional resources.
124. Production is efficient if the economy is producing at a point
a.
on the production possibilities frontier.
b.
outside the production possibilities frontier.
c.
on or inside the production possibilities frontier.
d.
inside the production possibilities frontier.
125. If an economy is producing efficiently, then
a.
there is no way to produce more of one good without producing less of another good.
b.
it is possible to produce more of both goods without increasing the quantities of inputs that are
being used.
c.
it is possible to produce more of one good without producing less of another good.
d.
it is not possible to produce more of any good at any cost.
126. An economy’s production of two goods is efficient if
a.
all members of society consume equal portions of the goods.
b.
the goods are produced using only some of society’s available resources.
c.
it is impossible to produce more of one good without producing less of the other.
d.
the opportunity cost of producing more of one good is zero.
127. When an economy is operating at a point on its production possibilities frontier, then
a.
consumers are content with the mix of goods and services that is being produced.
b.
there is no way to produce more of one good without producing less of the other.
c.
equal amounts of the two goods are being produced.
d.
All of the above are correct.
128. Efficiency is illustrated by
a.
both the production possibilities frontier and the circular-flow diagram.
b.
neither the production possibilities frontier nor the circular-flow diagram.
c.
the production possibilities frontier only.
d.
the circular-flow diagram only.
Chapter 2/Thinking Like an Economist ❖ 25
129. Suppose a nation is currently producing at a point inside its production possibilities frontier. We know that
a.
the nation is producing beyond its capacity, so inflation will occur.
b.
the nation is not using all available resources or is using inferior technology or both.
c.
the nation is producing an efficient combination of goods.
d.
there will be a large opportunity cost if the nation tries to increase production of any good.
130. When an economy is operating inside its production possibilities frontier, we know that
a.
there are unused resources or inefficiencies in the economy.
b.
all of the economy’s resources are fully employed.
c.
economic growth would have to occur in order for the economy to move to a point on the frontier.
d.
in order to produce more of one good, the economy would have to give up some of the other good.
131. It is possible for an economy to increase its production of both goods if the economy
a.
moves downward and to the right along its production possibilities frontier and the frontier is
bowed outward.
b.
moves upward and to the left along its production possibilities frontier and the frontier is bowed
outward.
c.
moves in either direction along its production possibilities frontier and the frontier is a straight line.
d.
moves from a situation of inefficient production to a situation of efficient production.
132. Unemployment would cause an economy to
a.
produce inside its production possibilities frontier.
b.
produce on its production possibilities frontier.
c.
produce outside its production possibilities frontier.
d.
experience an inward shift of its production possibilities frontier.
133. The production possibilities frontier provides an illustration of the principle that
a.
trade can make everyone better off.
b.
governments can sometimes improve market outcomes.
c.
people face trade-offs.
d.
people respond to incentives.
134. The production possibilities frontier illustrates
a.
the trade-off between efficiency and equality.
b.
the combination of output that an economy should produce.
c.
the combination of output that each member of society should consume.
d.
None of the above is correct.
26 ❖ Chapter 2/Thinking Like an Economist
135. Which of the following trade-offs does the production possibilities frontier illustrate?
a.
if an economy wants to increase efficiency in production, then it must sacrifice equality in
consumption
b.
once an economy has reached the efficient points on its production possibilities frontier, the only
way of getting more of one good is to get less of the other
c.
for an economy to consume more of one good, it must stop consuming the other good entirely
d.
for an economy to produce and consume goods, it must sacrifice environmental quality
136. Which of the following concepts cannot be illustrated by the production possibilities frontier?
a.
efficiency
b.
opportunity cost
c.
equality
d.
trade-offs
137. The opportunity cost of obtaining more of one good is shown on the production possibilities frontier as the
a.
amount of the other good that must be given up.
b.
market price of the additional amount produced.
c.
amount of resources that must be devoted to its production.
d.
number of dollars that must be spent to produce it.
138. The bowed shape of the production possibilities frontier can be explained by the fact that
a.
all resources are scarce.
b.
economic growth is always occurring.
c.
the opportunity cost of one good in terms of the other depends on how much of each good the
economy is producing.
d.
the only way to get more of one good is to get less of the other.
139. Economists believe that production possibilities frontiers are often bowed because
a.
trade-offs inevitably create unemployment.
b.
resources are not completely adaptable.
c.
opportunity costs are constant.
d.
of improvements in technology.
140. On a bowed production possibilities frontier, as you move down along the curve
a.
more of one good must be given up to receive one unit of the other good.
b.
the available production technology does not change.
c.
the opportunity cost increases.
d.
All of the above are correct.
Chapter 2/Thinking Like an Economist ❖ 27
141. When a production possibilities frontier is bowed outward, the opportunity cost of producing an additional
unit of a good
a.
increases as more of the good is produced.
b.
decreases as more of the good is produced.
c.
does not change as more of the good is produced.
d.
may increase, decrease, or not change as more of the good is produced.
142. Production possibilities frontiers are usually bowed outward. This is because
a.
the more resources a society uses to produce one good, the fewer resources it has available to
produce another good.
b.
it reflects the fact that the opportunity cost of producing a good decreases as more and more of that
good is produced.
c.
of the effects of technological change.
d.
resources are specialized; that is, some are better at producing particular goods rather than other
goods.
143. Economists believe that production possibilities frontiers
a.
never have a bowed shape.
b.
rarely have a bowed shape.
c.
often have a bowed shape.
d.
always have a bowed shape.
Table 2-1
The following table contains some production possibilities for an economy for a given month.
Tables
Chairs
5
300
10
?
15
100
144. Refer to Table 2-1. If the production possibilities frontier is bowed outward, then “?” could be
a.
100.
b.
150.
c.
200.
d.
250.
28 ❖ Chapter 2/Thinking Like an Economist
Table 2-2
The following table contains some production possibilities for an economy for a given year:
Cakes
Rolls (in dozens)
100
5000
120
4600
140
?
145. Refer to Table 2–2. If the production possibilities frontier is bowed outward, then “?” could be
a.
4400.
b.
4300.
c.
4200.
d.
4100.
146. A production possibilities frontier can shift outward if
a.
government increases the amount of money in the economy.
b.
there is a technological improvement.
c.
resources are shifted from the production of one good to the production of the other good.
d.
the economy abandons inefficient production methods in favor of efficient production methods.
147. A production possibilities frontier shifts outward when
a.
the economy experiences economic growth.
b.
the desires of the economy’s citizens change.
c.
at least one of the basic principles of economics is violated.
d.
opportunity costs are lessened.
148. In a certain economy, jam and bread are produced, and the economy currently operates on its production pos-
sibilities frontier. Which of the following events would allow the economy to produce more jam and more
bread, relative to the quantities of those goods that are being produced now?
a.
Unemployed labor is put to work producing jam and bread.
b.
The economy puts its idle capital to work producing jam and bread.
c.
The economy experiences economic growth.
d.
All of the above are correct.
Chapter 2/Thinking Like an Economist ❖ 29
149. In a certain economy, toys and greeting cards are produced, and the economy currently operates on its produc-
tion possibilities frontier. Which of the following events would allow the economy to produce more toys and
more greeting cards, relative to the quantities of those goods that are being produced now?
a.
The economy experiences economic growth.
b.
There is a technological advance in the toy industry, but the greeting card industry experiences no
such advance.
c.
There is a technological advance in the greeting card industry, but the toy industry experiences no
such advance.
d.
All of the above are correct.
150. The country of Aceland produces two goods, televisions and computers. Last year, it produced 200 televisions
and 500 computers. This year, it produced 250 televisions and 600 computers. Given no other information,
which of the following events could not explain this change?
a.
Aceland experienced a reduction in unemployment.
b.
Aceland experienced an improvement in computer-making technology.
c.
Aceland acquired more resources.
d.
Any of these events could, in fact, explain the change.
151. Suppose an economy produces two goods, food and machines. This economy always operates on its produc-
tion possibilities frontier. Last year, it produced 1000 units of food and 47 machines. This year, it is produc-
ing 1050 units of food and 52 machines. Which of the following events could not explain the increase in out-
put?
a.
a reduction in unemployment
b.
an increase in available labor
c.
an improvement in technology
d.
Any of these events could explain the increase in output.
152. Suppose an economy produces two goods, food and machines. This economy always operates on its produc-
tion possibilities frontier. Last year, it produced 1000 units of food and 47 machines. This year it experienced
a technological advance in its machine-making industry. As a result, this year the society wants to produce
1050 units of food and 47 machines. Which of the following statements is correct?
a.
Because the technological advance occurred in the machine-making industry, it will not be possible
to increase food production without reducing machine production below 47.
b.
Because the technological advance occurred in the machine-making industry, increases in output
can only occur in the machine industry.
c.
In order to increase food production in these circumstances without reducing machine production,
the economy must reduce inefficiencies.
d.
The technological advance reduced the amount of resources needed to produce 47 machines, so
these resources could be used to produce more food.
30 ❖ Chapter 2/Thinking Like an Economist
153. A certain production possibilities frontier shows production possibilities for two goods, jewelry and clothing.
Which of the following concepts cannot be illustrated by this model?
a.
the flow of dollars between sellers of jewelry and clothing and buyers of jewelry and clothing
b.
the tradeoff between production of jewelry and production of clothing
c.
the opportunity cost of clothing in terms of jewelry
d.
the effect of economic growth on production possibilities involving jewelry and clothing
154. The production possibilities frontier is used to illustrate some basic economic ideas, including
a.
scarcity.
b.
opportunity cost.
c.
economic growth.
d.
All of the above are correct.
Table 2-3
Production Possibilities for Libraryland
Books
Magazines
400
0
300
200
200
350
100
450
0
500
155. Refer to Table 2-3. What is the opportunity cost to Libraryland of increasing the production of books from
200 to 300?
a.
100 magazines
b.
150 magazines
c.
200 magazines
d.
350 magazines
156. Refer to Table 2-3. Which of the following statements is correct?
a.
The opportunity cost of an additional 100 books is constant at 50 magazines.
b.
The opportunity cost of an additional 100 books is constant at 100 magazines.
c.
Libraryland’s production possibilities frontier is a straight, downward-sloping line.
d.
The opportunity cost of an additional 100 books increases as more books are produced.
Chapter 2/Thinking Like an Economist ❖ 31
Table 2-4
Production Possibilities for Batterland
Pancakes
Waffles
600
0
450
150
300
250
150
325
0
375
157. Refer to Table 2-4. What is the opportunity cost to Batterland of increasing the production of pancakes from
150 to 300?
a.
75 waffles
b.
150 waffles
c.
250 waffles
d.
325 waffles
Figure 2-3
J
K
L
M
N
pans
ovens
158. Refer to Figure 2-3. At which point is this economy producing its maximum possible quantity of pans?
a.
J
b.
L
c.
M
d.
N
159. Refer to Figure 2-3. This economy has the ability to produce at which point(s)?
a.
J, K, M, N
b.
K, M, N
c.
K, N
d.
M
32 ❖ Chapter 2/Thinking Like an Economist
160. Refer to Figure 2-3. This economy cannot produce at which point(s)?
a.
J
b.
J, L
c.
J, L, M
d.
L
161. Refer to Figure 2-3. Efficient production is represented by which point(s)?
a.
J, K, N
b.
K, M, N
c.
K, N
d.
L, M
162. Refer to Figure 2-3. Inefficient production is represented by which point(s)?
a.
J, L
b.
J, L, M
c.
K, N
d.
M
163. Refer to Figure 2-3. Unemployment could cause this economy to produce at which point(s)?
a.
J, L
b.
J, L, M
c.
K, N
d.
M
Chapter 2/Thinking Like an Economist ❖ 33
Figure 2-4
Z
Y
V
W
10 20 30 40 50 60 70 80 notepads
5
10
15
20
25
30
35
40
45
50 lamps
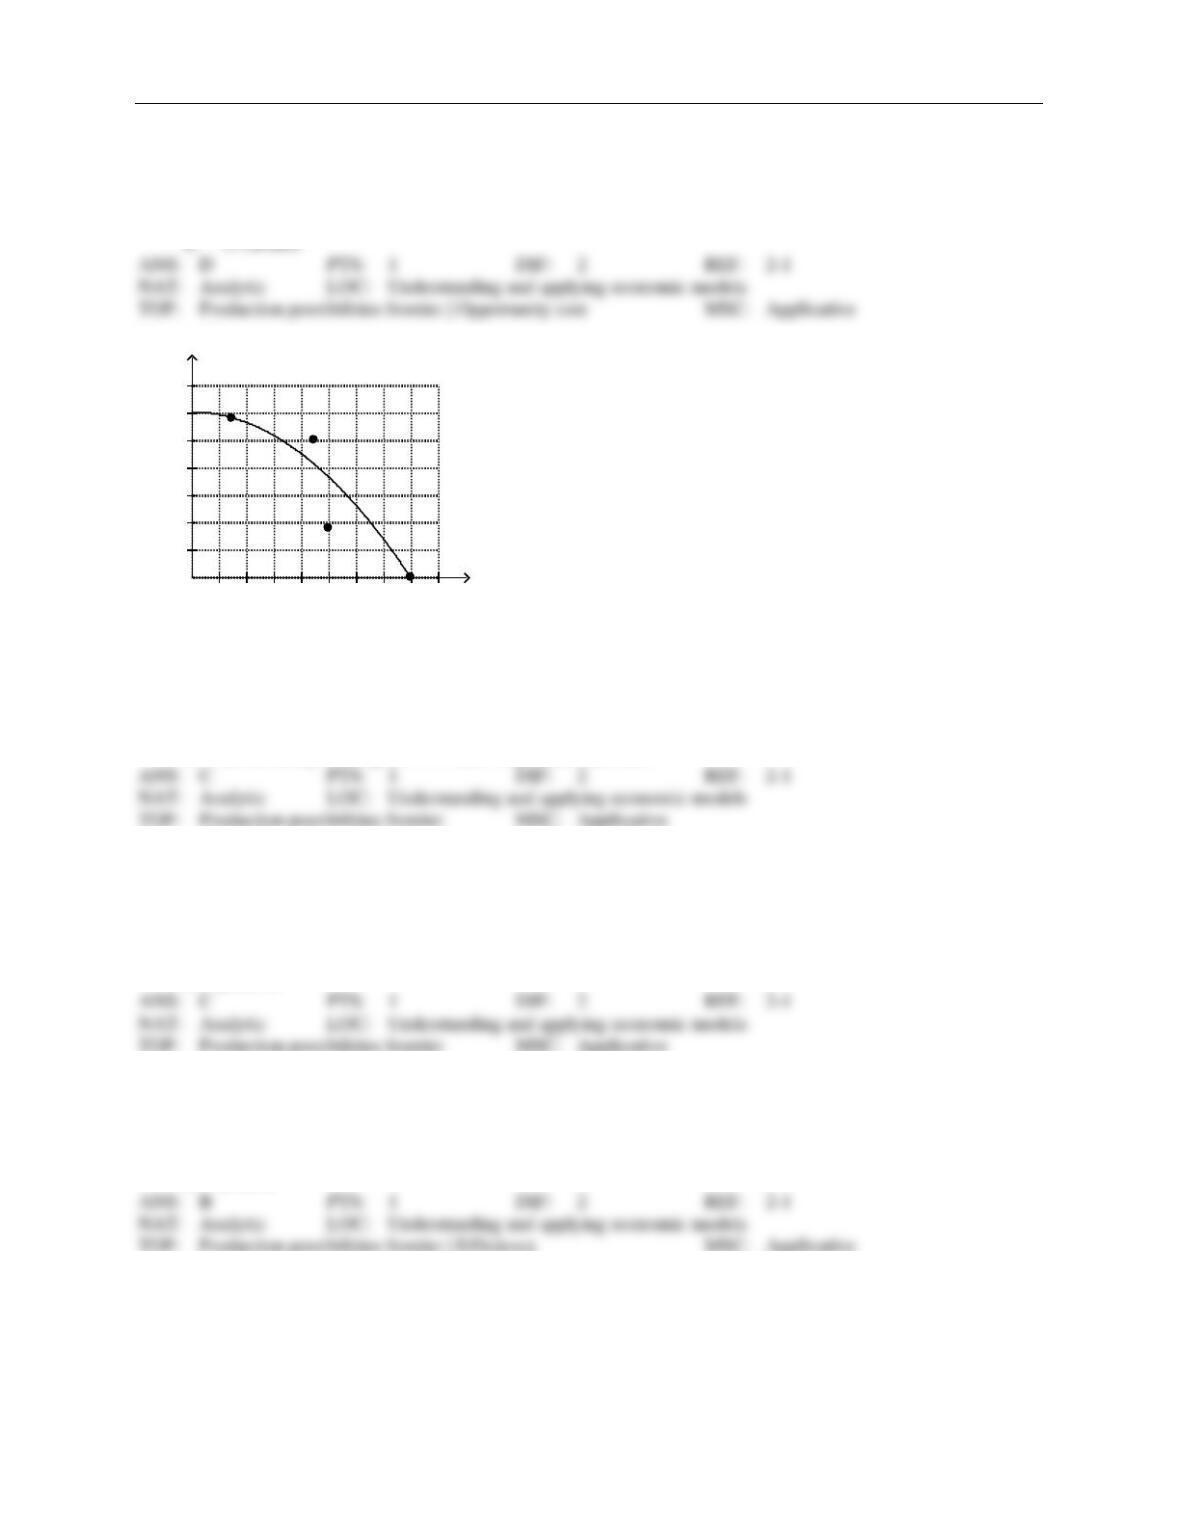
164. Refer to Figure 2-4. If this economy devotes all of its resources to the production of notepads, then it will
produce
a.
0 notepads and 40 lamps.
b.
35 notepads and 20 lamps.
c.
70 notepads and 0 lamps.
d.
70 notepads and 40 lamps.
165. Refer to Figure 2-4. It is possible for this economy to produce
a.
40 notepads and 20 lamps.
b.
50 notepads and 30 lamps.
c.
70 notepads and 40 lamps.
d.
All of the above.
166. Refer to Figure 2-4. It is not possible for this economy to produce at point
a.
V.
b.
W.
c.
Y.
d.
Z.
167. Refer to Figure 2-4. This economy cannot currently produce 30 notepads and 45 lamps because
a.
some of its resources are unemployed.
b.
inefficiencies exist in this economy’s production process.
c.
given its current technology, it does not have the resources to produce that level of output.
d.
All of the above are correct.
34 ❖ Chapter 2/Thinking Like an Economist
168. Refer to Figure 2-4. Suppose this economy is producing at point W. Which of the following statements
would best explain this situation?
a.
The economy lacks the resources to produce at a more desirable point.
b.
The economy’s available technology prevents it from producing at a more desirable point.
c.
There is widespread unemployment in the economy.
d.
Any of the above statements would be a legitimate explanation for this situation.
169. Refer to Figure 2-4. Efficient production is represented by which point(s)?
a.
Y, Z
b.
W, Y, Z
c.
V, Y, Z
d.
V
170. Refer to Figure 2-4. Inefficient production is represented by which point(s)?
a.
Y, Z
b.
V
c.
V, W
d.
W
171. Refer to Figure 2-4. The opportunity cost of this economy moving from point Z to point Y is
a.
0 lamps.
b.
10 lamps.
c.
10 notepads.
d.
20 lamps.
172. Refer to Figure 2-4. The opportunity cost of obtaining 20 additional lamps by moving from point W to point
V is
a.
0 notepads.
b.
10 notepads.
c.
50 notepads.
d.
None of the above; the economy cannot move from point W to point V.
Chapter 2/Thinking Like an Economist ❖ 35
173. Refer to Figure 2-4. The opportunity cost of obtaining 10 additional lamps by moving from point W to point
Z is
a.
0 notepads.
b.
10 notepads.
c.
50 notepads.
Figure 2-5
A
B
C
D
soccer balls
Fsweaters
30 60 90 120 150 180 210 240 270 300 330 360
25
50
75
100
125
150
175
200
225
174. Refer to Figure 2-5. If this economy devotes all of its resources to the production of sweaters, then it will
produce
a.
0 sweaters and 200 soccer balls.
b.
180 sweaters and 125 soccer balls.
c.
300 sweaters and 0 soccer balls.
d.
300 sweaters and 200 soccer balls.
175. Refer to Figure 2-5. If this economy devotes one-half of its available resources to the production of soccer
balls and the other half to the production of sweaters, it could produce
a.
150 sweaters and 100 soccer balls.
b.
150 sweaters and 150 soccer balls.
c.
300 sweaters and 200 soccer balls.
d.
We would have to know the details of this economy’s technology in order to determine this.
176. Refer to Figure 2-5. A movement from point C to point D could be caused by
a.
unemployment.
b.
a decrease in society’s preference for sweaters.
c.
fewer resources available for production of sweaters.
d.
All of the above are correct.
d.
None of the above; the economy cannot move from point W to point Z.
36 ❖ Chapter 2/Thinking Like an Economist
177. Refer to Figure 2-5. If this economy moves from point A to point B, then which of the following statements
is correct?
a.
This economy has moved from a point of inefficient production to a point of efficient production.
b.
This economy has experienced economic growth.
c.
This economy has experienced an increase in employment.
d.
None of the above is correct.
178. Refer to Figure 2-5. The opportunity cost of this economy moving from point A to point C is
a.
75 soccer balls.
b.
125 soccer balls.
c.
125 soccer balls and 240 sweaters.
d.
240 sweaters.
179. Refer to Figure 2-5. The opportunity cost of this economy moving from point D to point B is
a.
zero.
b.
50 soccer balls.
c.
60 sweaters.
d.
50 soccer balls and 60 sweaters.
Figure 2-6
A
B
C
D
FG
2 4 6 8 10 12 14 16 clocks
5
10
15
20
25
30
35
40
45
candles
180. Refer to Figure 2-6. If this economy devotes all of its resources to the production of clocks, then it will pro-
duce
a.
0 clocks and 35 candles.
b.
10 clocks and 25 candles.
c.
16 clocks and 0 candles.
d.
16 clocks and 35 candles.
Chapter 2/Thinking Like an Economist ❖ 37
181. Refer to Figure 2-6. This economy has the ability to produce at which point(s)?
a.
A, B
b.
A, B, D
c.
A, B, C, F, G
d.
C, F, G
182. Refer to Figure 2-6. This economy cannot produce at which point(s)?
a.
A, B, D
b.
C, D, F, G
c.
C, F, G
d.
D
183. Refer to Figure 2-6. Efficient production is represented by which point(s)?
a.
A, B
b.
A, B, C, F, G
c.
C, F, G
d.
D
184. Refer to Figure 2-6. Inefficient production is represented by which point(s)?
a.
A, B
b.
C, D, F, G
c.
C, F, G
d.
D
185. Refer to Figure 2-6. Unemployment could cause this economy to produce at which point(s)?
a.
A, B
b.
C, D, F, G
c.
C, F, G
d.
D
186. Refer to Figure 2-6. If this economy moved from point C to point F, then
a.
it still would not be producing efficiently.
b.
there would be no gain in either candles or clocks.
c.
it would be producing more candles and more clocks than at point C.
d.
It is not possible for this economy to move from point C to point F without additional resources.
38 ❖ Chapter 2/Thinking Like an Economist
187. Refer to Figure 2-6. What is the opportunity cost of moving from point A to point B?
a.
zero
b.
6 clocks
c.
6 clocks and 15 candles
Figure 2-7
J
K
L
M
400 800 1200 hammers
400
800
1200
1600
2000
2400
2800
nails
188. Refer to Figure 2-7. Point K represents an outcome in which
a.
production is inefficient.
b.
some of the economy’s resources are unemployed.
c.
the economy is using all of its resources to produce hammers.
d.
the economy is using all of its nails to produce hammers.
189. Refer to Figure 2-7. Which point on the graph best represents the fact that, because resources are scarce, not
every conceivable outcome is feasible?
a.
point J
b.
point K
c.
point L
d.
point M
190. Refer to Figure 2-7. Efficient production is represented by which point(s)?
a.
J
b.
J, K
c.
J, K, L
d.
J, K, M
d.
15 candles
Chapter 2/Thinking Like an Economist ❖ 39
191. Refer to Figure 2-7. Inefficient production is represented by which point(s)?
a.
K, M
b.
L
c.
L, M
d.
M
192. Refer to Figure 2-7. In order to reach point L, the economy would have to
a.
acquire more resources or experience a technological advance.
b.
begin using its available resources more efficiently than it is currently using them.
c.
shift resources away from the production of nails and toward production of hammers.
d.
None of the above are correct; the economy will never be able to reach point L.
193. Refer to Figure 2-7. For this economy, as more and more hammers are produced, the opportunity cost of an
additional hammers produced, in terms of nails,
a.
remains constant.
b.
increases.
c.
decreases.
d.
This cannot be determined from the graph.
40 ❖ Chapter 2/Thinking Like an Economist
Figure 2-8
Panel (a)
Panel (b)
J
KL
M
N
cups of coffee
1 2 3 4 5 6 donuts
0.5
1
1.5
2
2.5
3
3.5
4
4.5
5
5.5
6
6.5
7
cups of coffee
1 2 3 4 5 6 donuts
0.5
1
1.5
2
2.5
3
3.5
4
4.5
5
5.5
6
6.5
7
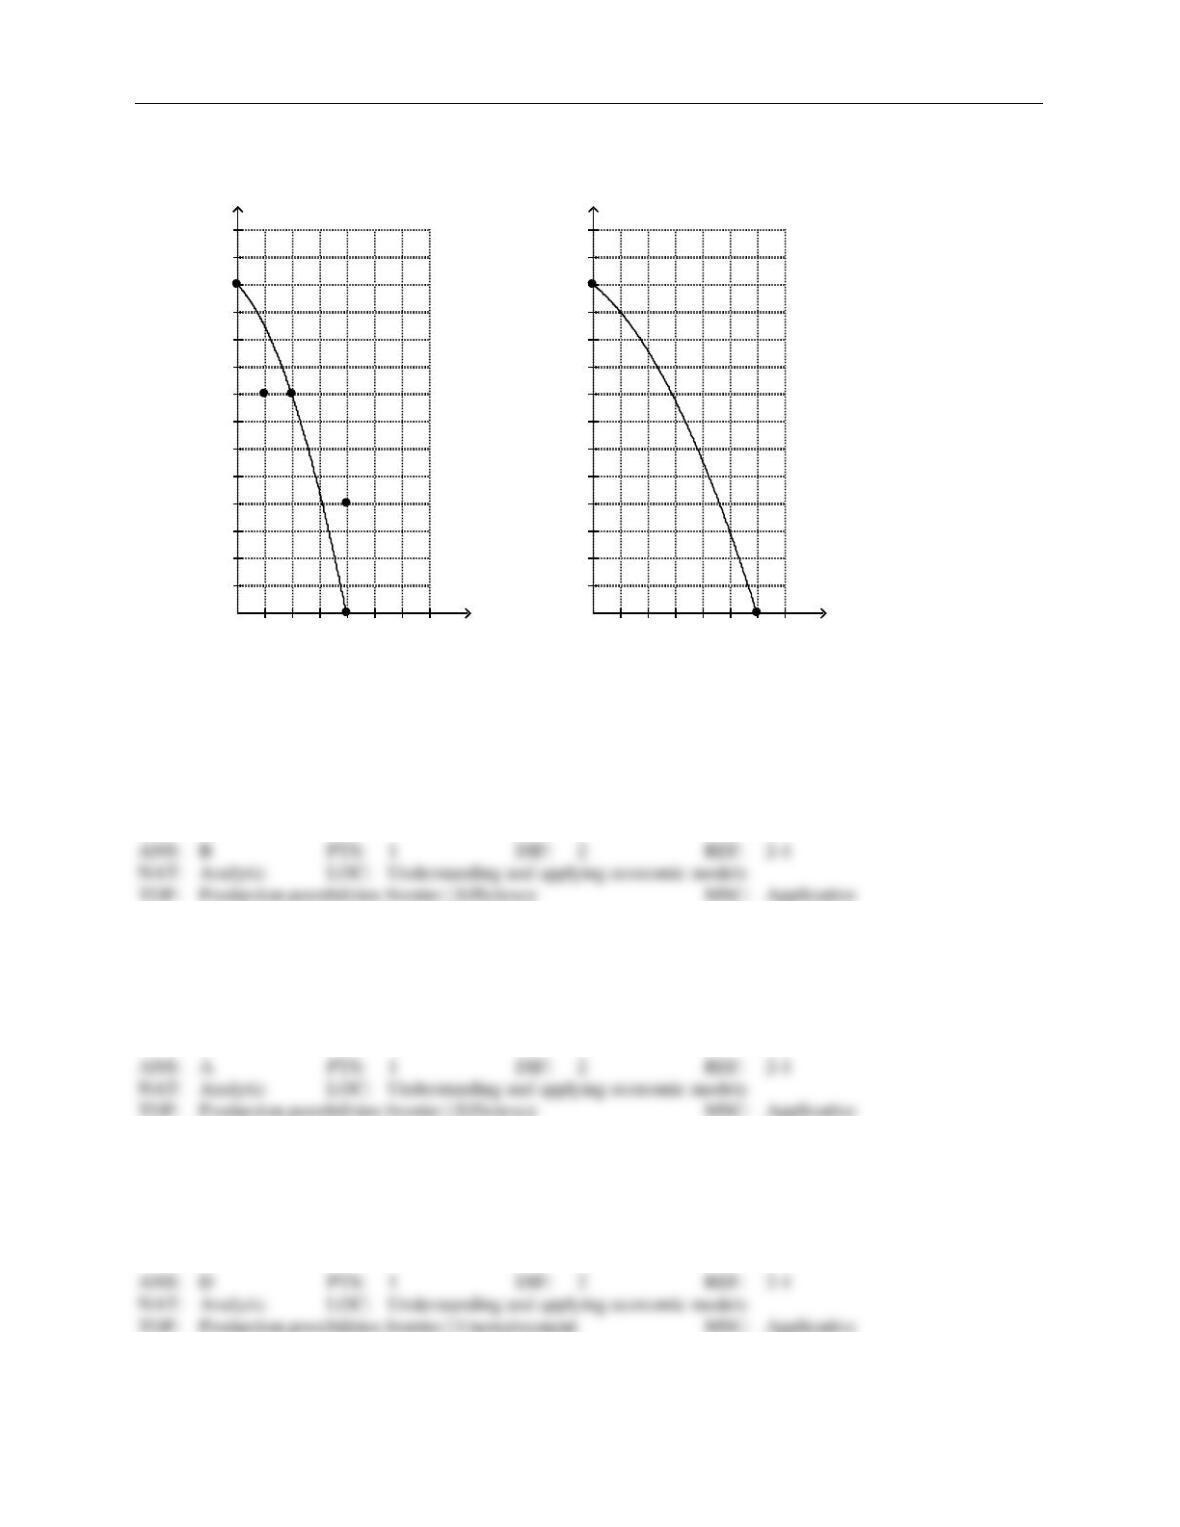
194. Refer to Figure 2-8, Panel (a). Production at point K is
a.
possible and efficient.
b.
possible but inefficient.
c.
impossible but efficient.
d.
impossible and inefficient.
195. Refer to Figure 2-8, Panel (a). Production is
a.
possible at points J, K, L, and M, but efficient only at points J, L, and M.
b.
possible at points J, K, L, and M, but efficient only at point K.
c.
possible at points J, L, M, and N, but efficient only at points J, L, and M.
d.
possible at points J, L, M, and N, but efficient only at point N.
196. Refer to Figure 2-8, Panel (a). The movement from point M to point K could be caused by
a.
an advance in production technology.
b.
an improvement in efficiency.
c.
economic growth.
d.
unemployment.