CHAPTER 2—ECONOMIC OPTIMIZATION Key
1. An equation is:
2. Inflection is:
3. The breakeven level of output occurs where:
4. Incremental profit is:
5. The incremental profit earned from the production and sale of a new product will be higher if:
6. Which of the following short run strategies should a manager select to obtain the highest degree of sales
penetration?
7. If total revenue increases at a constant rate as output increases, marginal revenue:
8. The comprehensive impact resulting from a decision is the:
9. Total revenue is maximized at the point where marginal:
10. If P = $1,000 – $4Q:
11. Total cost minimization occurs at the point where:
12. Average cost minimization occurs at the point where:
13. The slope of a straight line from the origin to the total profit curve indicates:
14. The optimal output decision:
15. Marginal profit equals:
16. Profit per unit is rising when marginal profit is:
17. Marginal cost is rising when marginal cost is:
18. Marginal profit equals average profit when:
19. Total revenue increases at a constant rate as output increases when average revenue:
20. The optimal decision produces:
21. If average profit increases with output marginal profit must be:
22. At the profit-maximizing level of output:
23. When marginal profit equals zero:
24. If profit is to rise as output expands, then marginal profit must be:
25. An optimal decision:
26. Marginal Analysis. Consider the price (P) and output (Q) data in the following table.
Q
P
TR
MR
AR
0
$35
1
30
2
25
3
20
4
15
5
10
6
5
7
0
A.
Calculate the related total revenue (TR), marginal revenue (MR), and average revenue (AR) figures.
B.
At what output level is revenue maximized?
A.
0
$35
$ 0
1
30
2
25
4
15
5
10
6
5
7
0
B.
Revenue is maximized at an output level 4, where MR = 0.
27. Marginal Analysis. Evaluate the price (P) and the output (Q) data in the following table.
Q
P
TR
MR
AR
0
$80
1
70
2
60
3
50
4
40
5
30
6
20
7
10
8
0
A.
Compute the related total revenue (TR), marginal revenue (MR), and average revenue (AR) figures:
B.
At what output level is revenue maximized?
28. Revenue Maximization. Assume the following output (Q) and price (P) data.
Q
P
TR
MR
AR
0
$50
1
45
2
40
3
35
4
30
5
25
6
20
7
15
8
10
9
5
10
0
A.
At what output level is revenue maximized?
B.
Why is marginal revenue less than average revenue at each price level?
A.
MR = TR/ Q
0
$80
1
70
2
60
3
50
4
40
5
30
6
20
7
10
8
0
Revenue is maximized at an output level slightly greater than 4, where MR = 0.
29. Profit Maximization. Fill in the missing data for price (P), total revenue (TR), marginal revenue (MR),
total cost (TC), marginal cost (MC), profit (p), and marginal profit (Mp) in the following table.
Q
P
TR = P´Q
MR = TR/ Q
TC
MC = TC/ Q
p =
TR – TC
Mp = p/ Q
0
$200
$ 0
—
$ 0
—
$ 0
—
1
180
180
$180
100
$100
80
$ 80
2
320
175
65
3
420
100
240
65
180
4
120
60
55
185
5
5
100
500
350
55
150
–35
6
80
480
–20
400
–70
7
60
–60
450
50
–30
-110
8
320
-100
55
-185
-155
9
20
180
570
65
-205
10
10
–80
750
180
-650
-260
A.
At what output (Q) level is profit maximized?
B.
At what output (Q) level is revenue maximized?
C.
Discuss any differences in your answers to parts A and B.
A.
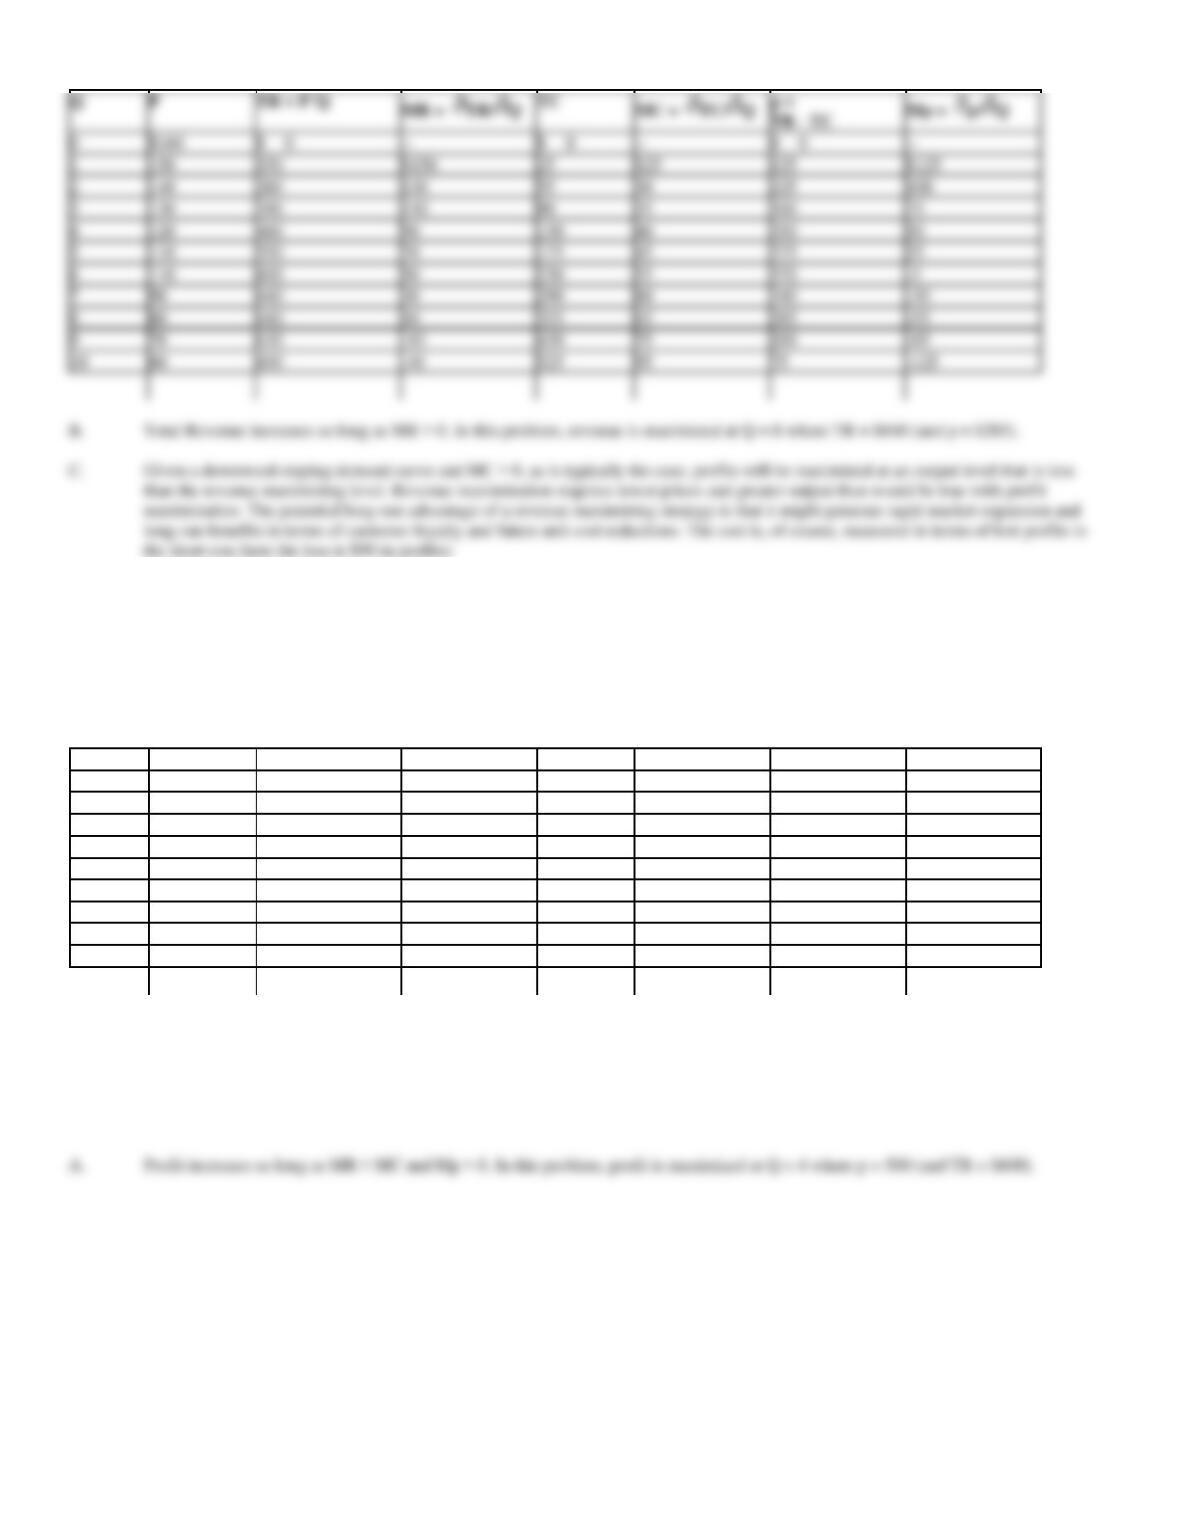
Profit increases so long as MR > MC and Mp > 0. In this problem, profit is maximized at Q = 4 where p = $185 (and TR = $480).
A.
Notice the following figures for total revenue and marginal revenue.
0
$50
$ 0
—
—
1
45
45
$45
$45
2
40
80
35
40
3
4
30
120
15
30
5
25
125
5
25
6
20
120
–5
20
7
15
105
–15
15
8
9
5
45
–35
5
0
Revenue is maximized at an output level of 5.
30. Profit Maximization. Fill in the missing data for price (P), total revenue (TR), marginal revenue (MR),
total cost (TC), marginal cost (MC), profit (p), and marginal profit (Mp) in the following table.
Q
P
TR
MR
TC
MC
p
Mp
0
$160
$ 0
$ —
$ 0
$ —
$ 0
$ —
1
150
150
150
25
25
125
125
2
140
55
30
100
3
390
35
300
75
4
120
90
130
350
5
110
550
175
25
6
600
50
55
370
7
630
290
60
–30
8
80
640
355
285
9
630
75
–85
10
600
525
75
A.
At what output (Q) level is profit maximized?
B.
At what output (Q) level is revenue maximized?
C.
Discuss any differences in your answers to parts A and B.
A.
Profit increases so long as MR > MC and Mp > 0. In this problem, profit is maximized at Q = 5 where p = $375 (and TR = $550).
0
$200
$ 0
$ 0
1
180
180
$180
100
$100
80
$ 80
2
160
320
140
175
75
145
65
3
140
420
100
240
65
180
35
4
120
480
60
295
55
185
5
5
100
350
55
6
80
480
–20
400
50
80
–70
7
60
450
50
-110
8
40
320
-100
505
55
-185
-155
9
20
180
-140
570
65
-390
-205
10
10
100
–80
750
180
-650
-260
B.
Total Revenue increases so long as MR > 0. In this problem, revenue is maximized at Q = 5 where TR = $500 (and p = $150).
the short-run (here the loss is $35 in profits).
31. Profit Maximization. Fill in the missing data for price (P), total revenue (TR), marginal revenue (MR),
total cost (TC), marginal cost (MC), profit (p), and marginal profit (Mp) in the following table.
Q
P
TR
MR
TC
MC
p
Mp
0
$230
$ 0
$ —
$ 0
$ —
$ 0
$ —
1
210
10
200
2
380
20
150
3
170
130
30
450
4
600
100
40
50
5
130
60
490
–10
6
660
160
430
7
630
–30
310
-110
8
70
–70
400
90
160
-160
A.
At what output (Q) level is profit maximized?
B.
At what output (Q) level is revenue maximized?
C.
Discuss any differences in your answers to parts A and B.
A.
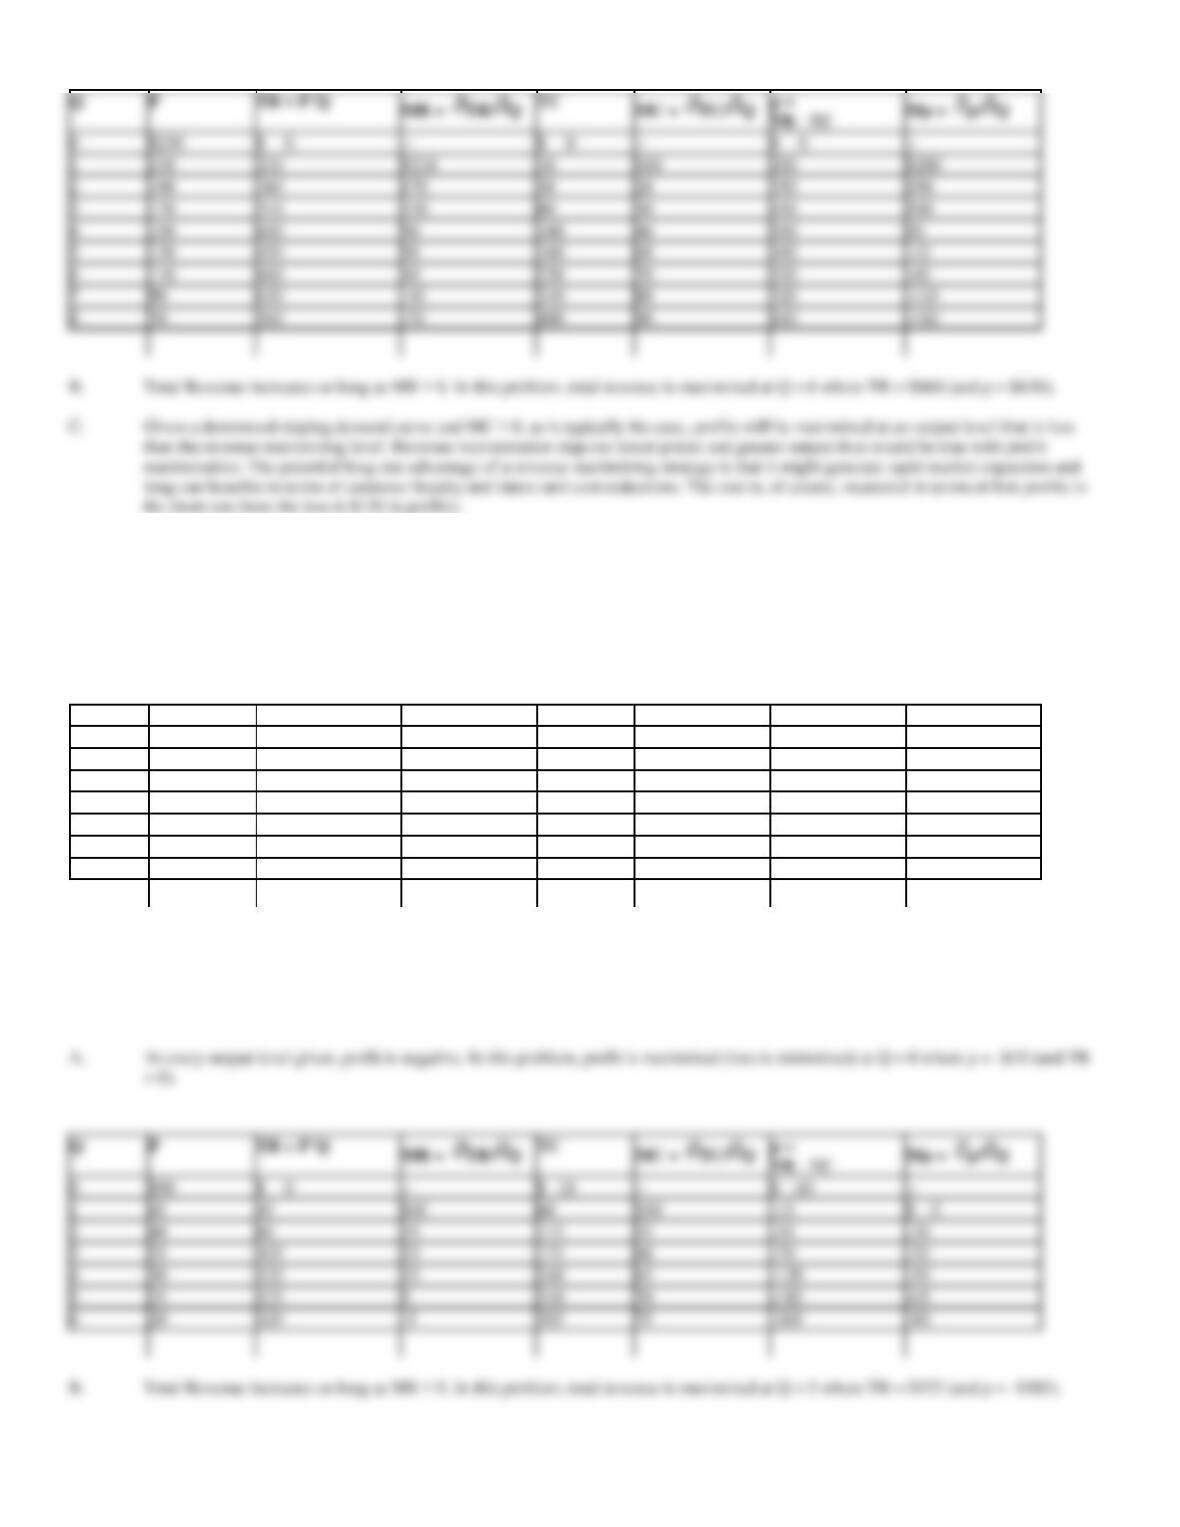
Profit increases so long as MR > MC and Mp > 0. In this problem, profit is maximized at Q = 4 where p = 500 (and TR = $600).
0
$160
$ 0
—
$ 0
—
—
1
150
150
$150
25
$25
125
$125
2
140
280
130
55
30
225
100
3
130
390
110
90
35
300
75
4
120
480
90
130
40
350
50
5
110
175
45
6
110
600
50
230
55
370
–5
7
90
290
60
–30
8
80
640
10
355
65
285
–55
9
70
630
–10
430
75
200
–85
10
60
600
–30
525
95
75
-125
B.
Total Revenue increases so long as MR > 0. In this problem, revenue is maximized at Q = 8 where TR = $640 (and p = $285).
the short-run (here the loss is $90 in profits).
32. Profit Maximization. Fill in the missing data for price (P), total revenue (TR), marginal revenue (MR),
total cost (TC), marginal cost (MC), profit (p), and marginal profit (Mp) in the following table.
Q
P
TR
MR
TC
MC
p
Mp
0
$50
$ 0
$—
$ 10
$—
$ –10
$—
1
45
45
45
60
50
–15
-5
2
40
35
115
–35
3
35
175
60
–35
4
120
15
65
-120
–50
5
25
5
310
–65
6
20
-5
75
–80
A.
At what output (Q) level is profit maximized (or losses minimized)? Explain.
B.
At what output (Q) level is revenue maximized?
0
$50
$ 0
—
$ 10
—
$ -10
—
1
45
60
$50
–15
$ –5
2
40
115
55
–35
–20
3
35
175
60
–70
–35
4
30
240
65
-120
–50
5
25
310
70
-185
–65
6
20
–5
385
75
-265
–80
0
$230
$ 0
—
$ 0
—
$ 0
—
1
210
$210
10
$10
$200
2
190
30
20
3
170
60
30
4
150
100
40
5
130
160
60
–10
6
110
230
70
–60
7
90
–30
310
80
-110
8
70
–70
400
90
-160
B.
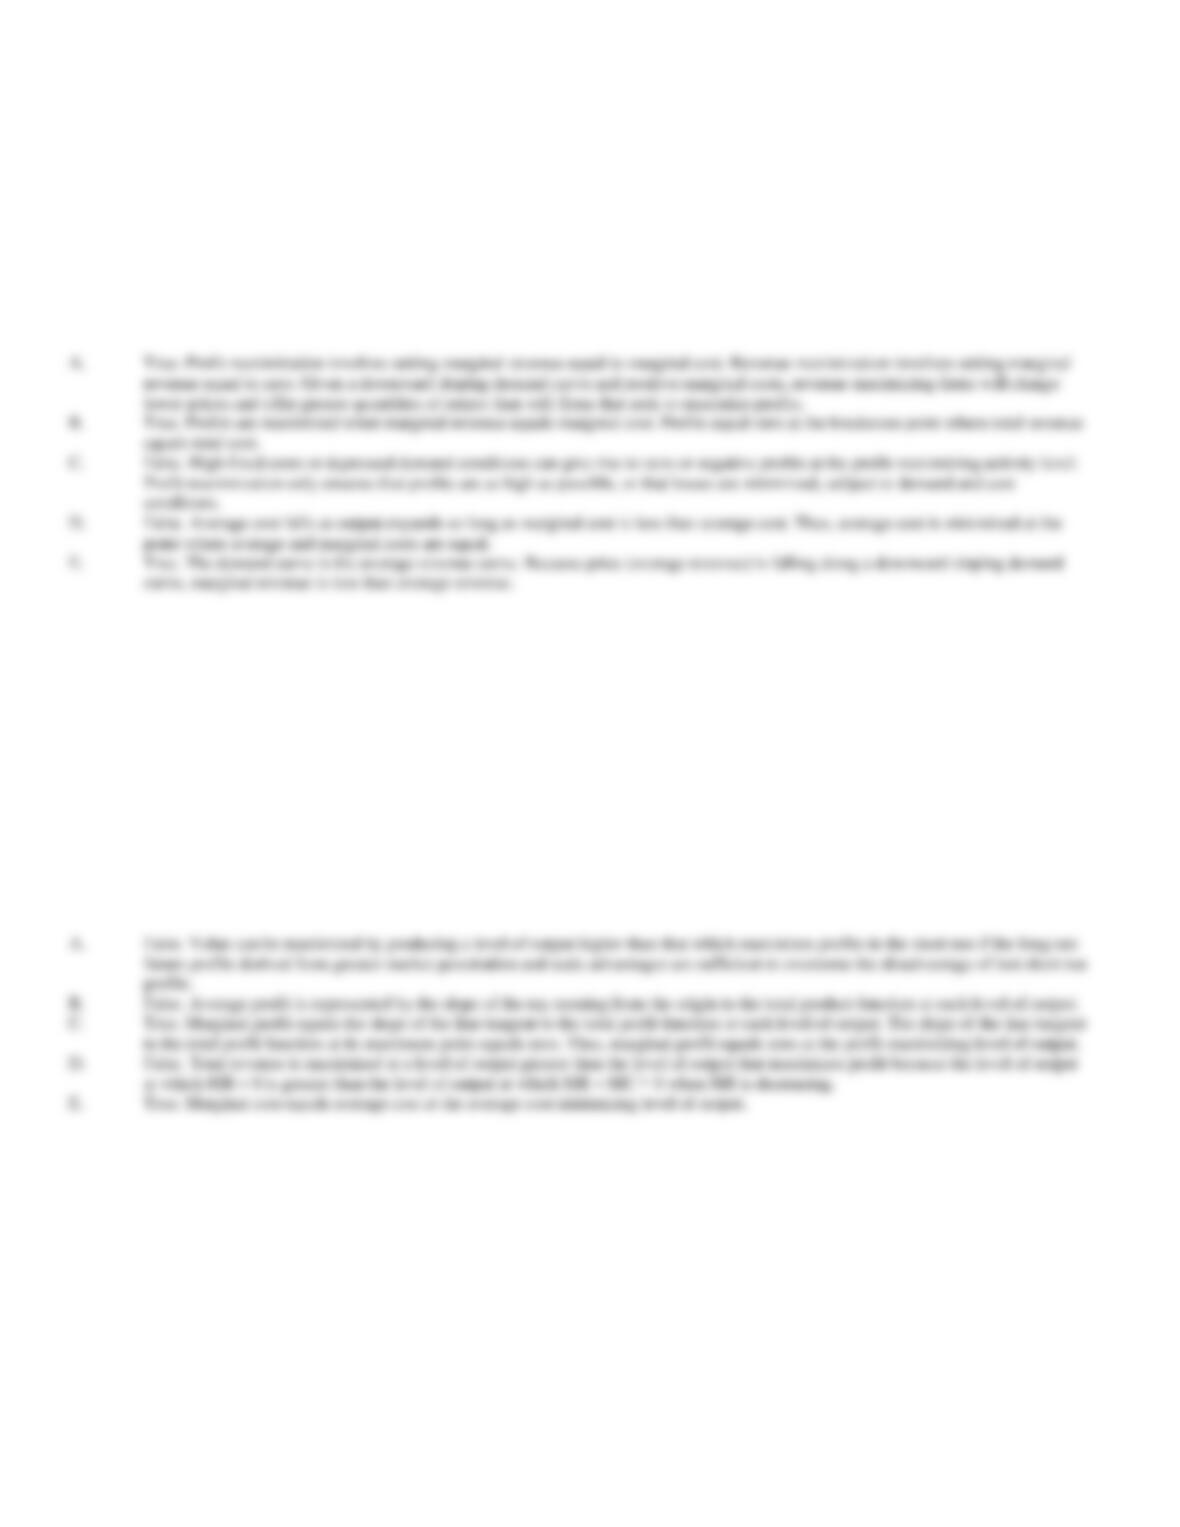
Total Revenue increases so long as MR > 0. In this problem, total revenue is maximized at Q = 6 where TR = $660 (and p = $430).
the short-run (here the loss is $130 in profits).
33. Marginal Analysis. Characterize each of the following statements as true or false, and explain your answer.
A.
Given a downward-sloping demand curve and positive marginal costs, profit-maximizing firms will always sell less output and at
higher prices than will revenue-maximizing firms.
B.
Profits will be maximized when marginal revenue equals marginal cost.
C.
Total profit is the difference between total revenue and total cost and will always exceed zero at the profit-maximizing activity level.
D.
Marginal cost must be less than average cost at the average cost minimizing output level.
E.
The demand curve will be downward sloping if marginal revenue is less than price.
34. Optimization. Describe each of the following statements as true or false, and explain your answer.
A.
To maximize the value of the firm, management should always produce the level of output that maximizes short run profit.
B.
Average profit equals the slope of the line tangent to the total product function at each level of output.
C.
Marginal profit equals zero at the profit maximizing level of output.
D.
To maximize profit, total revenue must also be maximized.
E.
Marginal cost equals average cost at the average cost minimizing level of output.
B.
False. Average profit is represented by the slope of the ray running from the origin to the total product function at each level of output.
D.
False. Total revenue is maximized at a level of output greater than the level of output that maximizes profit because the level of output
True. Marginal cost equals average cost at the average cost minimizing level of output.
conditions.
True. The demand curve is the average revenue curve. Because price (average revenue) is falling along a downward sloping demand
curve, marginal revenue is less than average revenue.
35. Marginal Analysis: Tables. Bree Van De Camp is a regional sales representative for Snappy Tools, Inc.,
and sells hand tools to auto mechanics in New England states. Van De Camp’s goal is to maximize total
monthly commission income, which is figured at 6.25% of gross sales. In reviewing experience over the past
year, Van De Camp found the following relations between days spent in each state and weekly sales generated.
Days
Maine Sales
New Hampshire Sales
Vermont Sales
0
$ 4,000
$ 3,000
$ 1,900
1
10,000
7,000
5,200
2
15,000
10,600
7,400
3
19,000
13,800
8,600
4
22,000
16,600
9,200
5
24,000
19,000
9,600
6
25,000
21,000
9,800
A.
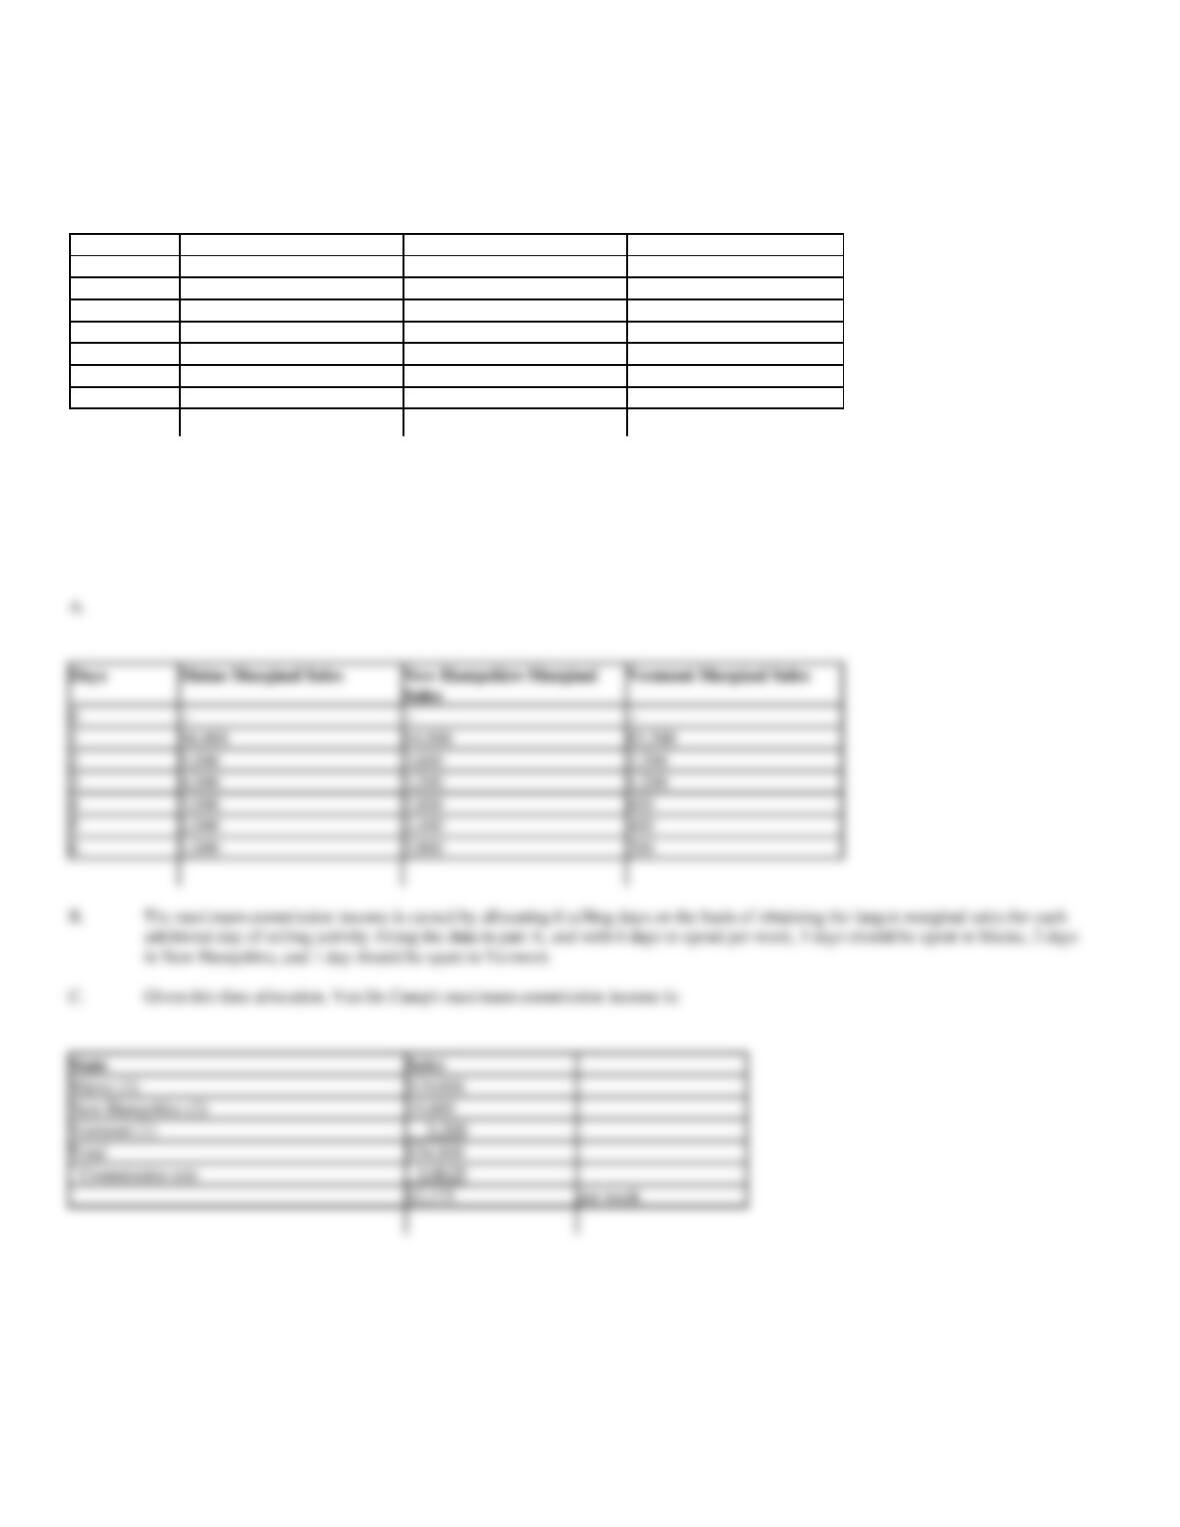
Construct a table showing Van De Camp’s marginal sales per day in each state.
B.
If Van De Camp is limited to 6 selling days per week, how should they be spent?
C.
Calculate Van De Camp’s maximum weekly commission income.
A.
0
1
$6,000
$4,000
$3,300
2
5,000
3,600
2,200
3
4,000
3,200
1,200
4
3,000
2,800
5
2,000
2,400
6
1,000
2,000
C.
Given this time allocation, Van De Camp’s maximum commission income is:
Maine (3)
$19,000
New Hampshire (2)
10,600
Vermont (1)
5,200
Total
$34,800
´ Commission rate
0.0625
$2,175
per week
36. Marginal Analysis: Tables. Susan Mayer is a sales representative for the Desperate Insurance Company,
and sells life insurance policies to individuals in the Phoenix area. Mayer’s goal is to maximize total monthly
commission income, which is figured at 10% of gross sales. In reviewing monthly experience over the past
year, Mayer found the following relations between days spent in each city and monthly sales generated.
Days
Phoenix Sales
Scottsdale Sales
Tempe Sales
0
$ 5,000
$ 7,500
$ 2,500
1
15,000
15,000
6,500
2
23,000
21,500
9,500
3
29,000
27,000
11,500
4
33,000
31,500
12,500
5
35,000
35,000
12,500
6
35,000
37,500
12,500
7
35,000
39,000
12,500
A.
Construct a table showing Mayer’s marginal sales per day in each city.
B.
If administrative duties limit Mayer to only 10 selling days per month, how should she spend them?
C.
Calculate Mayer’s maximum monthly commission income.
Days
Phoenix Marginal Sales
Scottsdale Marginal Sales
Tempe Marginal Sales
0
1
$10,000
$7,500
$4,000
2
8,000
6,500
3,000
3
6,000
5,500
2,000
4
4,000
4,500
1,000
5
2,000
3,500
0
6
0
2,500
0
7
0
1,500
0
C.
Given this time allocation, Mayer’s maximum commission income is:
Phoenix (4)
$33,000
Scottsdale (5)
35,000
Tempe (1)
6,500
Total
$74,500
´ Commission rate
0.10
$ 7,450
per month
37. Marginal Analysis: Tables. Lynette Scavo is a telemarketing manager for Laser Supply, Inc., which sells
replacement chemicals to businesses with copy machines. Scavo’s goal is to maximize total monthly
commission income, which is figured at 5% of gross sales of per telemarketer. In reviewing monthly experience
over the past year, Scavo found the following relations between worker-hours spent in each market segment and
monthly sales generated.
Businesses with less
than 250 employees
Businesses with
250-500 employees
Businesses with
over 500 employees
Worker-
hours
Gross Sales
Worker-
hours
Gross Sales
Worker-
hours
Gross Sales
0
$18,000
0
$15,000
0
$21,000
100
25,500
100
24,000
100
27,000
200
32,100
200
31,500
200
31,500
300
37,800
300
37,500
300
34,500
400
42,600
400
42,000
400
36,900
500
46,500
500
45,000
500
37.700
600
49,500
600
46,500
600
40,200
700
51,600
700
46,500
700
41,100
A.
Construct a table showing Scavo’s marginal sales per 100 worker-hours in each market segment.
B.
Scavo employs telemarketers for 1,000 worker-hours per month, how should their hours be allocated among market segments?
C.
Calculate Scavo’s maximum monthly commission income.
Worker-
hours
Marginal Sales
Worker-
hours
Marginal Sales
Worker-
hours
Marginal Sales
0
0
0
100
$7,500
100
$9,000
100
$6,000
200
6,600
200
7,500
200
4,500
300
5,700
300
6,000
300
3,000
400
4,800
400
4,500
400
2,400
500
3,900
500
3,000
500
1,800
600
3,000
600
1,500
600
1,500
700
2,100
700
0
700
900
C.
Given this time allocation, Scavo’s maximum commission income is:
Less than 250 employees
$ 42,600
42,000
38. Marginal Analysis: Tables. Gabrielle Solis is a regional sales representative for Specialty Books, Inc., and
sells textbooks to universities in Midwestern states. Solis goal is to maximize total monthly commission
income, which is figured at 10% of gross sales. In reviewing monthly experience over the past year, Solis found
the following relations between days spent in each state and monthly sales generated:
Kansas
Oklahoma
Nebraska
Days
Gross Sales
Days
Gross Sales
Days
Gross Sales
0
$ 8,000
0
$ 2,000
0
$ 4,000
1
16,000
1
6,000
1
14,000
2
22,400
2
9,200
2
22,000
3
27,200
3
11,600
3
28,000
4
31,600
4
13,200
4
32,400
5
34,000
5
14,000
5
35,600
6
35,200
6
14,400
6
37,600
7
35,600
7
14,400
7
38,400
A.
Construct a table showing Solis marginal sales per day in each state.
B.
If administrative duties limit Solis to only 15 selling days per month, how should he spend them?
C.
Calculate Solis maximum monthly commission income.
A.
Kansas
Oklahoma
Nebraska
0
0
0
1
$8,000
1
$4,000
1
$10,000
2
6,400
2
3,200
2
8,000
3
4,800
3
2,400
3
6,000
4
4,400
4
1,600
4
4,400
5
2,400
5
5
3,200
6
1,200
6
6
2,000
7
7
7
C.
Given this time allocation, Solis’ maximum commission income is:
Kansas
$34,000
Oklahoma
13,200
Nebraska
37,600
Total
$84,800
´ Commission rate
0.10
$ 8,480
per month