Unlock document.
This document is partially blurred.
Unlock all pages and 1 million more documents.
Get Access
Good Y
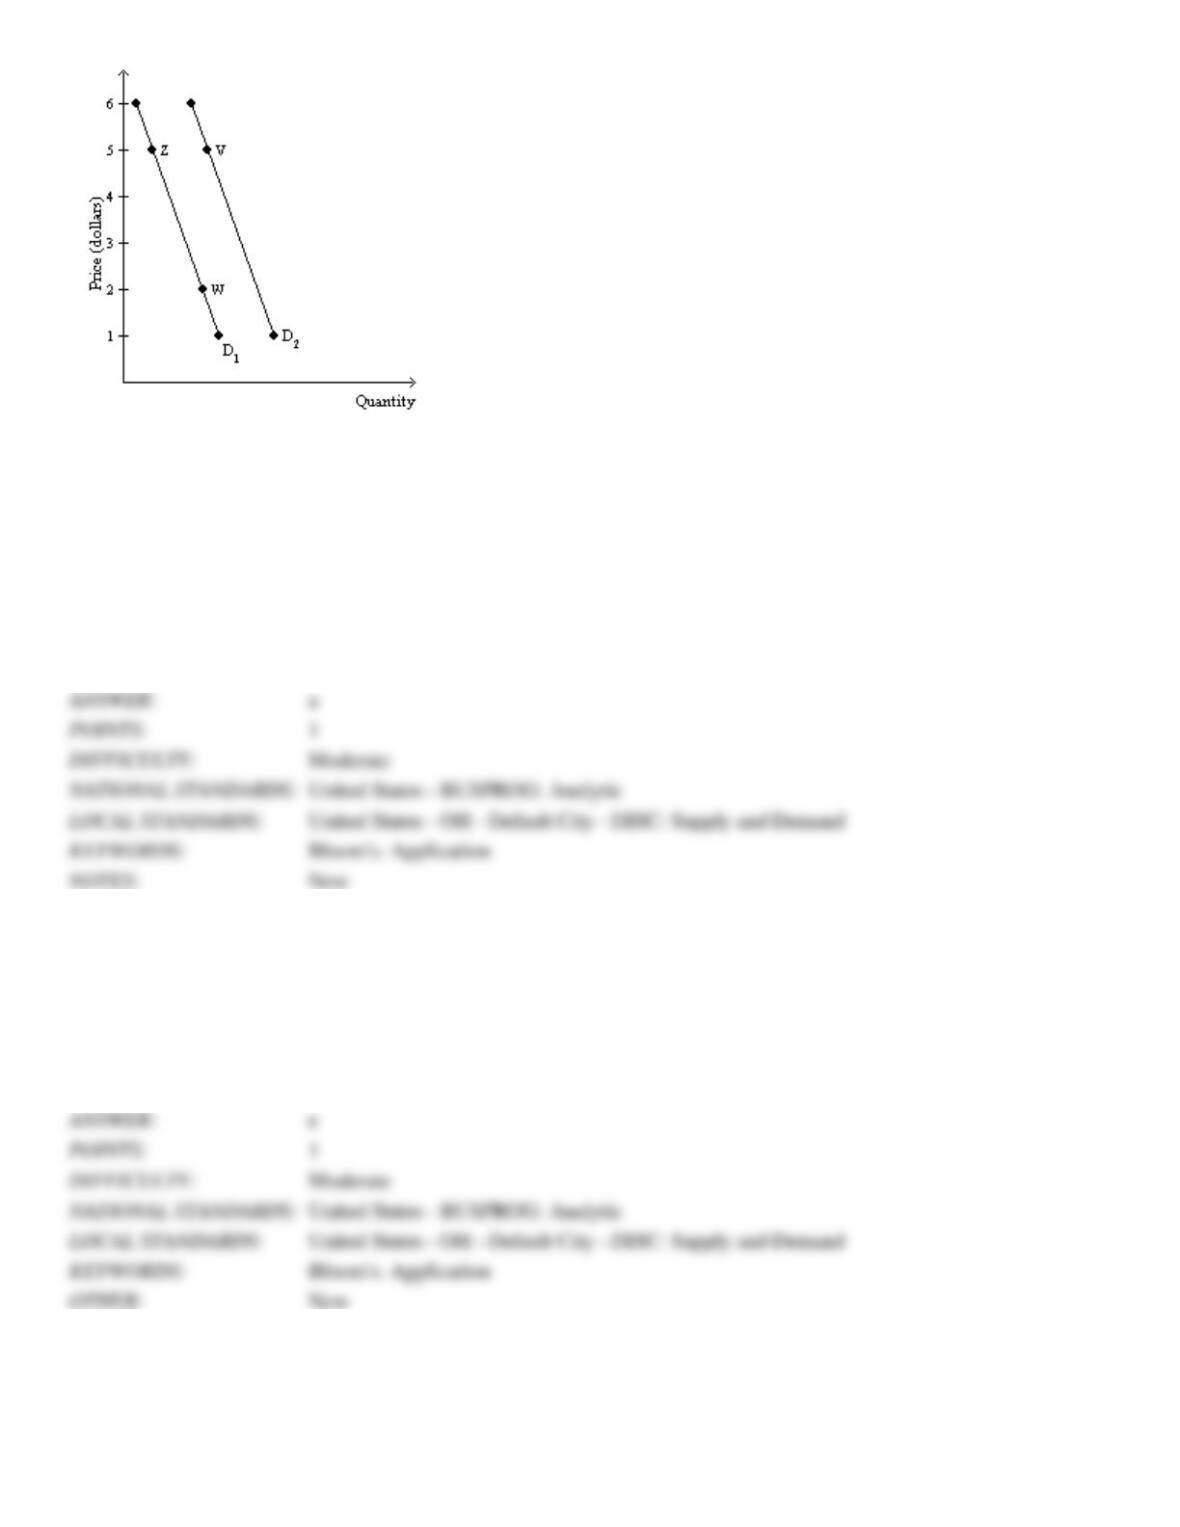
73. Refer to Exhibit 3-3. A movement from point Z to point W would have been the result of
a.
a reduction in the price of good Y.
b.
an increase in taxes paid by the producers of good Y.
c.
a decline in technology in the production of good Y.
d.
an increase in the number of buyers of good Y.
74. Refer to Exhibit 3-3. A movement from point W to point Z would have been the result of
a.
a reduction in the price of good Y.
b.
an increase in the number of buyers in the area where good Y is being sold.
c.
a decrease in business taxes paid by the producers of good Y.
d.
a decrease in the number of buyers in the area where good Y is being sold.
e.
an increase in the price of good Y.
75. Refer to Exhibit 3-3. A movement from point V to point W could not have been the result of
a.
a increase in the price of good Y.
b.
an increase in good Y buyers’ income (assuming that good Y is an inferior good).
c.
an increase in the price of a complement to good Y.
d.
a decrease in the number of buyers of good Y.
e.
a decrease in good Y buyers’ income (assuming that good Y is a normal good).
76. Refer to Exhibit 3-3. A shift in demand from D1 to D2 can NOT occur from a change in the
a.
population.
b.
price of a substitute for good Y.
c.
average income of good Y buyers.
d.
price of good Y.
77. If the supply of and demand for a product decrease at the same time, then equilibrium
a.
quantity and equilibrium price must both decline.
b.
quantity must decline, but equilibrium price may either rise, fall, or remain unchanged.
c.
price must fall, but equilibrium quantity may either rise, fall, or remain unchanged.
d.
quantity must fall and equilibrium price must rise.
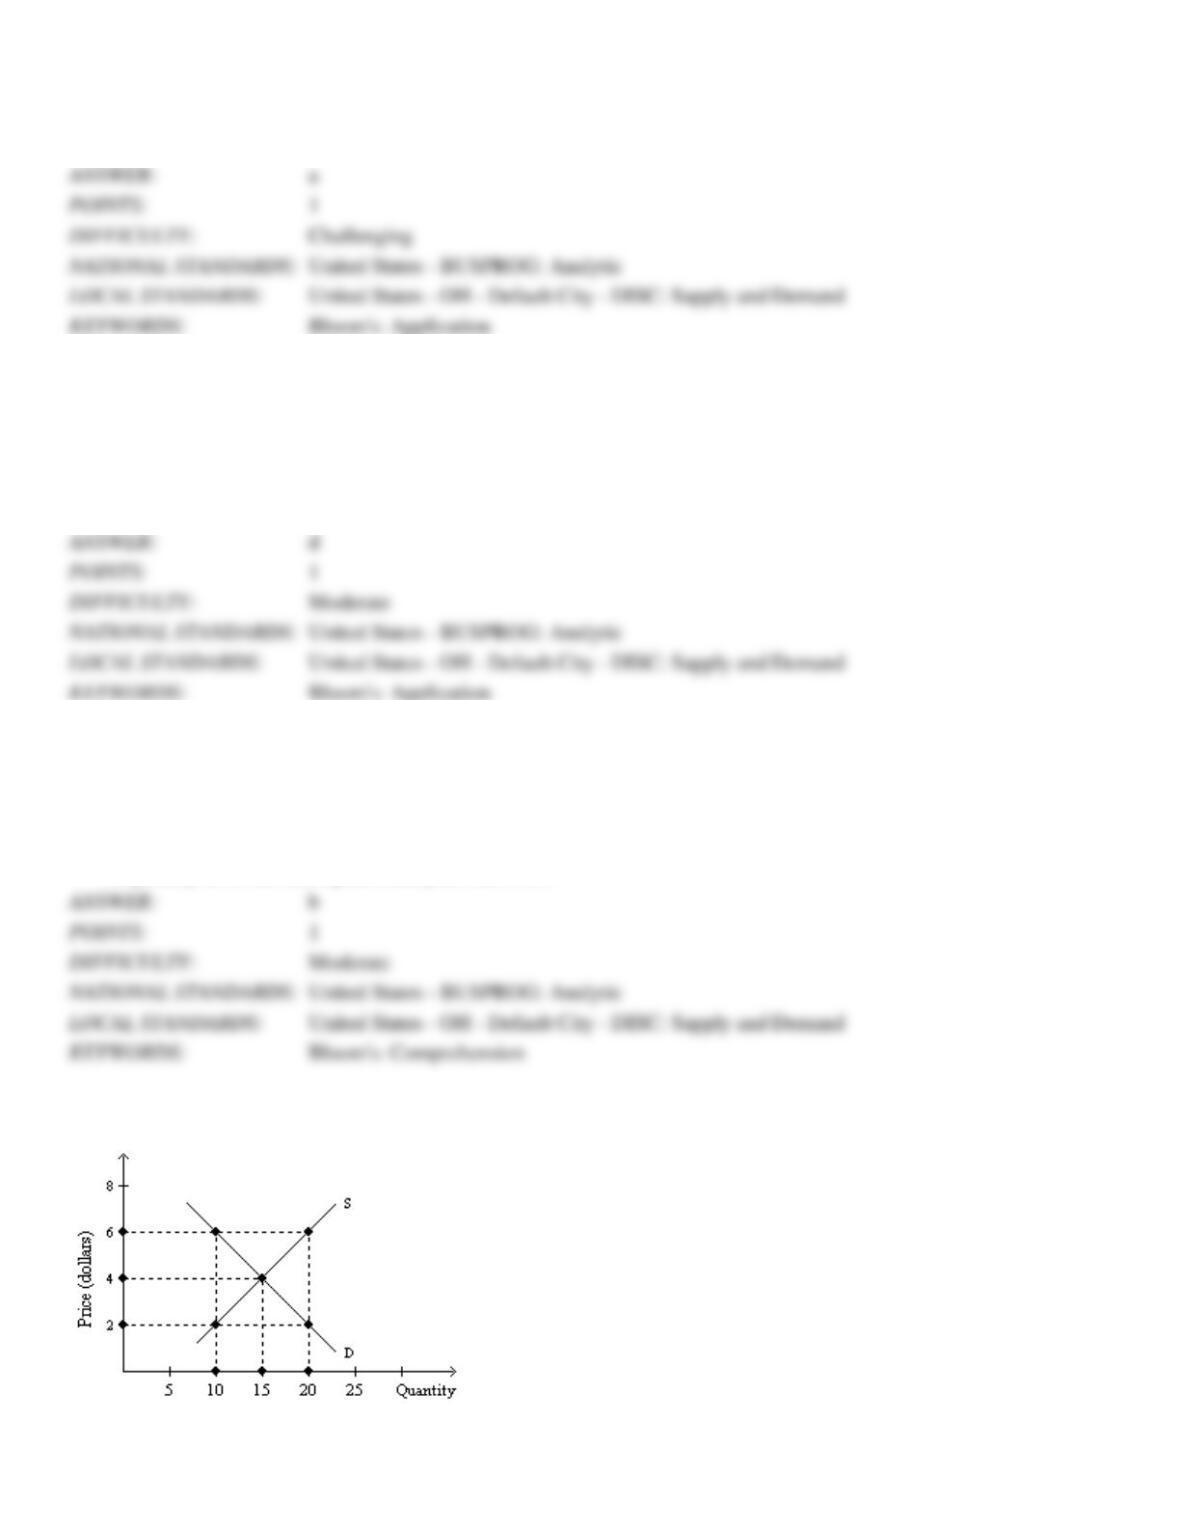
Exhibit 3-4
78. Refer to Exhibit 3-4. A price of $6 in the market will result in a
a.
shortage of 10 units.
b.
surplus of 10 units.
c.
surplus of 5 units.
d.
shortage of 5 units.
79. Refer to Exhibit 3-4. At a price of $2 _______________ units will be exchanged.
a.
5
b.
10
c.
15
d.
20
80. Refer to Exhibit 3-4. At a price of $6 _______________ units will be exchanged.
a.
5
b.
10
c.
15
d.
20
81. Refer to Exhibit 3-4. A price of $2 in the market will result in a
a.
shortage of 10 units.
b.
surplus of 10 units.
c.
surplus of 5 units.
d.
shortage of 5 units.
82. Refer to Exhibit 3-4. If this is a competitive market, price and quantity will gravitate toward
a.
$6 and 10 units, respectively.
b.
$6 and 20 units, respectively.
c.
$4 and 15 units, respectively.
d.
$2 and 15 units, respectively.
83. Refer to Exhibit 3-4. A price of $4 in the market will result in a
a.
shortage of 10 units.
b.
surplus of 10 units.
c.
surplus of 5 units.
d.
shortage of 5 units.
e.
none of the above
84. Given that frozen yogurt and ice cream are substitutes, a shift in preferences in favor of yogurt would be predicted to
do all of the following EXCEPT
a.
raise the equilibrium price of frozen yogurt.
b.
increase the quantity supplied of frozen yogurt.
c.
increase the supply of ice cream.
d.
increase the demand for frozen yogurt.
85. A decrease in the expected price of corn would likely do the following to the current supply and demand for corn:
a.
increase both the demand and the supply.
b.
decrease both the demand and the supply.
c.
increase the demand, but decrease the supply.
d.
increase the supply, but decrease the demand.
86. An increase in the expected price of corn would likely do the following to the current supply and demand for corn:
a.
increase both the demand and the supply.
b.
decrease both the demand and the supply.
c.
increase the demand, but decrease the supply.
d.
increase the supply, but decrease the demand.
87. In moving along a demand curve for good X, which of the following is NOT held constant?
a.
the prices of substitute goods for good X
b.
the prices of complementary goods for good X
c.
incomes of consumers of good X
d.
the price of good X
88. An "increase in the quantity demanded" means that
a.
the demand curve has shifted to the right.
b.
the supply curve has shifted to the left.
c.
price has declined and consumers therefore want to purchase more of the good.
d.
given supply, the price of the good can be expected to rise.
89. A "decrease in the quantity demanded" means that
a.
the demand curve has shifted to the right.
b.
the supply curve has shifted to the left.
c.
price has declined and consumers therefore want to purchase more of the good.
d.
price has increased and consumers therefore want to purchase less of the good.
90. An "increase in demand" means that
a.
the demand curve has shifted to the left.
b.
price has declined and consumers want to purchase more of the good.
c.
the demand curve has shifted to the right.
d.
the price of the good can be expected to decline, assuming supply stays constant.
91. A "decrease in demand" means that
a.
the demand curve has shifted to the left.
b.
price has declined and consumers want to purchase more of the good.
c.
the demand curve has shifted to the right.
d.
the price of the good can be expected to decline, assuming supply stays constant.
Exhibit 3-5
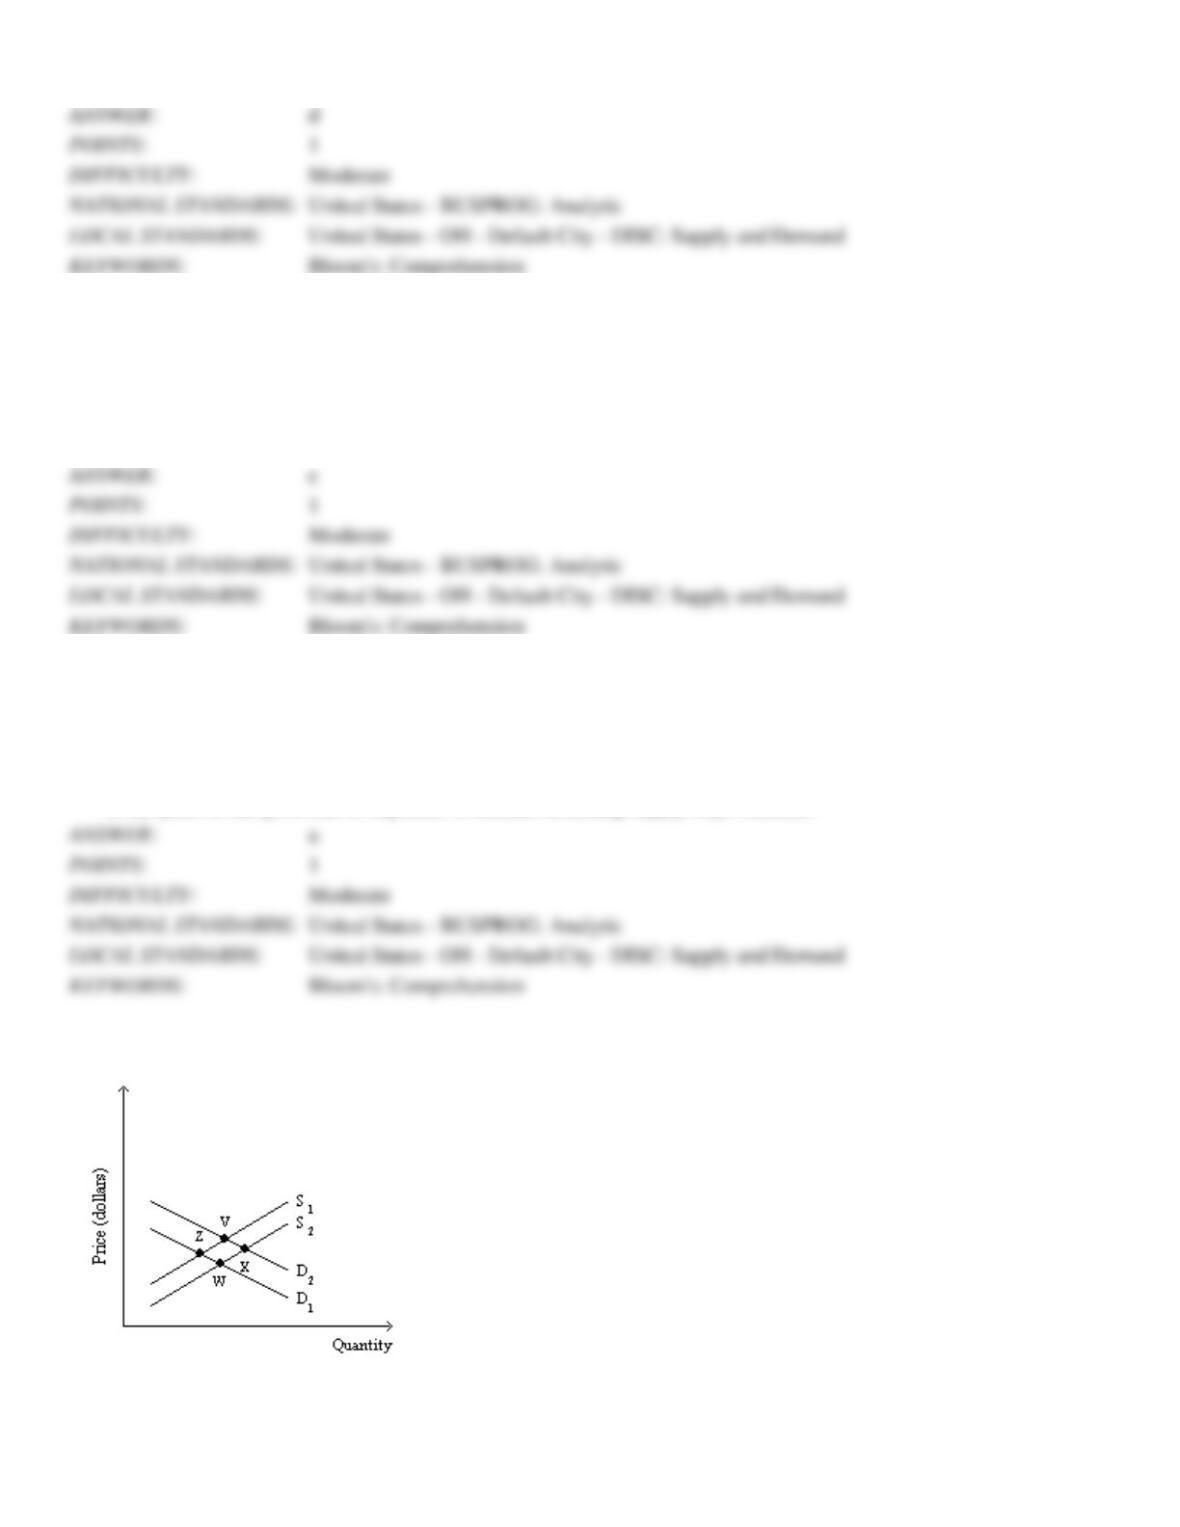
92. Refer to Exhibit 3-5. In the market shown, if equilibrium was originally at point Z and the new equilibrium is now at
point V, this change may have been caused by
a.
a decrease in consumers’ income (assuming that this is an inferior good) and a simultaneous decline in
technology in the production of this good.
b.
an increase in consumers’ income (assuming that this is an inferior good) and a simultaneous improvement in
technology in the production of this good.
c.
a decrease in consumers’ income (assuming that this is an inferior good) and no change in supply.
d.
an increase in consumers’ income (assuming that this is an inferior good) and no change in supply.
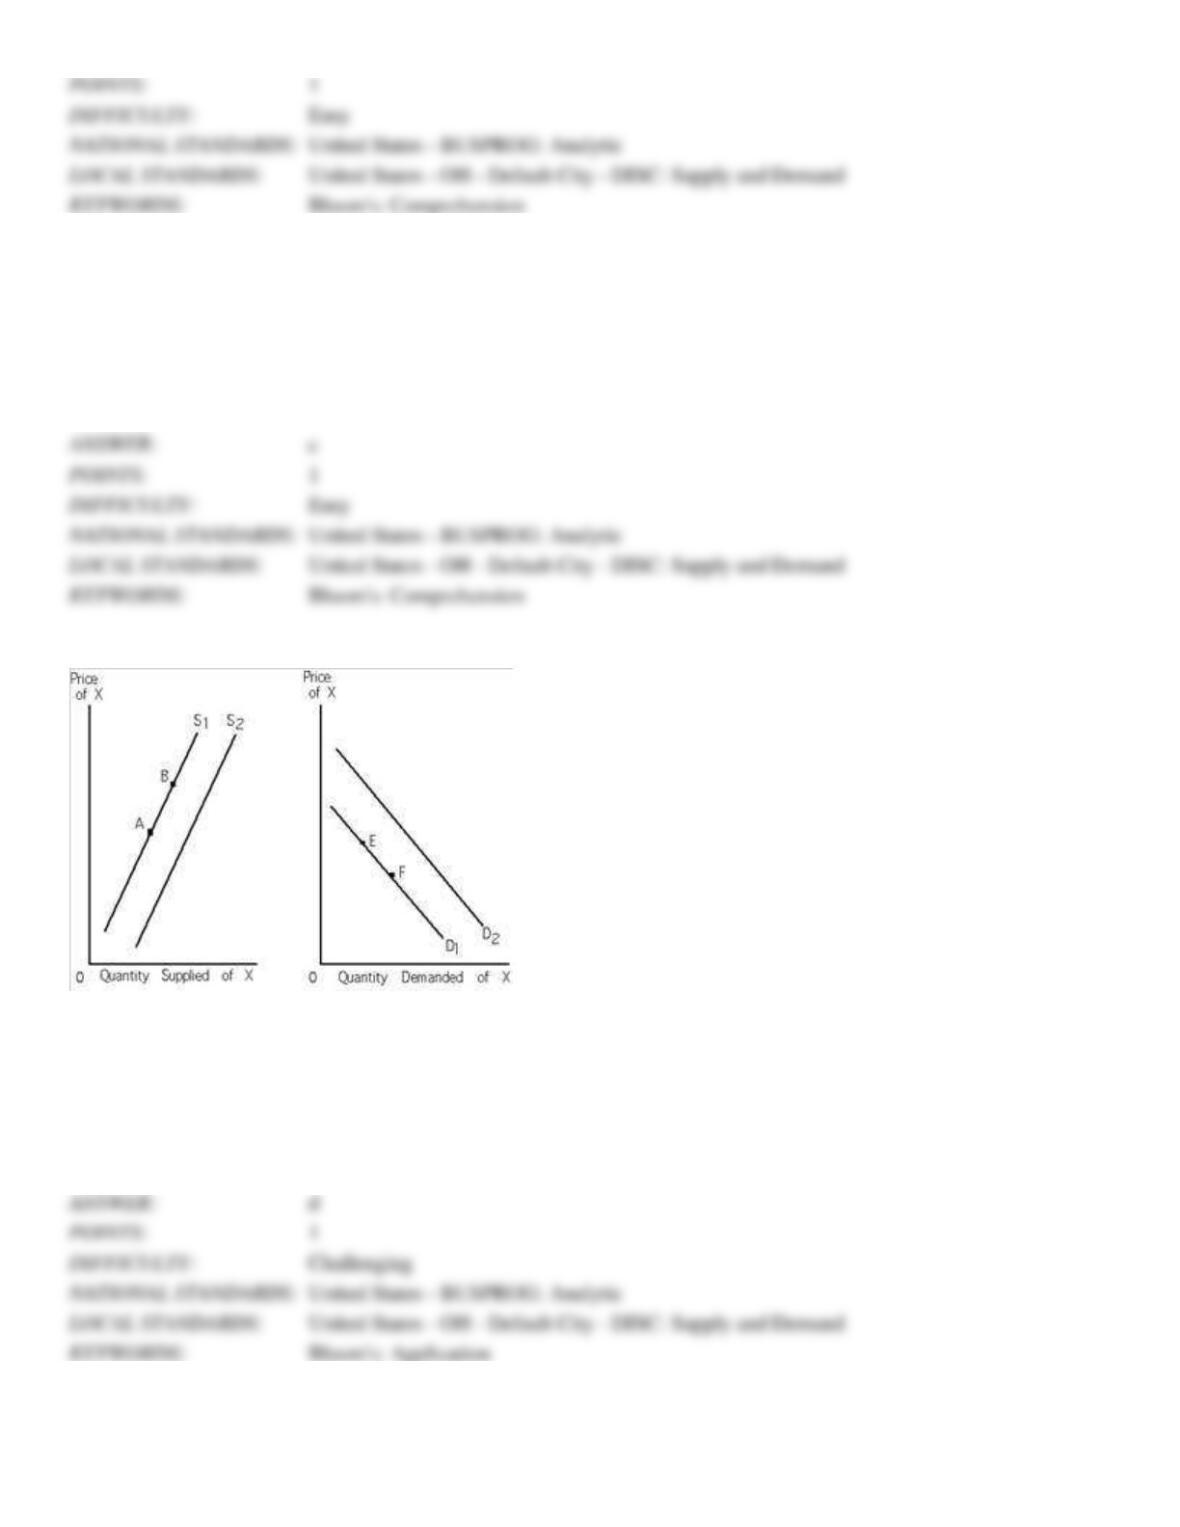
93. Refer to Exhibit 3-5. In the market shown, a rightward shift in supply from S1 to S2 could have been caused by
a.
a decline in the number of buyers in the market.
b.
a decline in the price of a substitute good.
c.
a decrease in income (assuming the good is a normal good).
d.
the granting of a subsidy to the producer.
e.
none of the above
94. Refer to Exhibit 3-5. In the market shown, a rightward shift in demand from D1 to D2 could have been caused by
a.
an increase in the number of sellers in the market.
b.
an improvement in technology in the production of this good.
c.
a decrease in buyers’ income (assuming the good is an inferior good).
d.
a decrease in buyers’ income (assuming the good is a normal good).
e.
a and b
95. Refer to Exhibit 3-5. In the market shown, if equilibrium was originally at point W and is now at point X, the new
equilibrium price is __________ it was originally and the new equilibrium quantity is ____________ it was originally.
a.
greater than; greater than
b.
less than; greater than
c.
greater than; less than
d.
less than; less than
96. Refer to Exhibit 3-5. In the market shown, if equilibrium was originally at point V and is now at point Z, the new
equilibrium price is __________ it was originally and the new equilibrium quantity is ____________ it was originally.
a.
greater than; greater than
b.
less than; greater than
c.
greater than; less than
d.
less than; less than
Exhibit 3-6
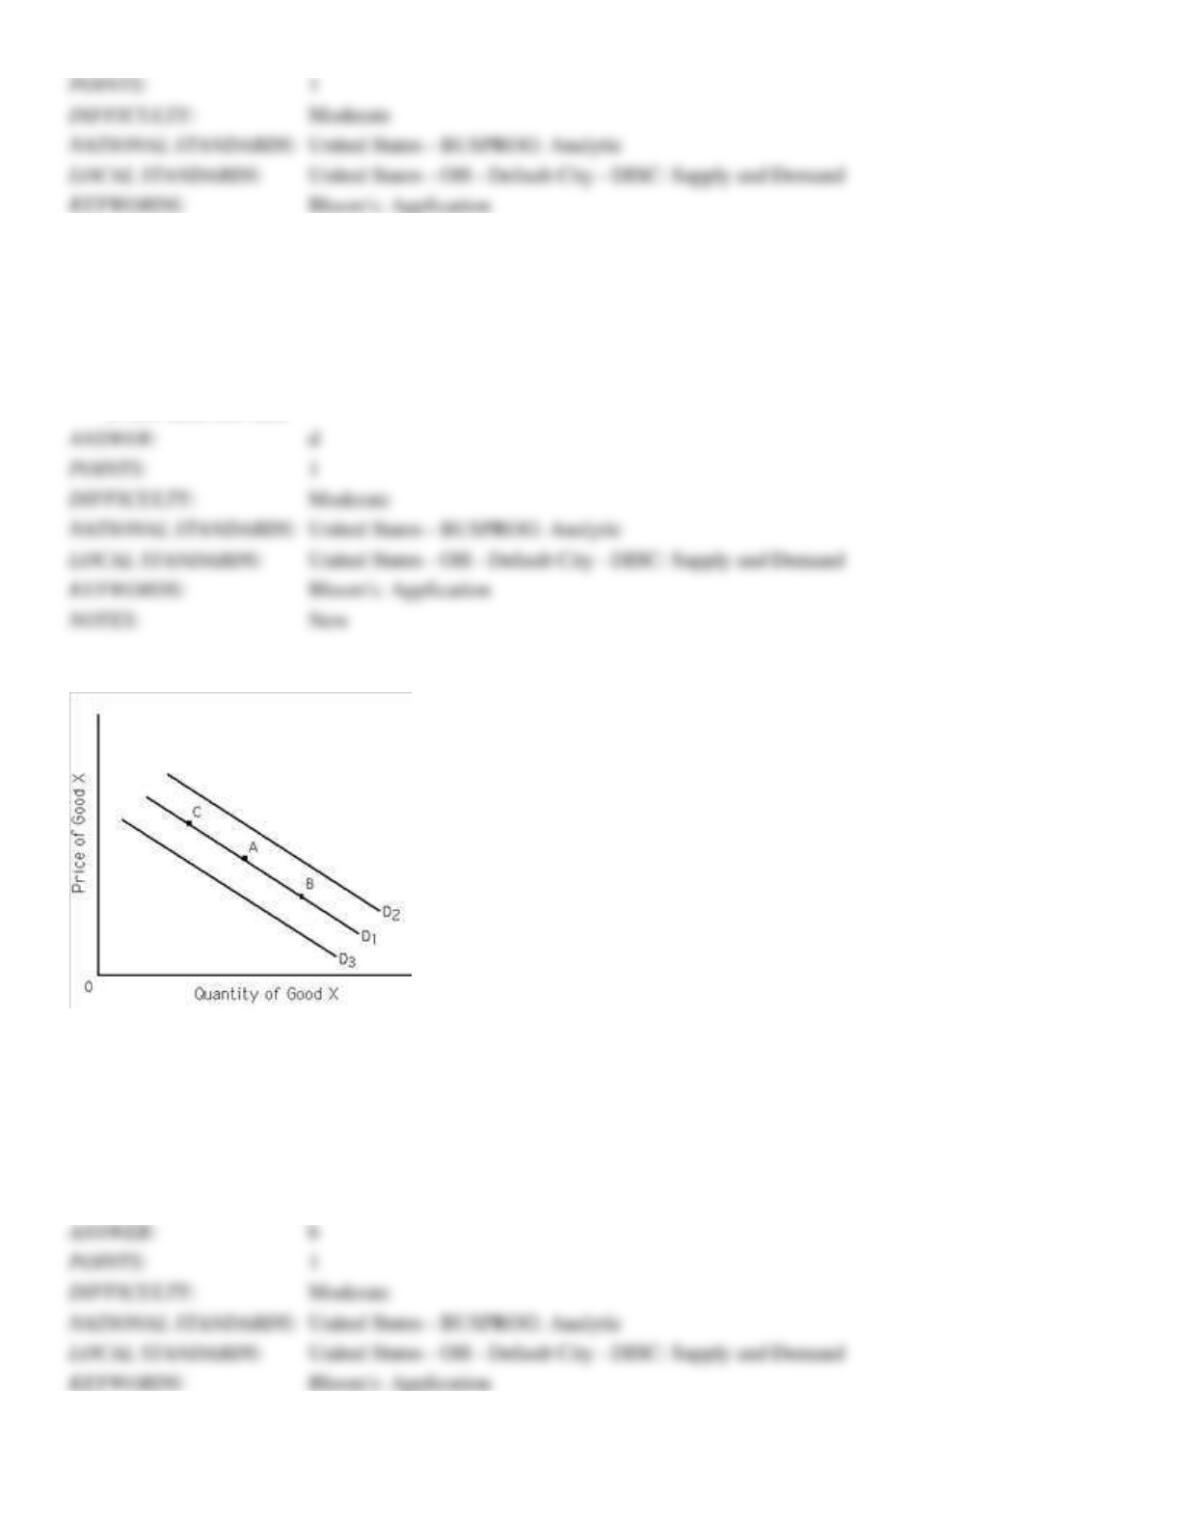
97. Refer to Exhibit 3-6. If an increase in income causes the demand for good X to shift from D1 to D3, then good X is
a.
a normal good.
b.
an inferior good.
c.
a substitute good.
d.
a complementary good.
e.
a neutral good.
98. Refer to Exhibit 3-6. If a decrease in income causes the demand for good X to shift from D1 to D2, then good X is
a.
a normal good.
b.
an inferior good.
c.
a substitute good.
d.
a complementary good.
e.
a neutral good.
99. Refer to Exhibit 3-6. If an increase in income causes the demand for good X to shift from D1 to D2,then good X is
a.
a normal good.
b.
an inferior good.
c.
a substitute good.
d.
a complementary good.
e.
a neutral good.
100. Refer to Exhibit 3-6. If an increase in the price of good Y causes the demand for good X to shift from D1 to D2,
goods X and Y are
a.
normal goods.
b.
inferior goods.
c.
substitutes.
d.
complements.
e.
neutral goods.
101. Refer to Exhibit 3-6. If D1 is the relevant demand curve, a decrease in the price of good X may cause
a.
demand to shift from D1 to D2.
b.
demand to shift from D1 to D3.
c.
a movement along D1 from point A to point B.
d.
a movement along D1 from point A to point C.
102. Refer to Exhibit 3-6. If D1 is the relevant demand curve, an increase in the price of good X may cause
a.
demand to shift from D1 to D2.
b.
demand to shift from D1 to D3.
c.
a movement along D1 from point A to point B.
d.
a movement along D1 from point A to point C.
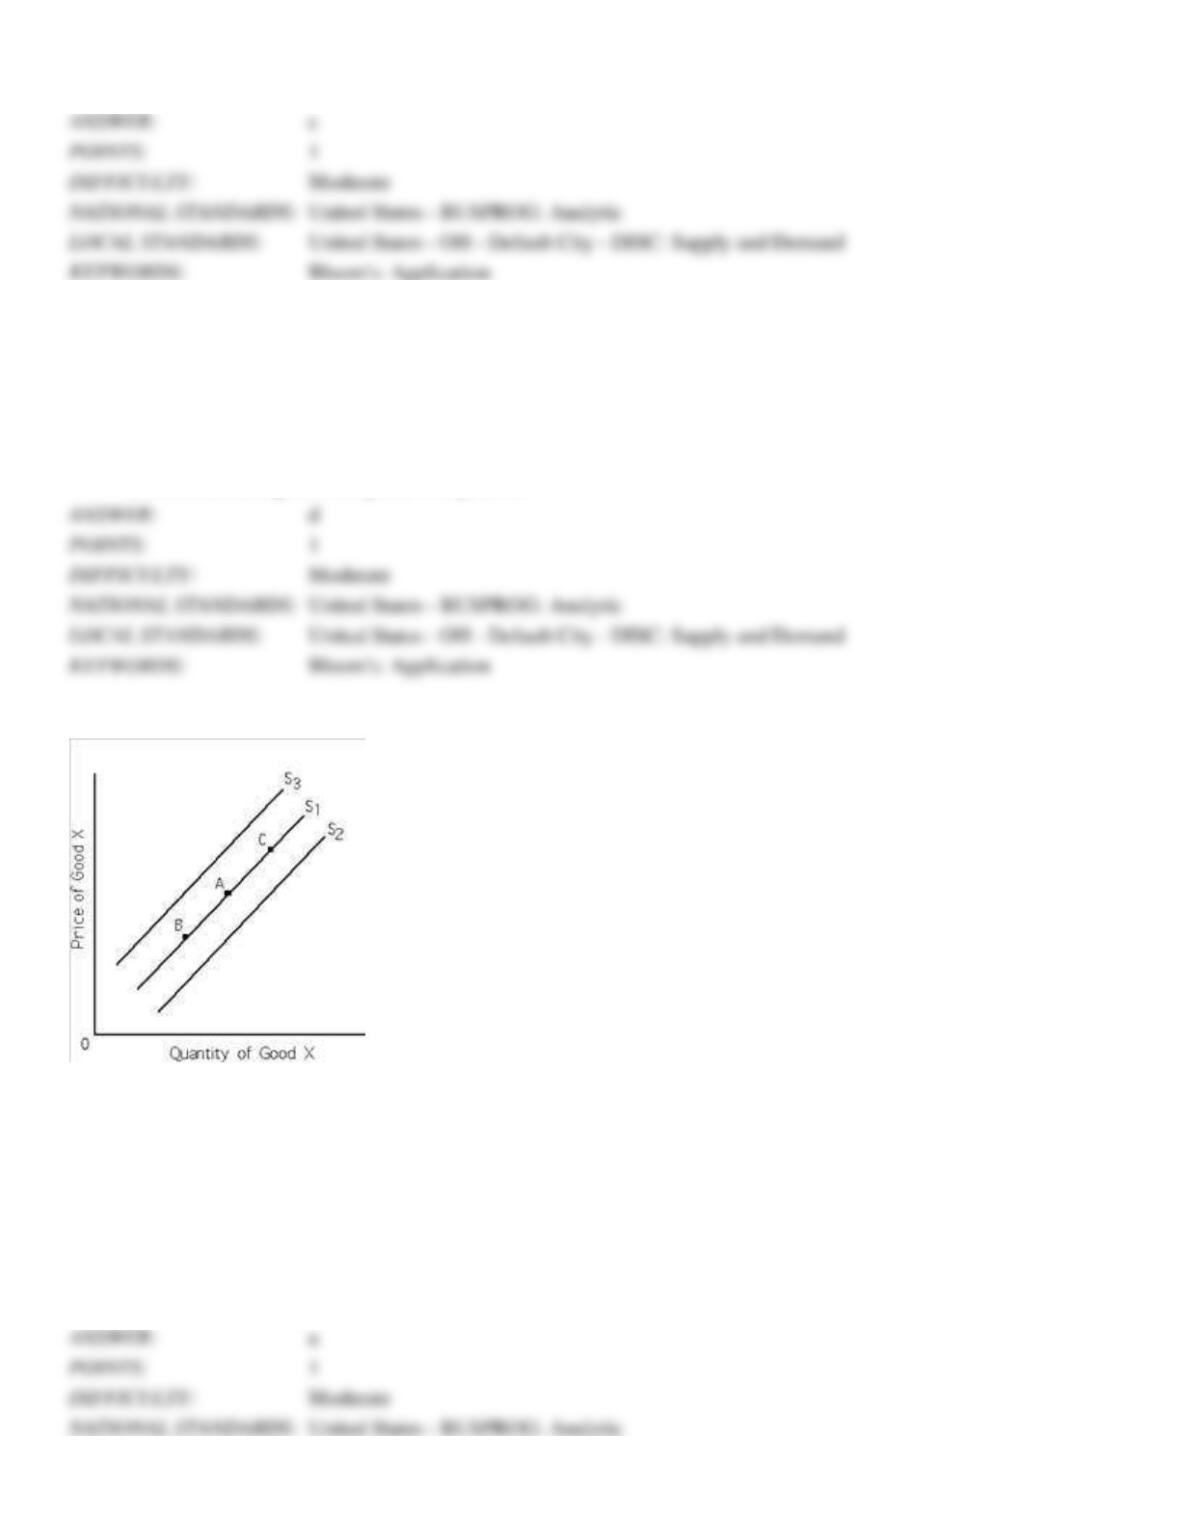
Exhibit 3-7
103. Refer to Exhibit 3-7. If S1 is the relevant supply curve, a decrease in the price of a resource that is necessary for the
production of good X causes
a.
the supply of good X to shift from S1 to S2
b.
the supply of good X to shift from S1 to S3.
c.
a movement along S1 perhaps from point A to point B.
d.
a movement along S1 perhaps from point A to point C.
e.
no change in the supply of good X.
104. Refer to Exhibit 3-7. If S1 is the relevant supply curve, an increase in the price of good X may cause
a.
the supply of good X to shift from S1 to S2
b.
the supply of good X to shift from S1 to S3.
c.
a movement along S1 perhaps from point A to point B.
d.
a movement along S1 perhaps from point A to point C.
e.
no change in the quantity supplied of good X.
105. Refer to Exhibit 3-7. If S1 is the relevant supply curve, a decline in technology in the production of good X causes
a.
the supply of good X to shift from S1 to S2
b.
the supply of good X to shift from S1 to S3.
c.
a movement along S1 perhaps from point A to point B.
d.
a movement along S1 perhaps from point A to point C.
e.
no change in the supply of good X.
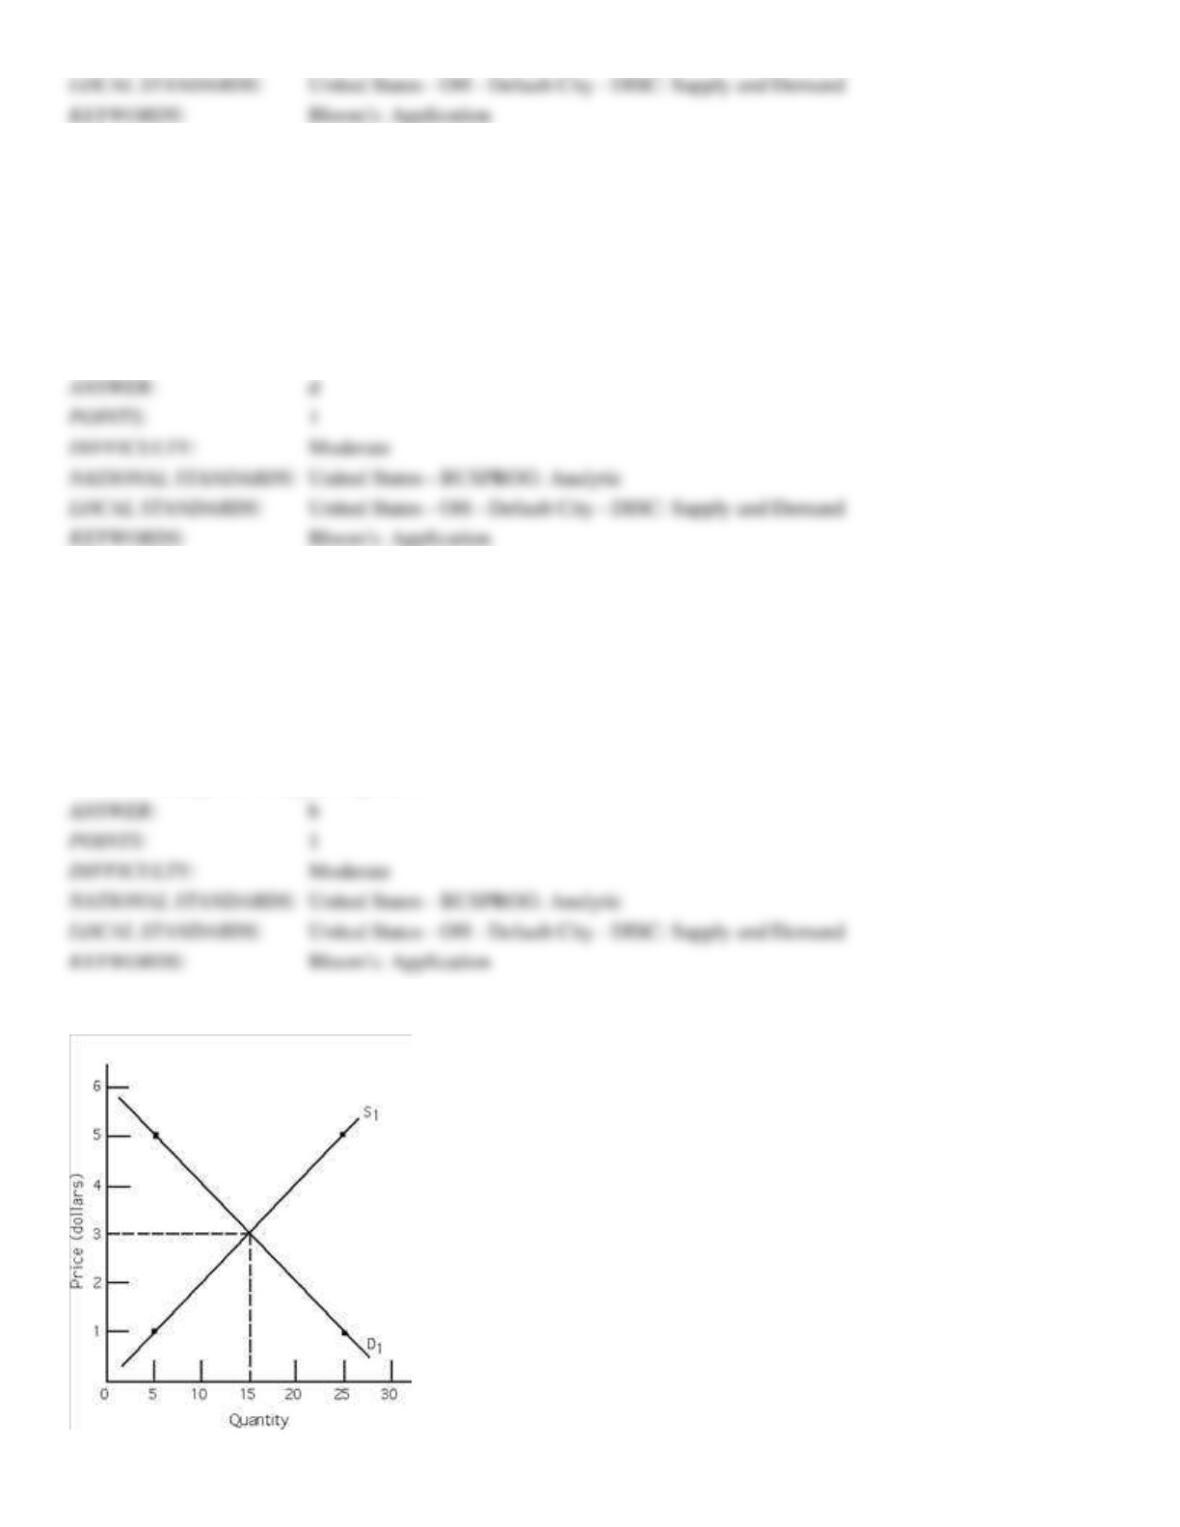
Exhibit 3-8
106. Refer to Exhibit 3-8. Equilibrium price and quantity are ____________________, respectively.
a.
$3 and 25 units
b.
$3 and 15 units
c.
$5 and 15 units
d.
$5 and 25 units
e.
$1 and 25 units
107. Refer to Exhibit 3-8. A price of $5 will result in a ___________________ in this market which will cause the price
of the product to gravitate _______________.
a.
shortage; downward
b.
shortage; upward
c.
surplus; downward
d.
surplus; upward
108. Refer to Exhibit 3-8. A price of $1 will result in a ___________________ in this market which will cause the price
of the product to gravitate ________________.
a.
shortage; downward
b.
shortage; upward
c.
surplus; downward
d.
surplus; upward
109. Refer to Exhibit 3-8. A shortage exists at any price below
a.
$5.00.
b.
$4.50.
c.
$4.00.
d.
$3.50.
e.
$3.00.
110. Refer to Exhibit 3-8. A surplus exists at any price above
a.
$2.00.
b.
$4.50.
c.
$4.00.
d.
$3.50.
e.
$3.00.
Exhibit 3-9
111. Refer to Exhibit 3-9. A severe recession has sharply decreased the incomes of consumers. Knowing that X is a
normal good, you expect a movement in the market for X from
a.
A to B.
b.
E to F.
c.
F to E.
d.
B to A.
112. Refer to Exhibit 3-9. X is produced using input Z. If the price of Z rises, an economist would expect a movement in
the market for X from
a.
E to F.
b.
A to B.
c.
F to E.
d.
B to A.
113. Refer to Exhibit 3-9. Consumers view X and Y as substitutes. If the price of Y increases, an economist would expect
a movement in the market for X from
a.
F to E.
b.
A to B.
c.
E to F.
d.
B to A.
114. Refer to Exhibit 3-9. A wave of immigrants who love to consume X enters the country. An economist would expect a
movement in the market for X from
a.
S1 to S2.
b.
D2 to D1.
c.
D1 to D2.
d.
S2 to S1.
115. Refer to Exhibit 3-9. The production of X is more profitable than it used to be. A number of producers enter the
business of producing X. An economist would expect a movement in the market for X from
a.
S2 to S1.
b.
D2 to D1.
c.
D1 to D2.
d.
S1 to S2.
116. A market is said to be in disequilibrium if
a.
it exhibits either a surplus or a shortage.
b.
the number of units that individuals are willing to buy exceeds the number of units they can afford.
c.
it is a market for an inferior good.
d.
none of the above
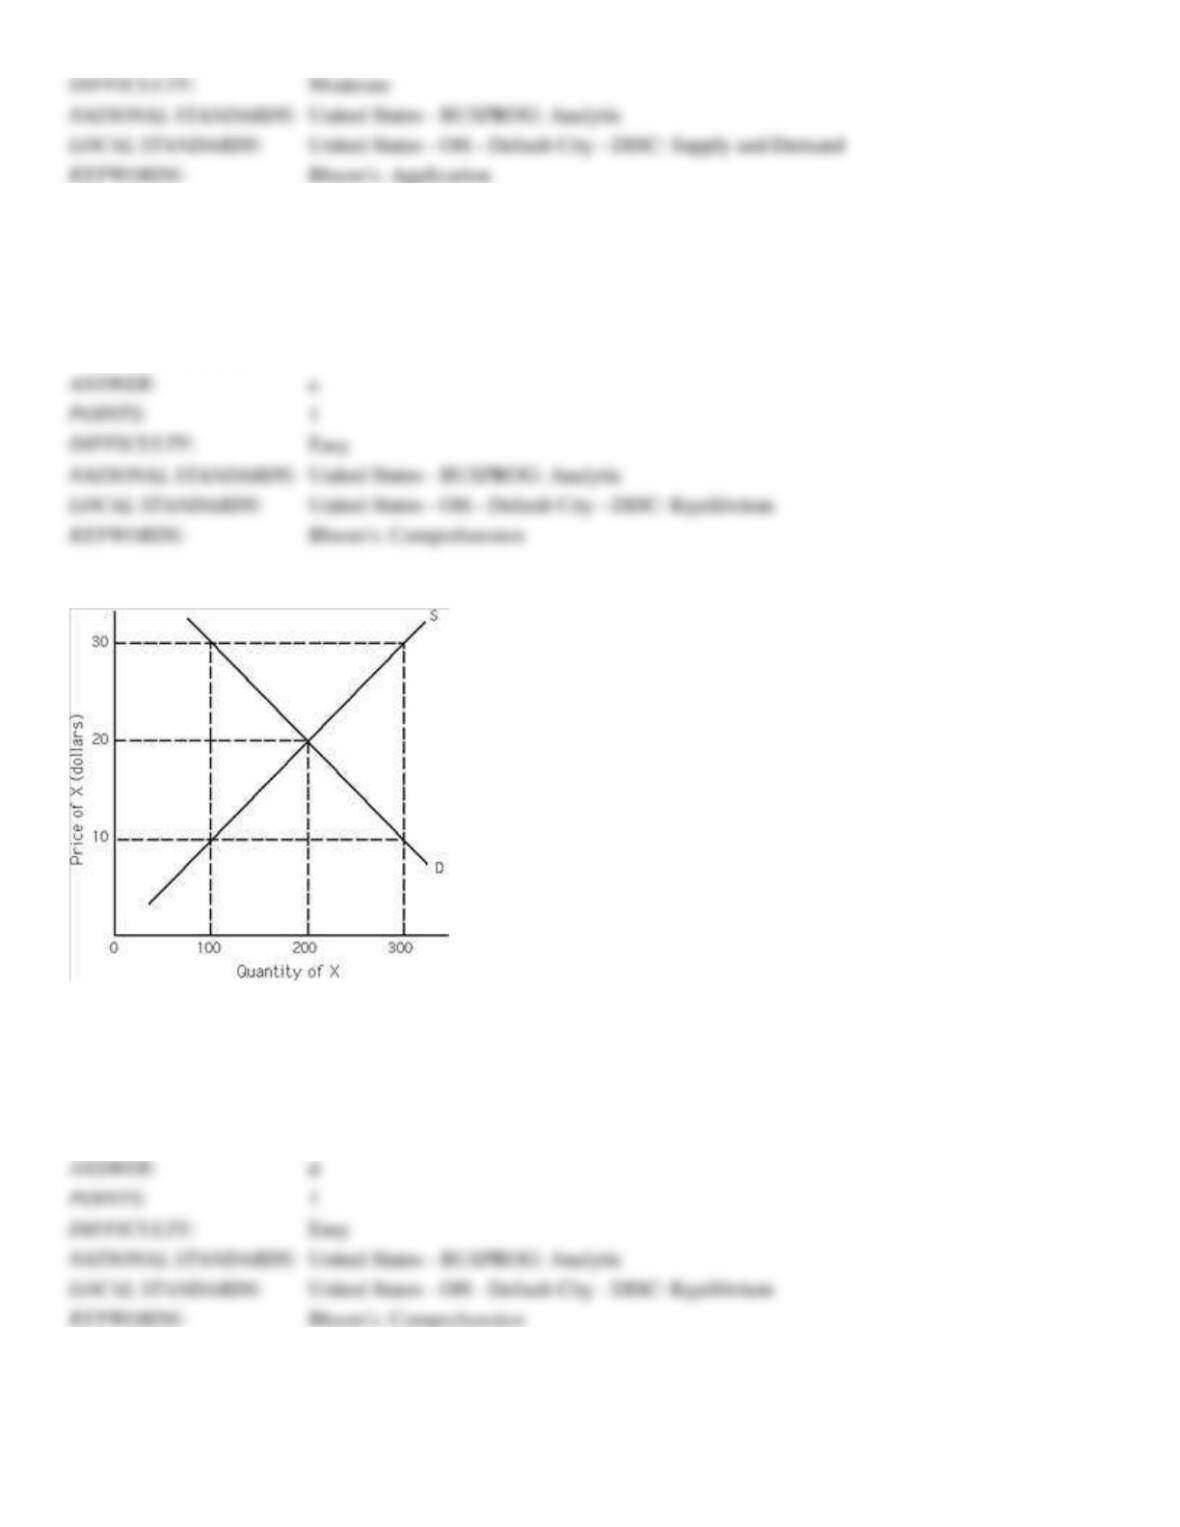
Exhibit 3-10
117. Refer to Exhibit 3-10. $20 is the
a.
equilibrium price.
b.
market-clearing price.
c.
price at which there is neither a surplus nor a shortage.
d.
all of the above
118. Refer to Exhibit 3-10. 300 units of X will be exchanged in this market if the price is
a.
$30.
b.
$20.
c.
$10.
d.
none of the above
119. Refer to Exhibit 3-10. At a price of $10, __________ units of the good will be exchanged.
a.
100
b.
200
c.
300
d.
none of the above
120. Refer to Exhibit 3-10. 100 units of X will be exchanged in this market if the price is
a.
$30.
b.
$20.
c.
$10.
d.
a or c
e.
none of the above
121. Which of the following pairs of goods would be most likely to be complements?
a.
olive oil and vegetable oil
b.
peanuts and peanut butter
c.
DVD's and DVD players
d.
hiking boots and tennis shoes
e.
all of the above
122. Which of the following pairs of goods would be most likely to be substitutes?
a.
pasta and pasta sauce
b.
olive oil and vegetable oil
c.
chips and salsa
d.
tires and automobiles
e.
all of the above
123. An increase in the number of sellers of a good will, ceteris paribus, __________________ for that good.
a.
increase equilibrium price and quantity
b.
increase equilibrium price and decrease equilibrium quantity
c.
decrease equilibrium price and increase equilibrium quantity
d.
decrease equilibrium price and quantity
e.
increase demand
124. A(n) _______________ good is one in which as income rises or falls, there is no change in the demand for the good.
a.
normal
b.
inferior
c.
neutral
d.
substitute
e.
complementary
Exhibit 3-15
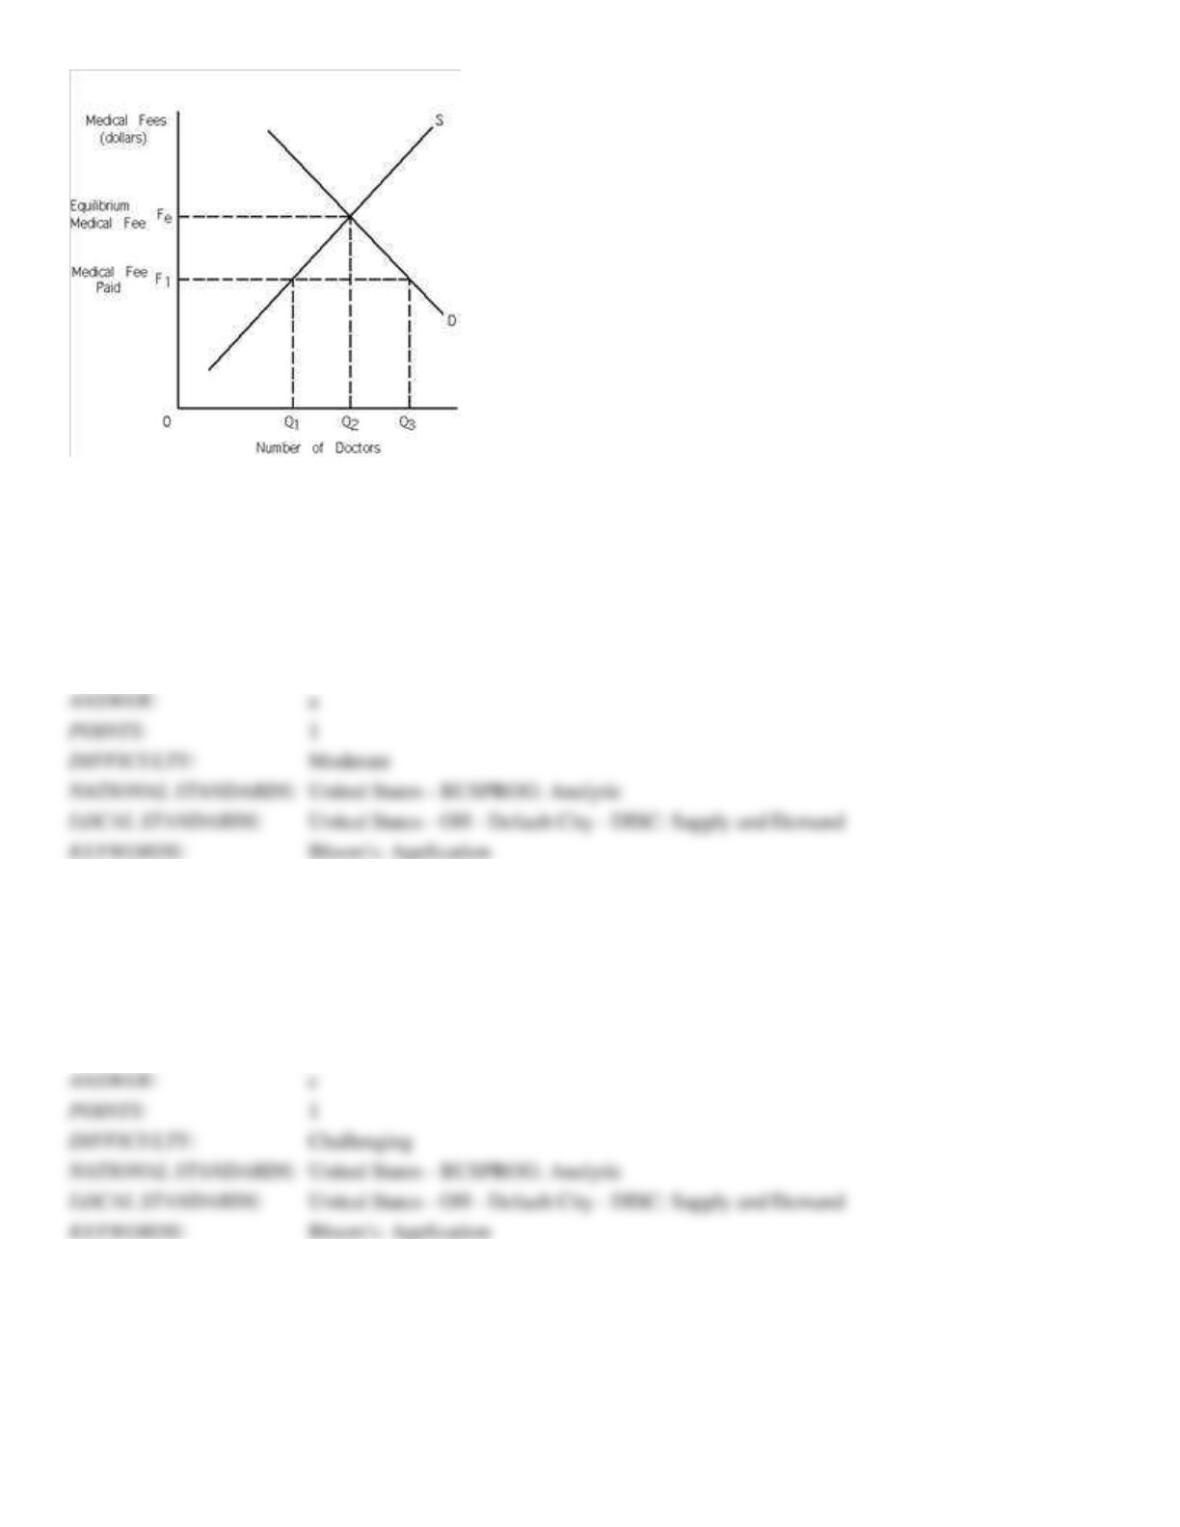
125. Refer to Exhibit 3-15. In Exhibit 3-15,
a.
there is a shortage of doctors at fee F1.
b.
there is a surplus of doctors at fee F1.
c.
Q3 doctors are employed at fee F1.
d.
Q2 doctors are employed at fee F1.
e.
both a and c
126. Refer to Exhibit 3-15. In Exhibit 3-15,
a.
Q2 doctors are employed at fee F1.
b.
Q3 doctors are employed at fee F1.
c.
Q1 doctors are employed at fee F1.
d.
the number of doctors employed cannot be determined at any fee.
127. Refer to Exhibit 3-15. In Exhibit 3-15, at fee F1 there is a
a.
shortage of (Q3 - Q1) doctors.
b.
surplus of (Q3 - Q1) doctors.
c.
surplus of (Q2 - Q1) doctors.
d.
shortage of (Q2 - Q1) doctors.
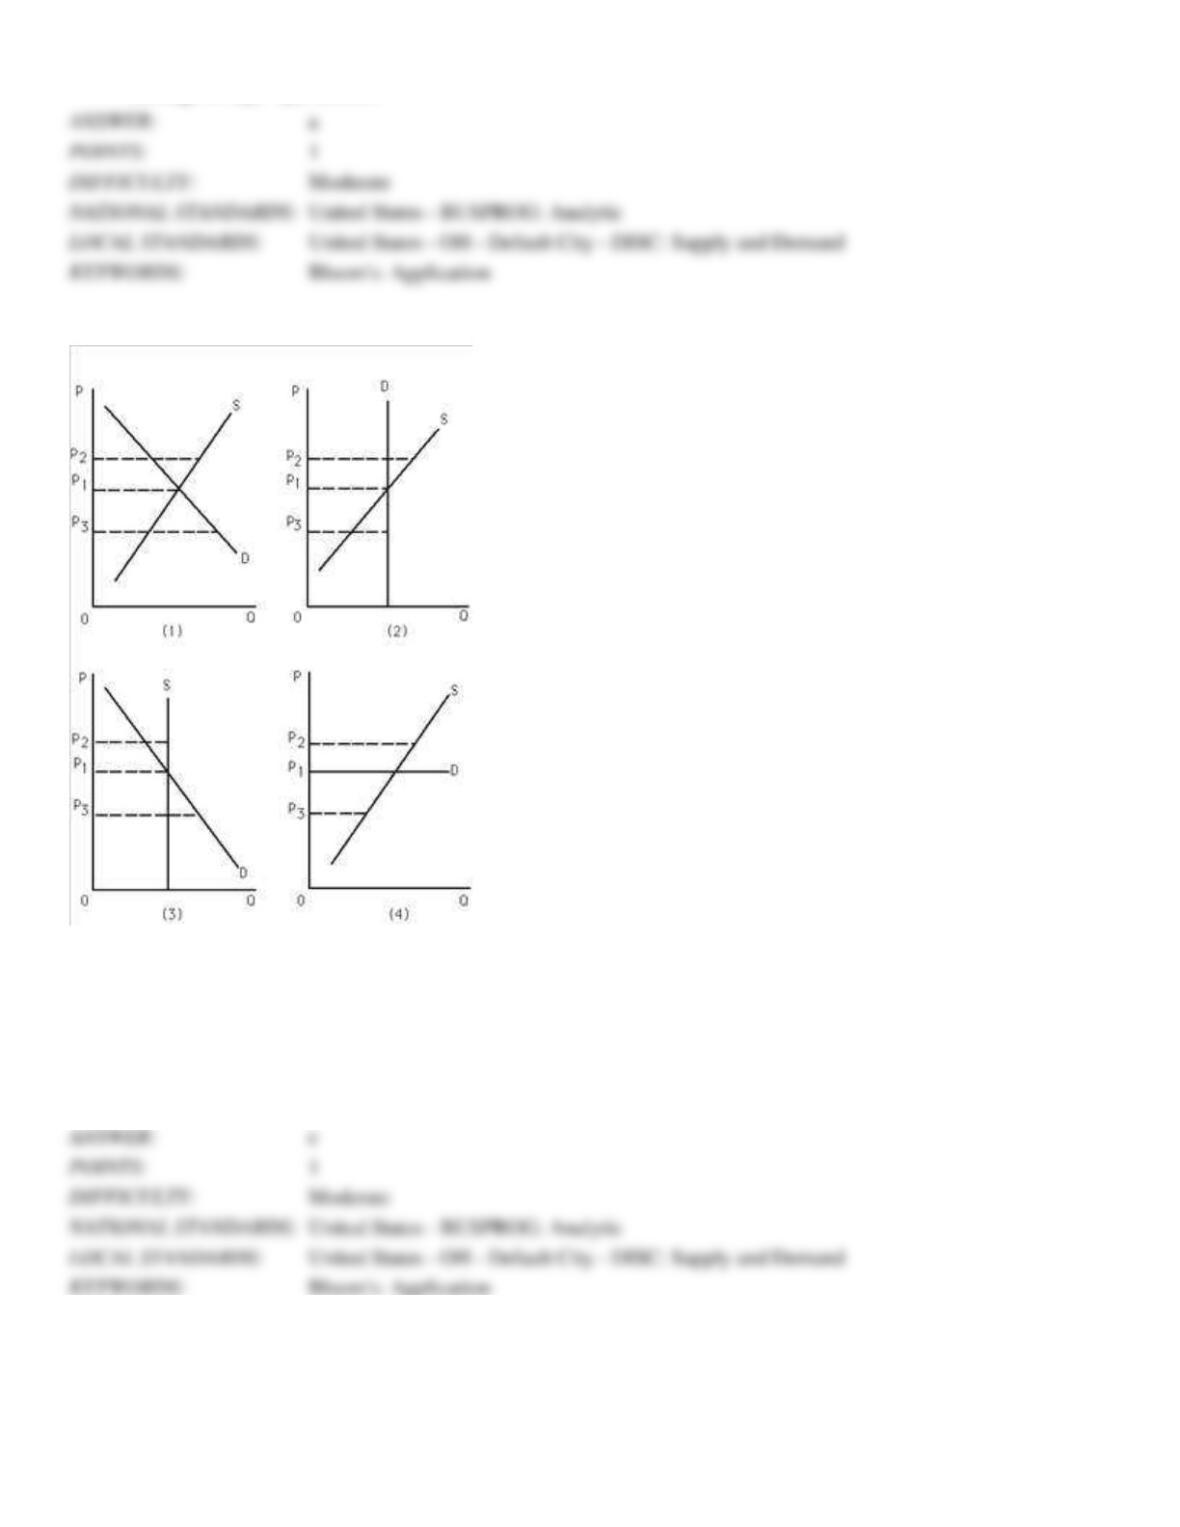
Exhibit 3-16
128. Refer to Exhibit 3-16. Which of the graphs best represents the market for theater tickets that are already sold out on
the day of the performance?
a.
(1)
b.
(2)
c.
(3)
d.
(4)
129. Refer to Exhibit 3-16. If there are empty seats for a basketball game at the price P*, the situation is best depicted on
graph
a.
(1), with P* = P1.
b.
(2), with P* = P3.
c.
(3), with P* = P2.
d.
(3), with P* = P3.
e.
(4), with P* = P1.
130. Refer to Exhibit 3-16. Which of the following is false?
a.
Graph (1): There is a shortage of this good when the price is equal to P3.
b.
Graph (2): As supply increases, equilibrium quantity remains constant.
c.
Graph (3): As demand increases, equilibrium price remains constant.
d.
Graph (4): As supply changes, equilibrium price stays the same.
131. As Jamal's income rises, his demand for pizza does not change. It follows that, for Jamal, pizza is a(n)
a.
normal good.
b.
inferior good.
c.
neutral good.
d.
substitute good.
e.
complementary good.
132. In the supply-and-demand diagram of the market for peanut butter, the equilibrium point has moved down and to the
right. What could have caused this?
a.
a fall in the price of peanuts
b.
a rise in the price of peanuts
c.
a rise in income, assuming that peanut butter is an inferior good
d.
a shift in preferences toward peanut butter


