Chapter 02 – Supply and Demand
157) Which of the following is true?
A) the supply curve is downward sloping and demand curve is upward sloping.
B) demand is downward sloping and supply is upward sloping.
C) both the supply curve and the demand curve are downward sloping.
D) both the supply curve and the demand curve are upward sloping.
158) On a supply and demand diagram
A) the horizontal axis is labeled price and the vertical axis is labeled quantity per unit time.
B) the horizontal axis is labeled quantity per unit time and the vertical axis is labeled price.
C) the horizontal axis is labeled supply and the vertical axis is labeled demand.
D) the horizontal axis is labeled demand and the vertical axis is labeled supply.
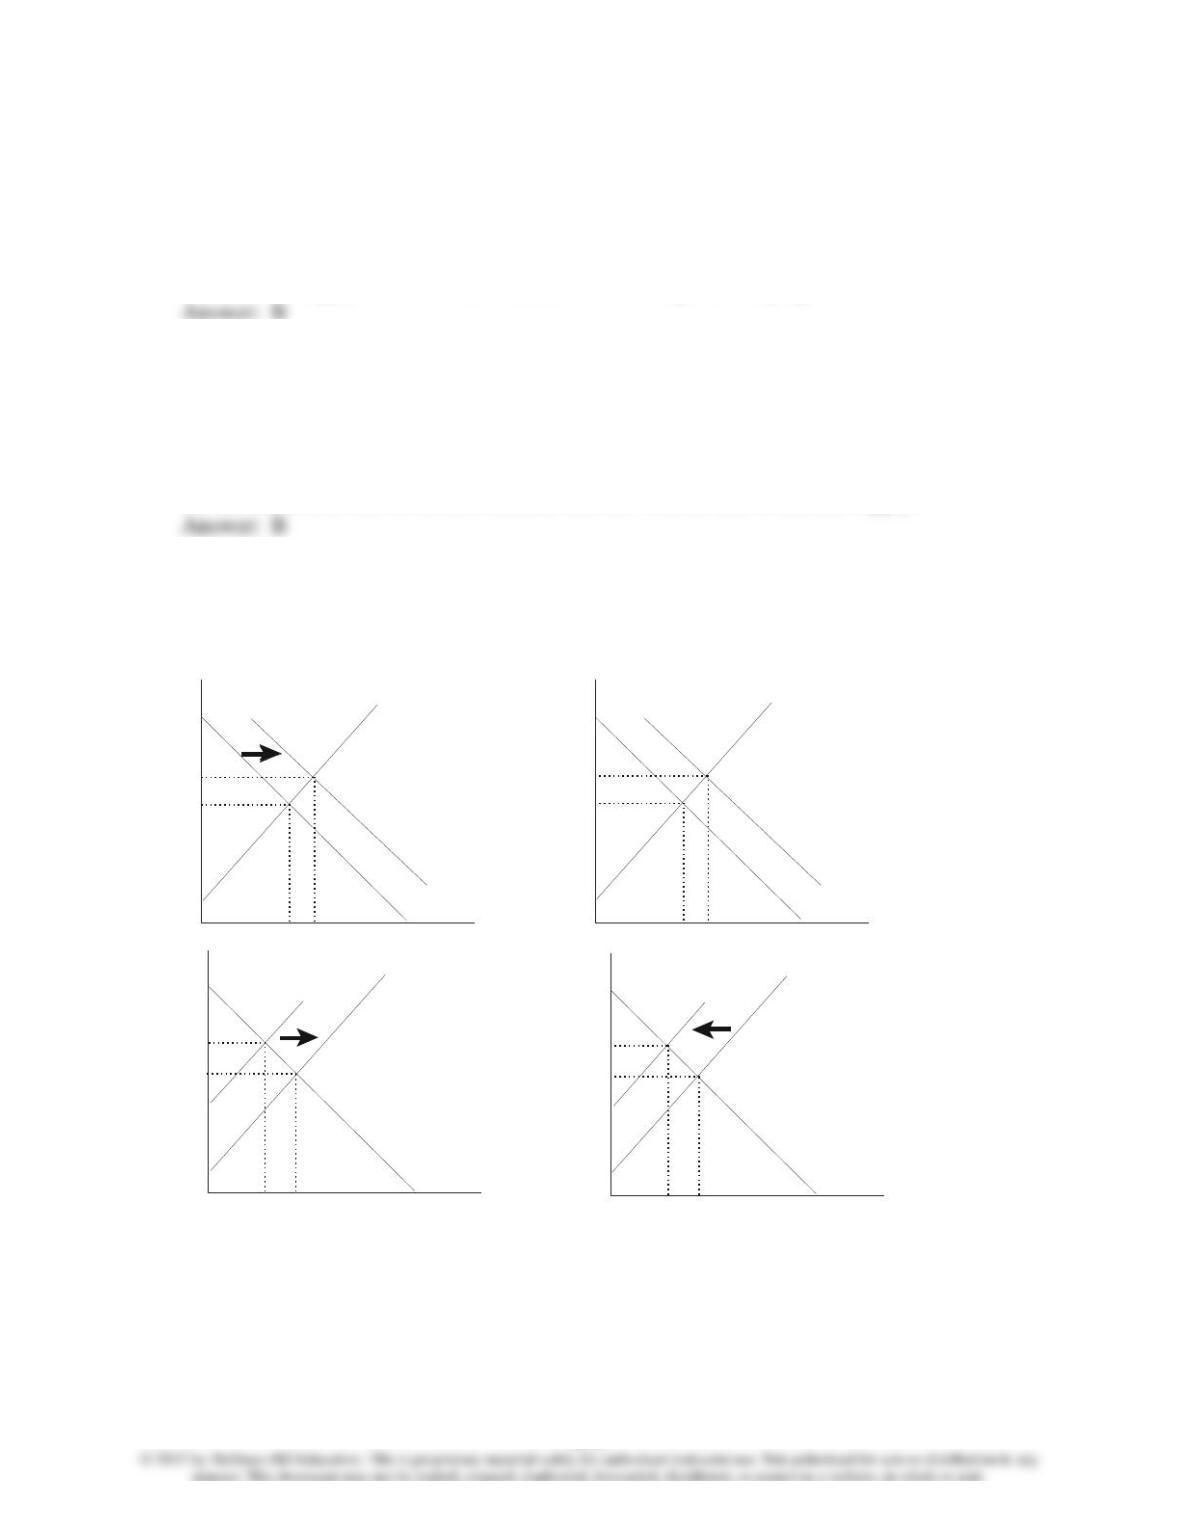
Use the following Figure 2.2 to answer questions 159-179:
P
S
D
P*
Q*
Figure 3 P
P
S
D
P*
Q*
Figure 2
Q/t
Q/t
S’
P’
Q’
S
D
P*
Q*
Figure 4
Q/t
S’
P’
Q’
D’
P’
Q’
P
S
D
P*
Q*
Figure 1
Q/t
D’
P’
Q’
Figure 2.2
Chapter 02 – Supply and Demand
159) Of the collection of supply and demand diagrams in Figure 2.2 above, which one(s) could
show the result of an increase in income?
A) Figure 1
B) Figure 2
C) Figure 3
D) Figures 1 and 2
160) Of the collection of supply and demand diagrams in Figure 2.2 above, which one(s) could
show the result of a decrease in income?
A) Figure 1
B) Figure 2
C) Figure 3
D) Figures 1 and 2
161) Of the collection of supply and demand diagrams in Figure 2.2 above which one shows the
result of an increase in the taste for a good?
A) Figure 1
B) Figure 2
C) Figure 3
D) Figure 4
162) Of the collection of supply and demand diagrams in Figure 2.2 above, which one shows the
result of a decrease in the taste for a good?
A) Figure 1
B) Figure 2
C) Figure 3
D) Figure 4
Chapter 02 – Supply and Demand
163) Of the collection of supply and demand diagrams in Figure 2.2 above, which one shows the
result of an increase in the price of a complement for a good?
A) Figure 1
B) Figure 2
C) Figure 3
D) Figure 4
164) Of the collection of supply and demand diagrams in Figure 2.2 above, which one shows the
result of a decrease in the price of a complement for a good?
A) Figure 1
B) Figure 2
C) Figure 3
D) Figure 4
165) Of the collection of supply and demand diagrams in Figure 2.2 above, which one shows the
result of an increase in the price of a substitute for a good?
A) Figure 1
B) Figure 2
C) Figure 3
D) Figure 4
166) Of the collection of supply and demand diagrams in Figure 2.2 above, which one shows the
result of a decrease in the price of a substitute for a good?
A) Figure 1
B) Figure 2
C) Figure 3
D) Figure 4
Chapter 02 – Supply and Demand
167) Of the collection of supply and demand diagrams in Figure 2.2 above, which one shows the
result of an increase in income if a good is considered normal?
A) Figure 1
B) Figure 2
C) Figure 3
D) Figure 4
168) Of the collection of supply and demand diagrams in Figure 2.2 above, which one shows the
result of a decrease in income if a good is considered normal?
A) Figure 1
B) Figure 2
C) Figure 3
D) Figure 4
169) Of the collection of supply and demand diagrams in Figure 2.2 above, which one shows the
result of a decrease in income if a good is considered inferior?
A) Figure 1
B) Figure 2
C) Figure 3
D) Figure 4
170) Of the collection of supply and demand diagrams in Figure 2.2 above, which one shows the
result of an increase in the population of the group of people likely to buy a good?
A) Figure 1
B) Figure 2
C) Figure 3
D) Figure 4
Chapter 02 – Supply and Demand
171) Of the collection of supply and demand diagrams in Figure 2.2 above, which one shows the
result of a decrease in the population of the group of people likely to buy a good?
A) Figure 1
B) Figure 2
C) Figure 3
D) Figure 4
172) Of the collection of supply and demand diagrams in Figure 2.2 above which one shows the
result of an increase in technology in the market for anything?
A) Figure 1
B) Figure 2
C) Figure 3
D) Figure 4
173) Of the collection of supply and demand diagrams in Figure 2.2 above which one shows the
result of a decrease in technology in the market for anything?
A) Figure 1
B) Figure 2
C) Figure 3
D) Figure 4
174) Of the collection of supply and demand diagrams in Figure 2.2 above, which one shows the
result of an increase in the price of an input in the market for anything?
A) Figure 1
B) Figure 2
C) Figure 3
D) Figure 4
Chapter 02 – Supply and Demand
175) Of the collection of supply and demand diagrams in Figure 2.2 above, which one shows the
result of a decrease in the price of an input in the market for anything?
A) Figure 1
B) Figure 2
C) Figure 3
D) Figure 4
176) Of the collection of supply and demand diagrams in Figure 2.2 above, which one shows the
result of an increase in the number of sellers in the market for anything?
A) Figure 1
B) Figure 2
C) Figure 3
D) Figure 4
177) Of the collection of supply and demand diagrams in Figure 2.2 above, which one shows the
result of a decrease in the number of sellers in the market for anything?
A) Figure 1
B) Figure 2
C) Figure 3
D) Figure 4
178) Of the collection of supply and demand diagrams in Figure 2.2 above which one(s) show the
result of an increase in the expected future price?
A) Figure 1
B) Figure 4
C) Figures 2 and 3
D) Figures 1 and 4
Chapter 02 – Supply and Demand
179) Of the collection of supply and demand diagrams in Figure 2.2 above which one(s) show the
result of an decrease in the expected future price?
A) Figure 1
B) Figure 4
C) Figures 2 and 3
D) Figures 1 and 4
180) If two goods can be made with essentially the same inputs, which one of the collection of
supply and demand diagrams above shows the result of an increase in the price of one on the
market for the other?
A) Figure 1
B) Figure 2
C) Figure 3
D) Figure 4
181) If two goods can be made with essentially the same inputs, which one of the collection of
supply and demand diagrams above shows the result of a decrease in the price of one on the
market for the other.
A) Figure 1
B) Figure 2
C) Figure 3
D) Figure 4
182) If the price of a bottle of orange juice in the downtown area is $0.50 per bottle and, at that
price, each of the 10,000 people working in the downtown area wants to buy two bottles of
orange juice per day, the quantity demanded in the downtown orange juice market would be
A) 5,000 bottles per day.
B) 10,000 bottles per day.
C) 15,000 bottles per day.
D) 20,000 bottles per day.
Chapter 02 – Supply and Demand
183) Market quantity demanded measures the amount of the product that people in the market
want to buy
A) if the government subsidizes their purchase.
B) if the sellers in the market force them to buy.
C) per person.
D) per unit time, such as a day or week.
184) If the price of a bottle of orange juice in the downtown orange juice market is $0.50 per
bottle, vendors will happily sell orange juice in the market only if their cost per bottle is
A) subsidized by the government.
B) greater than $0.50.
C) less than $0.50.
D) zero.
185) Where the supply and demand curves cross, the amount that consumers want to buy is
A) more than the amount they wanted to buy yesterday.
B) more than the amount firms want to sell.
C) equal to the amount firms want to sell.
D) less than the amount firms want to sell.
186) If the price is so low that vendors start to run out of bottled orange juice, they might ration
their remaining inventory among willing buyers by
A) raising the price per bottle.
B) lowering the price per bottle.
C) closing early.
D) creating a shortage.
187) If the price is so high that vendors find too many unsold bottles remaining in inventory, they
might dispose of their excess inventory by
A) raising the price per bottle.
B) lowering the price per bottle.
C) closing early.
D) creating a surplus.
Chapter 02 – Supply and Demand
188) The supply curve slopes upward because producers’ cost per unit eventually
A) decreases as more units are sold.
B) remains unchanged as more units are sold.
C) increases as more units are sold.
D) will be subsidized by the government.
189) During flu season, as people try to boost their immune system believing that orange juice
might aid in keeping viruses at bay,
A) the taste for orange juice would rise.
B) the taste for orange juice would fall.
C) the taste for orange juice would remain unchanged.
D) the price of orange juice would fall.
190) If people consume fewer bottles of orange juice as their income rises, orange juice is
A) a necessity.
B) an abnormal good.
C) a normal good.
D) an inferior good.
191) Orange juice and grapefruit juice are likely to be
A) complementary to one another.
B) substitutes for one another.
C) inferior goods.
D) all of the above.
192) When the expected future price of a good rises,
A) sellers increase their willingness to sell.
B) consumers increase their willingness to buy, or “stock up”.
C) consumers decrease their willingness to buy, or “draw down”.
D) sellers’ willingness to sell remains unchanged.

Chapter 02 – Supply and Demand
193) Since teachers are an input in the production of education, when teacher salaries increase
A) the supply of education decreases.
B) the supply of education increases.
C) the demand for education decreases.
D) the demand for teachers increases.
194) Improvements in technology tend to
A) increase supply.
B) lower the cost of producing a given output.
C) increase the output produced for a given cost.
D) all of the above.
195) In a market served by vendors who sell both orange juice and bottled water from their carts,
an increase in the price of bottled water will tend to
A) reduce the supply of bottled water.
B) increase the supply of bottled water.
C) reduce the supply of orange juice.
D) increase the supply of orange juice.
196) If farmers expect the government to increase subsidies on corn grown next year for ethanol
production, we should not be surprised to observe
A) a decrease in corn production.
B) a decrease in ethanol production.
C) a decrease in wheat production.
D) all of the above.
197) On the Heritage Foundation’s scale of “Economic Freedom,” which of the following
countries is least “Free”?
A) Hong Kong
B) United States
C) New Zealand
D) Russia
Chapter 02 – Supply and Demand
198) On the Heritage Foundation’s scale of “Economic Freedom,” which of the following
countries is most “Free”?
A) Venezuela
B) Ireland
C) North Korea
D) Russia
199) On the Heritage Foundation’s scale of “Economic Freedom,” which of the following factors
contribute to “Economic Freedom”?
A) high tariffs to protect domestic jobs
B) a minimum wage guaranteeing
C) a legal system conducive to business
D) a vibrant labor union movement
200) A per unit tax or percentage tax on a good or service that must be paid by consumers of that
good is
A) a subsidy.
B) taxation without representation.
C) a gift tax.
D) an excise tax.
201) An increase in the excise tax imposed upon consumers of gasoline
A) increases the demand for gasoline.
B) decreases the demand for gasoline.
C) increases the supply of gasoline.
D) lowers the market price of gasoline.
202) An increase in the excise tax imposed upon consumers of gasoline
A) shifts the demand for gasoline to the left.
B) shifts the demand for gasoline to the right.
C) shifts the supply of gasoline to the right.
D) shifts the market price of gasoline.
203) An increase in the subsidy paid to producers of tobacco
A) increases the demand for tobacco.
B) decreases the demand for tobacco.
Chapter 02 – Supply and Demand
C) increases the supply of tobacco.
D) increases the market price of tobacco.
204) An increase in the subsidy paid to producers of tobacco
A) shifts the supply of tobacco to the right.
B) shifts the demand for tobacco to the left.
C) shifts the demand for tobacco to the right.
D) shifts the market price of tobacco.