
B) the real-balances effect.
C) diminishing marginal utility.
61) The notion that the money in your possession will buy less when the price rises is provided
as the explanation for
A) the substitution effect.
B) the real-balances effect.
C) diminishing marginal utility.
62) The notion that when the price of the good you want rises you will buy less of it because
you will find another good that will do instead, is provided as the explanation for
A) the substitution effect.
B) the real-balances effect.
C) diminishing marginal utility.
63) If you are given $20 and told to go to the store and buy as many potatoes as you can, the
reason your demand curve for potatoes is downward sloping has mostly to do with
A) the substitution effect.
B) the real-balances effect.
C) diminishing marginal utility.
64) If you are grocery shopping and you see that the price of beef has risen and as a result you
change your planned menu for the week and buy chicken instead, the reason your demand
curve for beef is downward sloping has mostly to do with
A) the substitution effect.
B) the real-balances effect.
C) diminishing marginal utility.
65) A friend is telling you that they tend to drink more at parties than they do at home. You ask
about why and they tell you that though they enjoy their fifth and sixth drinks the same

regardless of where they are, the fact that it is free at the party and they have to pay to
replace it at home, you translate that statement into a verification of
A) the substitution effect.
B) the real-balances effect.
C) the notion of diminishing marginal utility.
66) The substitution effect suggests that
A) when prices are higher your buying power is less so you buy less.
B) when prices are higher you buy less of what you originally wanted and use something
else instead.
C) when prices are higher buy fewer because the marginal utility of a good is diminishing.
D) when prices are higher you buy more.
67) The real balances effect suggests that
A) when prices are higher your buying power is less so you buy less.
B) when prices are higher you buy less of what you originally wanted and use something
else instead.
C) when prices are higher buy fewer because the marginal utility of a good is diminishing.
D) when prices are higher you buy more.
68) The Law of Diminishing Marginal Utility suggests that
A) when you consume more you are less happy.
B) when you consume more society is less well off.
C) the more you consume the less extra enjoyment you get out of each additional unit.
D) when prices are higher you buy more.
69) The Law of Supply indicates that
A) there is a negative relationship between quantity demanded and quantity supplied.
B) there is a negative relationship between quantity supplied and price.
C) there is a positive relationship between quantity demanded and quantity supplied.
D) there is a positive relationship between quantity supplied and price.
70) The reason that the supply curve is upward sloping is
A) diminishing marginal costs.
B) diminishing average costs.
C) increasing marginal costs.

D) increasing average costs.
71) The quantity supplied is the amount firms wish to sell
A) at all possible prices during a specified period of time.
B) at a particular price during a specified period of time.
C) at a particular price (the timeframe is irrelevant).
D) at all possible prices (the timeframe is irrelevant).
72) Unless circumstances are quite out of the ordinary, a supply curve will be
A) vertical.
B) horizontal.
C) downward sloping.
D) upward sloping.
73) If the price of a typical good rises, the quantity supplied for that good will
A) decrease.
B) increase.
C) remain the same.
D) automatically increase to infinity.
74) If the price of a typical good falls, the quantity supplied for that good will
A) decrease.
B) increase.
C) remain the same.
D) automatically increase to zero.
75) In drawing a supply curve, the labels for the axes are
A) price (on the vertical axis) and quantity (on the horizontal axis).
B) price (on the vertical axis) and quantity per unit of time (on the horizontal axis).
C) price (on the horizontal axis) and quantity (on the vertical axis).
D) price (on the horizontal axis) and quantity per unit of time (on the vertical axis).
76) If you heard overheard a farmer discussing his planting plans for the upcoming season and
he said “The price of corn has gone way up. I know I’ll have to put some money into

fertilizer on that field on the hill that’s been idle all these years, but it will be worth it this
year.” This would be consistent with which justification for an upward sloping supply curve
A) increasing marginal cost.
B) the need for higher prices in one good to motivate a shift in production from another.
C) the real-balance effect.
D) diminishing marginal utility.
77) If you heard overheard a farmer discussing his planting plans for the upcoming season and
he said “The price of corn has gone way up. I know I’ll have to put some money into
fertilizer on the field where I was going to plant soybeans, but it will be worth it this year.”
This would be consistent with which justification for an upward sloping supply curve
A) increasing marginal cost.
B) the need for higher prices in one good to motivate a shift in production from another.
C) the real-balance effect.
D) diminishing marginal utility.
78) Which of the following will impact both supply and demand
A) a change in price.
B) a change in expected future price.
C) a change in quantity.
D) a change in income.
79) An increase in which of the following determinants of demand will have an ambiguous
(uncertain) effect on price
A) taste.
B) price of a complement.
C) income.
D) price of a substitute.
80) An increase in the income of consumers will cause the
A) supply of all goods to rise.
B) demand for all goods to rise.
C) supply of all goods to fall.
D) the demand for some goods to rise and for others to fall.
81) The increase in the price of a good would
A) move its demand curve to the right.
B) move its demand curve to the left.
C) cause a movement along the demand curve to a (higher price, lower quantity) point.
D) cause a movement along the demand curve to a (lower price, higher quantity) point.
82) The decrease in the price of a good would
A) move its demand curve to the right.
B) move its demand curve to the left.
C) cause a movement along the demand curve to a (higher price, lower quantity) point.
D) cause a movement along the demand curve to a (lower price, higher quantity) point.
83) An increase in the degree a good is liked (the increase in the taste for a good) would
A) move its demand curve to the right.
B) move its demand curve to the left.
C) cause a movement along the demand curve to a (higher price, lower quantity) point.
D) cause a movement along the demand curve to a (lower price, higher quantity) point.
84) A decrease in the degree a good is liked (the increase in the taste for a good) would
A) move its demand curve to the right.
B) move its demand curve to the left.
C) cause a movement along the demand curve to a (higher price, lower quantity) point.
D) cause a movement along the demand curve to a (lower price, higher quantity) point.
85) An increase in household income for a good that is considered normal would
A) move its demand curve to the right.
B) move its demand curve to the left.
C) cause a movement along the demand curve to a (higher price, lower quantity) point.
D) cause a movement along the demand curve to a (lower price, higher quantity) point.
86) An increase in household income for a good that is considered inferior would
A) move its demand curve to the right.
B) move its demand curve to the left.
C) cause a movement along the demand curve to a (higher price, lower quantity) point.
D) cause a movement along the demand curve to a (lower price, higher quantity) point.
87) A decrease in household income for a good that is considered normal would
A) move its demand curve to the right.
B) move its demand curve to the left.
C) cause a movement along the demand curve to a (higher price, lower quantity) point.
D) cause a movement along the demand curve to a (lower price, higher quantity) point.
88) A decrease in household income for a good that is considered inferior would
A) move its demand curve to the right.
B) move its demand curve to the left.
C) cause a movement along the demand curve to a (higher price, lower quantity) point.
D) cause a movement along the demand curve to a (lower price, higher quantity) point.
89) If goods A and B are considered substitutes, an increase in the price of A would cause
A) the demand curve for B to the right.
B) the demand curve for B to the left.
C) cause a movement along the demand curve for B to a (higher price, lower quantity) point.
D) cause a movement along the demand curve for B to a (lower price, higher quantity) point.
90) If goods A and B are considered complements, an increase in the price of A would cause
A) the demand curve for B to the right.
B) the demand curve for B to the left.
C) cause a movement along the demand curve for B to a (higher price, lower quantity) point.
D) cause a movement along the demand curve for B to a (lower price, higher quantity) point.
91) If goods A and B are considered substitutes, a decrease in the price of A would cause
A) the demand curve for B to the right.
B) the demand curve for B to the left.
C) cause a movement along the demand curve for B to a (higher price, lower quantity) point.
D) cause a movement along the demand curve for B to a (lower price, higher quantity) point.
92) If goods A and B are considered complements, a decrease in the price of A would cause
A) the demand curve for B to the right.
B) the demand curve for B to the left.
C) cause a movement along the demand curve for B to a (higher price, lower quantity) point.
D) cause a movement along the demand curve for B to a (lower price, higher quantity) point.
93) If there is a good that is consumed almost entirely by the elderly, an aging of the overall
population would
A) move its demand curve to the right.
B) move its demand curve to the left.
C) cause a movement along the demand curve to a (higher price, lower quantity) point.
D) cause a movement along the demand curve to a (lower price, higher quantity) point.
94) If there is a good that is consumed almost entirely by children, a significant reduction in the
birth rate would
A) move its demand curve to the right.
B) move its demand curve to the left.
C) cause a movement along the demand curve to a (higher price, lower quantity) point.
D) cause a movement along the demand curve to a (lower price, higher quantity) point.
95) If there is an expectation that the price of a good will increase in the next month this would
immediately
A) move its demand curve to the right.
B) move its demand curve to the left.
C) cause a movement along the demand curve to a (higher price, lower quantity) point.
D) cause a movement along the demand curve to a (lower price, higher quantity) point.
96) If there is an expectation that the price of a good will decrease in the next month this would
immediately
A) move its demand curve to the right.
B) move its demand curve to the left.
C) cause a movement along the demand curve to a (higher price, lower quantity) point.
D) cause a movement along the demand curve to a (lower price, higher quantity) point.
97) If a tax (paid by consumers) is levied on a good this would
A) move its demand curve to the right.
B) move its demand curve to the left.
C) cause a movement along the demand curve to a (higher price, lower quantity) point.
D) cause a movement along the demand curve to a (lower price, higher quantity) point.
98) If a subsidy (going to consumers) is created for a good this would
A) move its demand curve to the right.
B) move its demand curve to the left.
C) cause a movement along the demand curve to a (higher price, lower quantity) point.
D) cause a movement along the demand curve to a (lower price, higher quantity) point.
99) If a tax (paid by consumers) on a good is reduced this would
A) move its demand curve to the right.
B) move its demand curve to the left.
C) cause a movement along the demand curve to a (higher price, lower quantity) point.
D) cause a movement along the demand curve to a (lower price, higher quantity) point.
100) If a subsidy (going to consumers) on a good is eliminated this would
A) move its demand curve to the right.
B) move its demand curve to the left.
C) cause a movement along the demand curve to a (higher price, lower quantity) point.
D) cause a movement along the demand curve to a (lower price, higher quantity) point.
101) The increase in the price of a good would
A) move its supply curve to the right.
B) move its supply curve to the left.
C) cause a movement along the supply curve to a (higher price, higher quantity) point.
D) cause a movement along the supply curve to a (lower price, lower quantity) point.
102) The decrease in the price of a good would
A) move its supply curve to the right.
B) move its supply curve to the left.
C) cause a movement along the supply curve to a (higher price, higher quantity) point.
D) cause a movement along the supply curve to a (lower price, lower quantity) point.
103) Which of the following is the best example of the concept of “inferior”?
A) SUV’s
B) Coke and Pepsi

C) Ramen noodles
D) Hot dogs and hot dog buns
104) The quintessential example of a normal good would be
A) steak for someone who liked beef.
B) the substitution of Granny Smith for Golden Delicious apples.
C) Ramen Noodles for a poor college student.
D) peanut butter and jelly for a young boy or girl.
105) The quintessential example of an inferior good would be
A) steak for someone who liked beef.
B) the substitution of Granny Smith for Golden Delicious apples.
C) Ramen Noodles for a poor college student.
D) peanut butter and jelly for a young boy or girl.
106) The quintessential example of complementary goods would be
A) steak for someone who liked beef.
B) the switching of Granny Smith for Golden Delicious apples.
C) Ramen Noodles for a poor college student.
D) peanut butter and jelly for a young boy or girl.
107) The quintessential example of substitute goods would be
A) steak for someone who liked beef.
B) the switching of Granny Smith for Golden Delicious apples.
C) Ramen Noodles for a poor college student.
D) peanut butter and jelly for a young boy or girl.
108) Which of the following is the best example of the concept of “normal”?
A) SUV’s
B) Coke and Pepsi
C) Ramen noodles
D) Hot dogs and hot dog buns
109) Which of the following is the best example of the concept of “another potential output”?
A) SUV’s
B) Ramen noodles

C) Coke and Pepsi
D) corn and soybeans
110) Which of the following is the best example of the concept of “complement”?
A) SUV’s
B) Coke and Pepsi
C) Ramen noodles
D) Hot dogs and hot dog buns
111) Which of the following goods are likely to be considered complements?
A) Right and left shoes
B) Coke and Pepsi
C) Peanut butter and jelly
D) (a) and (c)
112) Which of the following goods are likely to be considered complements?
A) Sprite and 7-Up
B) Gasoline and diesel fuel
C) Peanut butter and jelly
D) Coke and Pepsi
113) Which of the following is the best example of the concept of “substitute”?
A) SUV’s
B) Coke and Pepsi
C) Ramen noodles
D) Hot dogs and hot dog buns
114) Which of the following goods are likely to be considered substitutes?
A) Hot dogs and hot dog buns
B) Gasoline and diesel fuel
C) Peanut butter and jelly
D) Coke and Pepsi

115) Which of the following goods should be clearly considered substitutes?
A) Right and left shoes
B) Gasoline and diesel fuel
C) Peanut butter and jelly
D) Coke and Pepsi
116) The quintessential example for the price of an input and its impact on an output is
A) Hotdogs and hotdog buns
B) Crude oil and gasoline
C) Corn and soybeans
D) 7up and Sprite
117) The quintessential example for the price of another potential output and the impact of the
price of one good on the market for another is
A) Hotdogs and hotdog buns
B) Crude oil and gasoline
C) Corn and soybeans
D) 7up and Sprite
118) If technology increases then
A) the demand curve will shift to the right.
B) the demand curve will shift to the left.
C) the supply curve will shift to the right.
D) the supply curve will shift to the left.
119) If technology decreases then
A) the demand curve will shift to the right.
B) the demand curve will shift to the left.
C) the supply curve will shift to the right.
D) the supply curve will shift to the left.
120) If a good is normal and income decreases then
A) the demand curve will shift to the right.
B) the demand curve will shift to the left.
C) the supply curve will shift to the right.
D) the supply curve will shift to the left.
121) If a good is normal and income increases then
A) the demand curve will shift to the right.
B) the demand curve will shift to the left.
C) the supply curve will shift to the right.
D) the supply curve will shift to the left.
122) If a good is inferior and income increases then
A) the demand curve will shift to the right.
B) the demand curve will shift to the left.
C) the supply curve will shift to the right.
D) the supply curve will shift to the left.
123) If a good is inferior and income decreases then
A) the demand curve will shift to the right.
B) the demand curve will shift to the left.
C) the supply curve will shift to the right.
D) the supply curve will shift to the left..
124) If a firm has two production alternatives and the price of one decreases this will cause
the other good’s
A) demand curve to shift to the right.
B) supply curve to shift to the right.
C) demand curve to shift to the left.
D) supply curve to shift to the left.

125) If a firm has two production alternatives and the price of one increases this will cause the
other good’s
A) demand curve to shift to the right.
B) supply curve to shift to the right.
C) demand curve to shift to the left.
D) supply curve to shift to the left.
126) If the price of a good is expected to fall in the future its
A) demand curve will shift to the right.
B) supply curve will shift to the right.
C) demand curve will shift to the left.
D) b) and c)
127) If the price of a good is expected to rise in the future its
A) demand curve will shift to the right.
B) supply curve will shift to the left.
C) demand curve will shift to the left.
D) a) and b)
128) In the market for birth control devices, if the number of women of child-bearing age
increases, the
A) demand curve will shift to the right.
B) supply curve will shift to the right.
C) demand curve will shift to the left.
D) supply curve will shift to the left.
129) In the market for birth control devices, if the number of women of child-bearing age
decreases, the
A) demand curve will shift to the right.
B) supply curve will shift to the right.
C) demand curve will shift to the left.
D) supply curve will shift to the left.
130) If the price of inputs increases, the
A) demand curve will shift to the right.
B) supply curve will shift to the right

C) demand curve will shift to the left.
D) supply curve will shift to the left.
131) If the price of inputs decreases, the
A) demand curve will shift to the right.
B) supply curve will shift to the right.
C) demand curve will shift to the left.
D) supply curve will shift to the left.
132) If the number of sellers increases, the
A) demand curve will shift to the right.
B) supply curve will shift to the right.
C) demand curve will shift to the left.
D) supply curve will shift to the left.
133) If the number of sellers decreases, the
A) demand curve will shift to the right.
B) supply curve will shift to the right.
C) demand curve will shift to the left.
D) supply curve will shift to the left.
134) If the taste for a good increases, the
A) demand curve will shift to the right.
B) supply curve will shift to the right.
C) demand curve will shift to the left.
D) supply curve will shift to the left.
135) If the taste for a good decreases, the
A) demand curve will shift to the right.
B) supply curve will shift to the right.
C) demand curve will shift to the left.
D) supply curve will shift to the left.
136) If two goods are considered complements and the price of one decreases then the other

good’s
A) demand curve will shift to the right.
B) supply curve will shift to the right.
C) demand curve will shift to the left.
D) supply curve will shift to the left.
137) If two goods are considered substitutes and the price of one decreases, the other good’s
A) demand curve will shift to the right.
B) supply curve will shift to the right.
C) demand curve will shift to the left.
D) supply curve will shift to the left.
138) If two goods are considered complements and the price of one increases, the other good’s
A) demand curve will shift to the right.
B) supply curve will shift to the right.
C) demand curve will shift to the left.
D) supply curve will shift to the left.
139) If two goods are considered substitutes and the price of one increases, the other good’s
A) demand curve will shift to the right.
B) supply curve will shift to the right.
C) demand curve will shift to the left.
D) supply curve will shift to the left.
140) The increase in the price of a good that is used as an input for a second good, would (for
the second good)
A) move its supply curve to the right.
B) move its supply curve to the left.
C) cause a movement along the supply curve to a (higher price, higher quantity) point.
D) cause a movement along the supply curve to a (lower price, lower quantity) point.

141) The decrease in the price of a good that is used as an input for a second good, would (for
the second good)
A) move its supply curve to the right.
B) move its supply curve to the left.
C) cause a movement along the supply curve to a (higher price, higher quantity) point.
D) cause a movement along the supply curve to a (lower price, lower quantity) point.
142) The increase in technology used to produce a good would
A) move its supply curve to the right.
B) move its supply curve to the left.
C) cause a movement along the supply curve to a (higher price, higher quantity) point.
D) cause a movement along the supply curve to a (lower price, lower quantity) point.
143) The decrease in technology used to produce a good would
A) move its supply curve to the right.
B) move its supply curve to the left.
C) cause a movement along the supply curve to a (higher price, higher quantity) point.
D) cause a movement along the supply curve to a (lower price, lower quantity) point.
144) The increase in the price of a good that is another potential output for another good,
would (for the second good)
A) move its supply curve to the right.
B) move its supply curve to the left.
C) cause a movement along the supply curve to a (higher price, higher quantity) point.
D) cause a movement along the supply curve to a (lower price, lower quantity) point.
145) The decrease in the price of a good that is another potential output for another good,
would (for the second good)
A) move its supply curve to the right.
B) move its supply curve to the left.
C) cause a movement along the supply curve to a (higher price, higher quantity) point.
D) cause a movement along the supply curve to a (lower price, lower quantity) point.

146) The increase in the number of sellers of a good would
A) move its supply curve to the right.
B) move its supply curve to the left.
C) cause a movement along the supply curve to a (higher price, higher quantity) point.
D) cause a movement along the supply curve to a (lower price, lower quantity) point.
147) The decrease in the number of sellers of a good would
A) move its supply curve to the right.
B) move its supply curve to the left.
C) cause a movement along the supply curve to a (higher price, higher quantity) point.
D) cause a movement along the supply curve to a (lower price, lower quantity) point.
148) If there is an expectation that the price of a good will increase in the next month this
would immediately
A) move its supply curve to the right.
B) move its supply curve to the left.
C) cause a movement along the supply curve to a (higher price, higher quantity) point.
D) cause a movement along the supply curve to a (lower price, lower quantity) point.
149) If there is an expectation that the price of a good will decrease in the next month this
would immediately
A) move its supply curve to the right.
B) move its supply curve to the left.
C) cause a movement along the supply curve to a (higher price, higher quantity) point.
D) cause a movement along the supply curve to a (lower price, lower quantity) point.
150) If a tax (paid by producers) on a good is reduced this would
A) move its supply curve to the right.
B) move its supply curve to the left.
C) cause a movement along the supply curve to a (higher price, higher quantity) point.
D) cause a movement along the supply curve to a (lower price, lower quantity) point.
151) If a subsidy (going to producers) is created for a good this would
A) move its supply curve to the right.
B) move its supply curve to the left.

C) cause a movement along the supply curve to a (higher price, higher quantity) point.
D) cause a movement along the supply curve to a (lower price, lower quantity) point.
152) If a subsidy (going to producers) on a good is eliminated this would
A) move its supply curve to the right.
B) move its supply curve to the left.
C) cause a movement along the supply curve to a (higher price, higher quantity) point.
D) cause a movement along the supply curve to a (lower price, lower quantity) point.
153) If demand increases and the price doesn’t change, there will be a
A) surplus.
B) both a shortage and a surplus.
C) shortage.
D) neither a shortage nor a surplus.
154) If supply increases and the price doesn’t change, there will be a
A) surplus.
B) both a shortage and a surplus.
C) shortage.
D) neither a shortage nor a surplus.
155) If demand decreases and the price doesn’t change, there will be a
A) surplus.
B) both a shortage and a surplus.
C) shortage
D) neither a shortage nor a surplus.
156) If supply decreases and the price doesn’t change, there will be a
A) surplus.
B) both a shortage and a surplus.
C) shortage.
D) neither a shortage nor a surplus.
157) Which of the following is true?
A) the supply curve is downward sloping and demand curve is upward sloping.
B) demand is downward sloping and supply is upward sloping.
C) both the supply curve and the demand curve are downward sloping.
D) both the supply curve and the demand curve are upward sloping.
158) On a supply and demand diagram
A) the horizontal axis is labeled price and the vertical axis is labeled quantity per unit time.
B) the horizontal axis is labeled quantity per unit time and the vertical axis is labeled price.
C) the horizontal axis is labeled supply and the vertical axis is labeled demand.
D) the horizontal axis is labeled demand and the vertical axis is labeled supply.
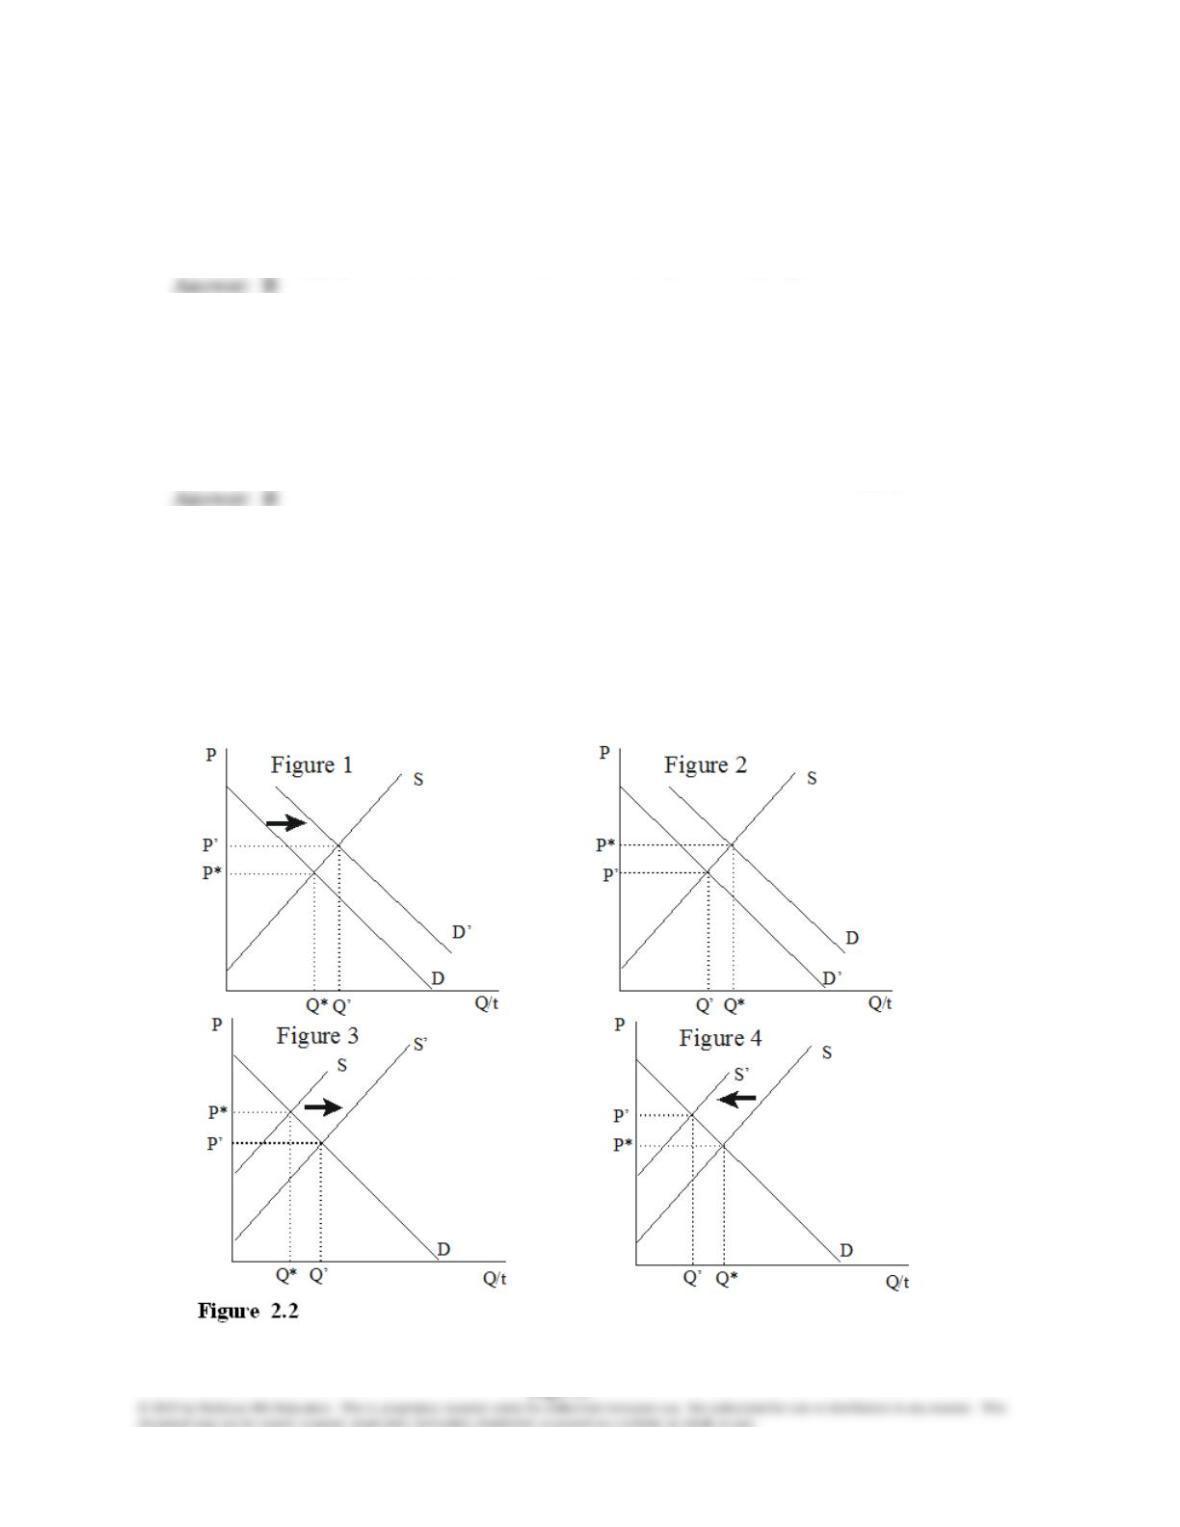
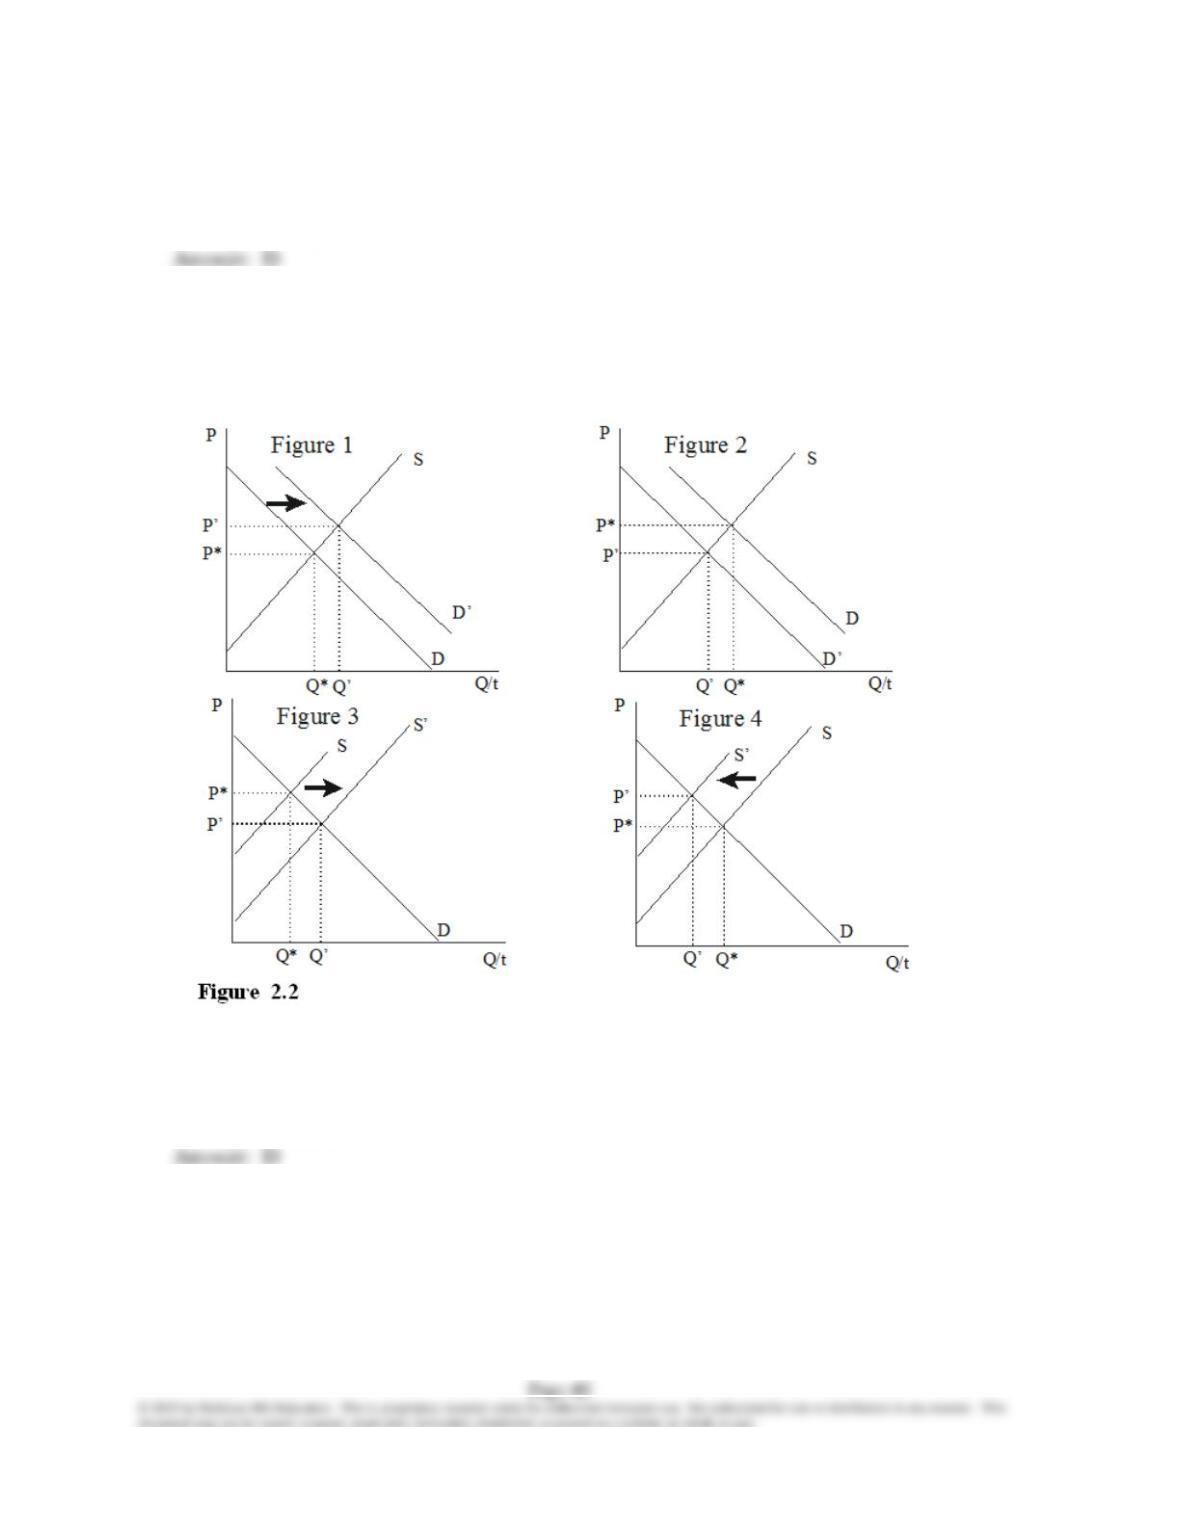
159) Of the collection of supply and demand diagrams in Figure 2.2, which one(s) could show
the result of an increase in income?
A) Figure 1
B) Figure 2
C) Figure 3
D) Figures 1 and 2
160) Of the collection of supply and demand diagrams in Figure 2.2, which one(s) could show
the result of a decrease in income?
A) Figure 1
B) Figure 2
C) Figure 3
D) Figures 1 and 2
161) Of the collection of supply and demand diagrams in Figure 2.2 which one shows the
result of an increase in the taste for a good?