2.4 Shocking the Equilibrium: Comparative Statics
1) From the 1970s through the 1990s, the relative price of a college education has increased greatly.
During the same time period, college enrollment has also increased. This evidence suggests that during
this time period
A) the demand curve for a college education has shifted leftward.
B) the demand curve for a college education has shifted rightward.
C) the supply curve for a college education has shifted leftward.
D) the supply curve for a college education has shifted rightward.
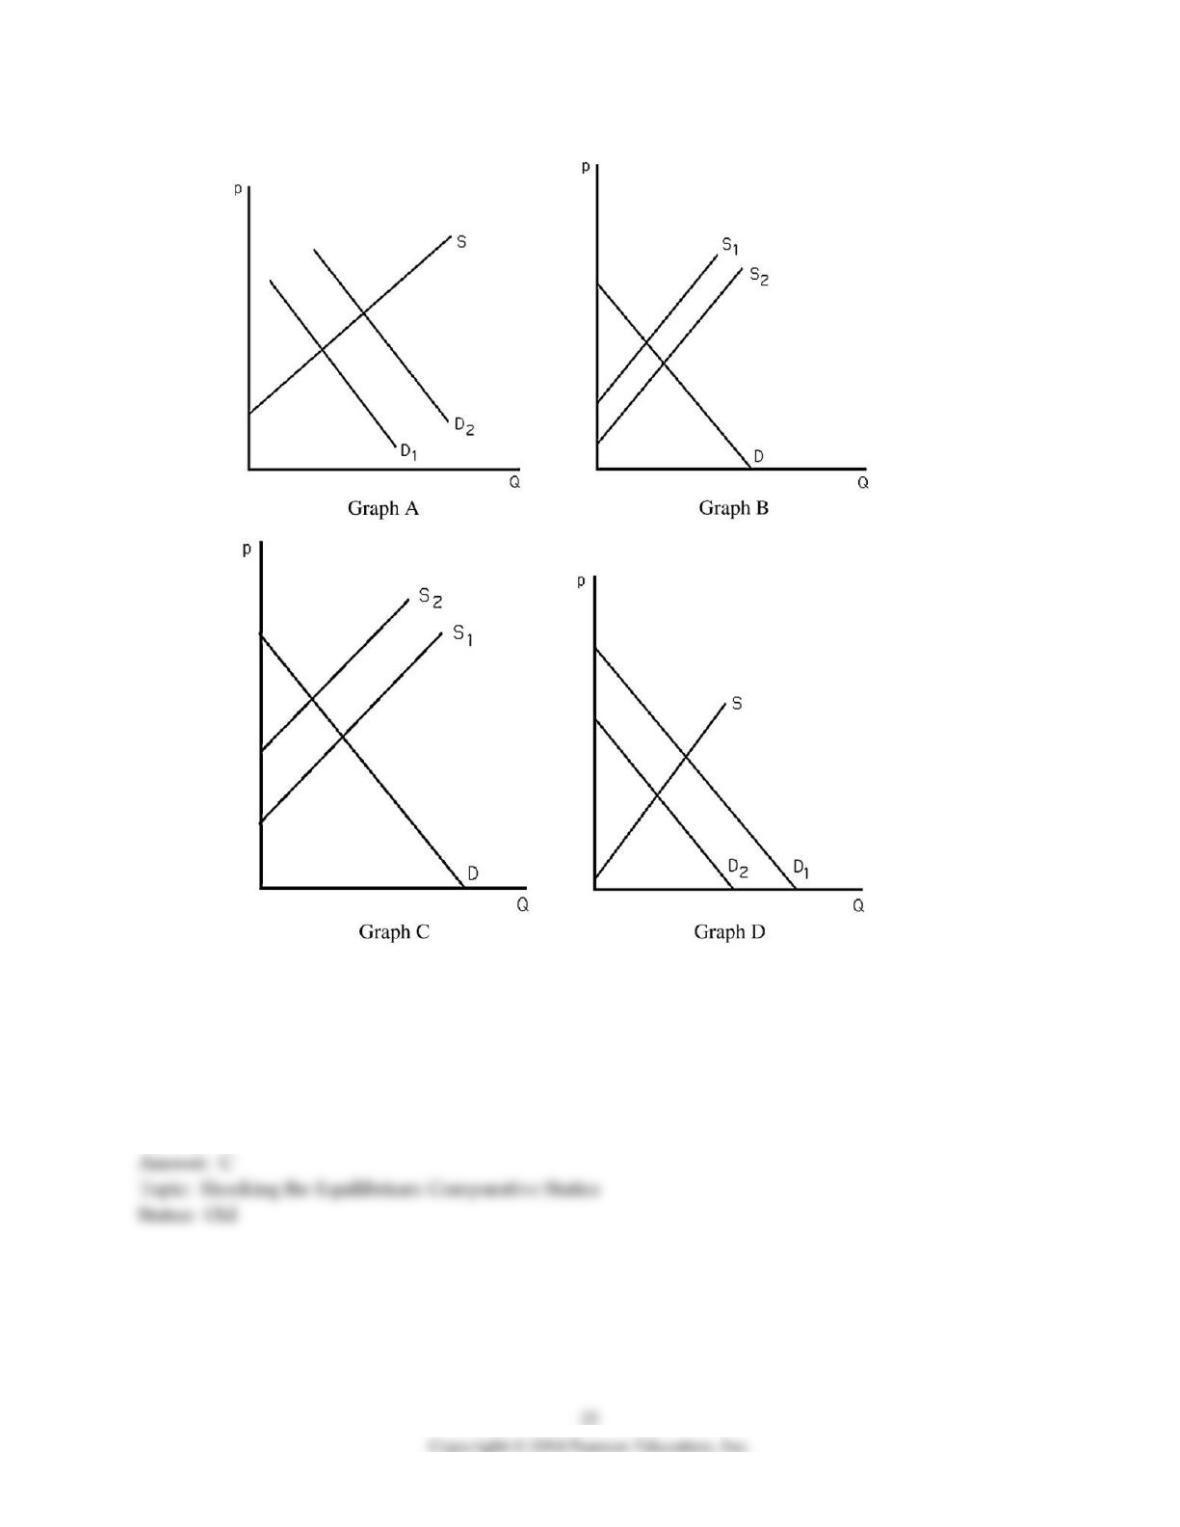
2) The above figure shows four different markets with changes in either the supply curve or the demand
curve. Which graph best illustrates the market for coffee after severe weather destroys a large portion of
the coffee crop?
A) Graph A
B) Graph B
C) Graph C
D) Graph D
3) The above figure shows four different markets with changes in either the supply curve or the demand
curve. Which graph best illustrates the market for tea after severe weather destroys a large portion of the
coffee crop?
A) Graph A
B) Graph B
C) Graph C
D) Graph D
4) The above figure shows four different markets with changes in either the supply curve or the demand
curve. Which graph best illustrates the market for non-dairy coffee creamer after severe weather destroys
a large portion of the coffee crop?
A) Graph A
B) Graph B
C) Graph C
D) Graph D
5) The above figure shows four different markets with changes in either the supply curve or the demand
curve. Which graph best illustrates the market for computers after technological advances in making
computers occur?
A) Graph A
B) Graph B
C) Graph C
D) Graph D
6) The above figure shows four different markets with changes in either the supply curve or the demand
curve. Which graph best illustrates the market for computer manuals after technological advances in
making computers occur?
A) Graph A
B) Graph B
C) Graph C
D) Graph D
7) The above figure shows four different markets with changes in either the supply curve or the demand
curve. Which graph best illustrates the market for typewriters after technological advances in
computerized word-processing software occur?
A) Graph A
B) Graph B
C) Graph C
D) Graph D
8) Suppose a market were currently at equilibrium. A rightward shift of the demand curve would cause
A) an increase in price but a decrease in quantity.
B) a decrease in price but an increase in quantity.
C) an increase in both price and quantity.
D) a decrease in both price and quantity.
9) Suppose a market were currently at equilibrium. A rightward shift of the supply curve would cause
a(n)
A) increase in price but a decrease in quantity.
B) decrease in price but an increase in quantity.
C) increase in both price and quantity.
D) decrease in both price and quantity.
10) A rightward shift of the demand curve will lead to an
A) increase in equilibrium price.
B) excess demand at the old equilibrium price.
C) increase in quantity supplied.
D) All of the above.
11) A rightward shift of the supply curve will lead to a(n)
A) decrease in equilibrium price.
B) excess supply at the old equilibrium price.
C) increase in quantity demanded.
D) All of the above.
12) If the demand curve is vertical a rightward shift of the supply curve will lead to
A) an increase in quantity supplied.
B) an increase in quantity demanded.
C) a decrease in quantity demanded.
D) a decrease in price.
13) When import restrictions are placed on a good, and as a result the price of the good increases, the
demand curve for that good will
A) shift rightward.
B) shift leftward.
C) become steeper.
D) be unaffected.
14) When two goods are substitutes, a shock that raises the price of one good causes the price of the other
good to
A) remain unchanged.
B) decrease.
C) increase.
D) change in an unpredictable manner.
15) A drought in the Midwest will raise the price of wheat because of a
A) leftward shift in the supply curve.
B) rightward shift in the supply curve.
C) leftward shift in the demand curve.
D) rightward shift in the demand curve.
16) If pizza and tacos are substitutes, a decrease in the price of tacos would lead to a
A) decrease in the demand curve for pizza.
B) decrease in the quantity demanded of pizza.
C) decrease in the price of pizza.
D) All of the above.
17) The supply and demand for wheat is given by QS = 200 + .2A + p and QD = 500 – p, where p is the price
of wheat and A is the amount of rainfall (inches per year). The effect of an incremental increase in rainfall
on equilibrium will be
A) a decrease the price of wheat by 10¢.
B) a decrease the price of wheat by 20¢.
C) an increase in the price of wheat by 20¢.
D) an increase in the price of wheat by 10¢.
18) The change in price that results from a leftward shift of the supply curve will be greater if
A) the demand curve is relatively steep than if the demand curve is relatively flat.
B) the demand curve is relatively flat than if the demand curve is relatively steep.
C) the demand curve is horizontal than if the demand curve is vertical.
D) the demand curve is horizontal than if the demand curve is downward sloping.
19) The change in price that results from a rightward shift in demand will be greater if
A) the supply curve is horizontal than if the supply curve is upward sloping.
B) the supply curve is relatively steep than if the supply curve is relatively flat.
C) the supply curve is upward sloping than if the supply curve is vertical.
D) the supply curve is horizontal than if the supply curve is vertical.
20) If the demand curve for a good is horizontal and the price is positive, then a leftward shift of the
supply curve results in
A) a price of zero.
B) an increase in price.
C) a decrease in price.
D) no change in price.
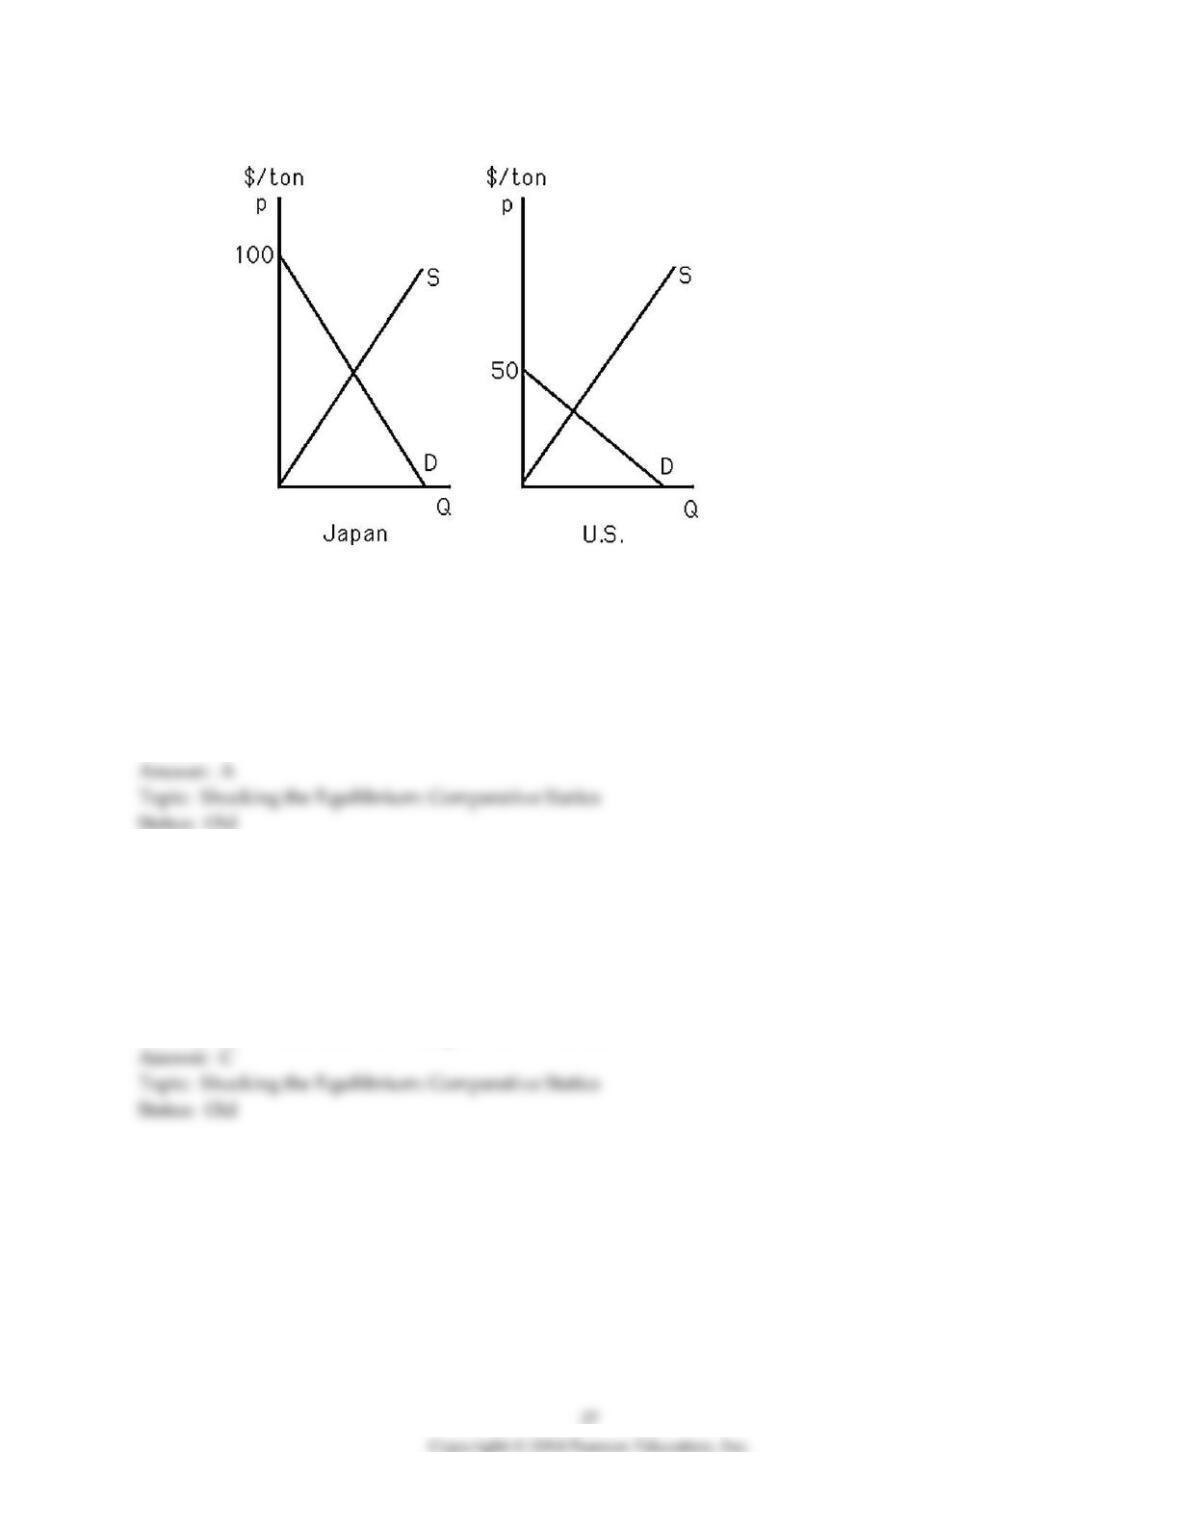
21) The above figure shows the supply and demand curves for rice in the U.S. and Japan. Assume there is
no trade between the two countries. If bad weather causes the supply curves in each country to shift
leftward by the same amount, then
A) the price will increase in both countries.
B) the price will decrease in both countries.
C) the change in price cannot be determined.
D) None of the above.
22) The above figure shows the supply and demand curves for rice in the U.S. and in Japan. Assume there
is no trade between the two countries. If bad weather causes the supply curves in each country to shift
leftward by the same amount, then
A) the price will increase the same amount in both countries.
B) the price will decrease the same amount in both countries.
C) the price will increase more in Japan than in the U.S.
D) the price will decrease more in Japan than in the U.S.
23) The above figure shows the supply and demand curves for rice in the U.S. and in Japan. Assume there
is no trade between the two countries. If fertilizer price drop causes the supply curves in both countries to
shift rightward by the same amount, then
A) the quantity will increase the same amount in both counties.
B) the quantity will decrease the same amount in both countries.
C) the quantity will increase more in Japan than in the U.S.
D) the quantity will increase more in the U.S. than in Japan.
24) A vertical demand curve results in
A) no change in quantity when the supply curve shifts.
B) no change in price when the supply curve shifts.
C) no change in the supply curve being possible.
D) no change in quantity when the demand curve shifts.
25) A vertical demand curve for a particular good implies that consumers are
A) sensitive to changes in the price of that good.
B) not sensitive to changes in the price of that good.
C) irrational.
D) not interested in that good.
26) Consider the following products. Which of them has the flattest demand curve?
A) insulin
B) alcohol
C) cigarettes
D) butter
27) If the supply curve of cigarettes shifts to the left, quantity demanded for cigarettes
A) will decrease substantially.
B) will increase substantially.
C) will slightly increase.
D) will slightly decrease.
For the following, please answer “True” or “False” and explain why.
28) During a mild winter, the price of home heating oil is expected to be less than it would be during a
normal winter.
29) Suppose the demand for widgets is given by QD = 100 – 5p – pd + 2I, where Y is average consumer
income, p is the price of lemons, and pd is the price of doodads. According to this equation, widgets are
an inferior good.
30) As the supply curve shifts to the right, the increase in quantity demanded will not depend on the
shape of the demand curve.
31) Explain why the shape of the demand curve will determine the how a shock to the market
equilibrium affect price and quantity.
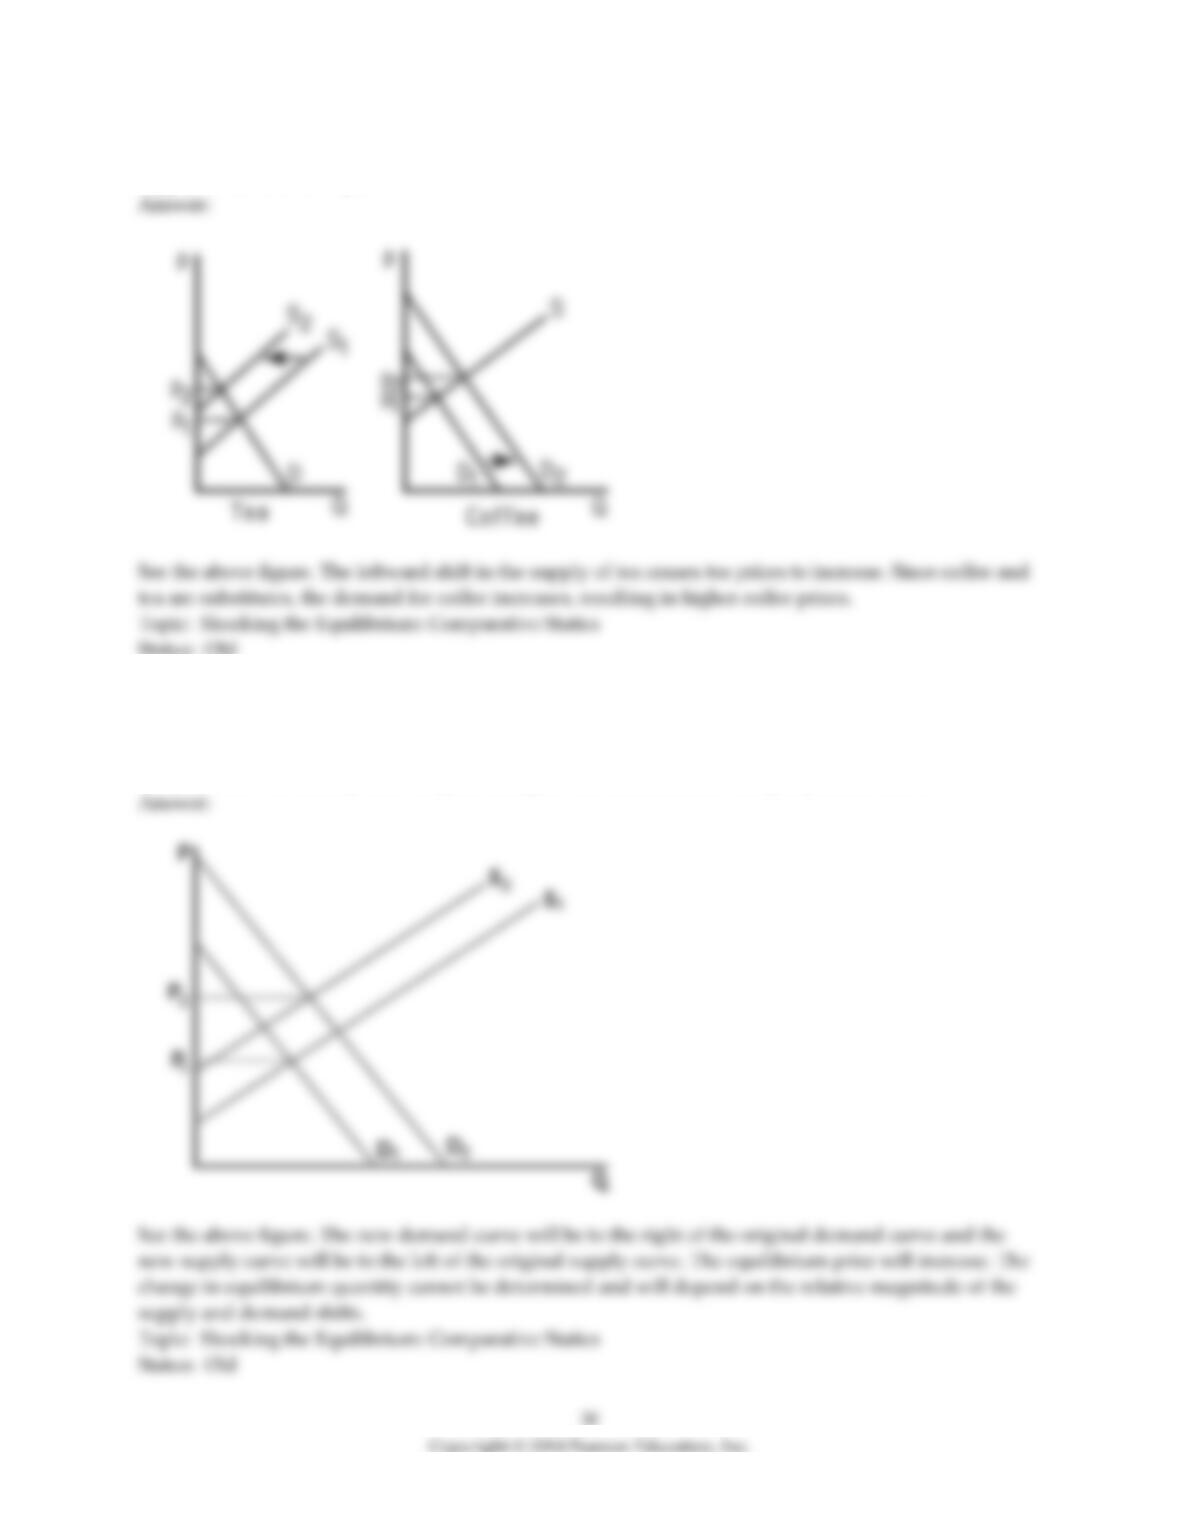
32) What happens to the equilibrium price and quantity of coffee when there is a leftward shift of the
supply curve for tea? Explain.
33) Suppose there is a linear downward-sloping demand curve and a linear upward-sloping supply curve
for a good. The price of a substitute good increases and the price of an input to production also increases.
Graph the original demand and supply curves, and the curves after the substitute good and input prices
increase. How will the equilibrium price change after the substitute and input prices increase?
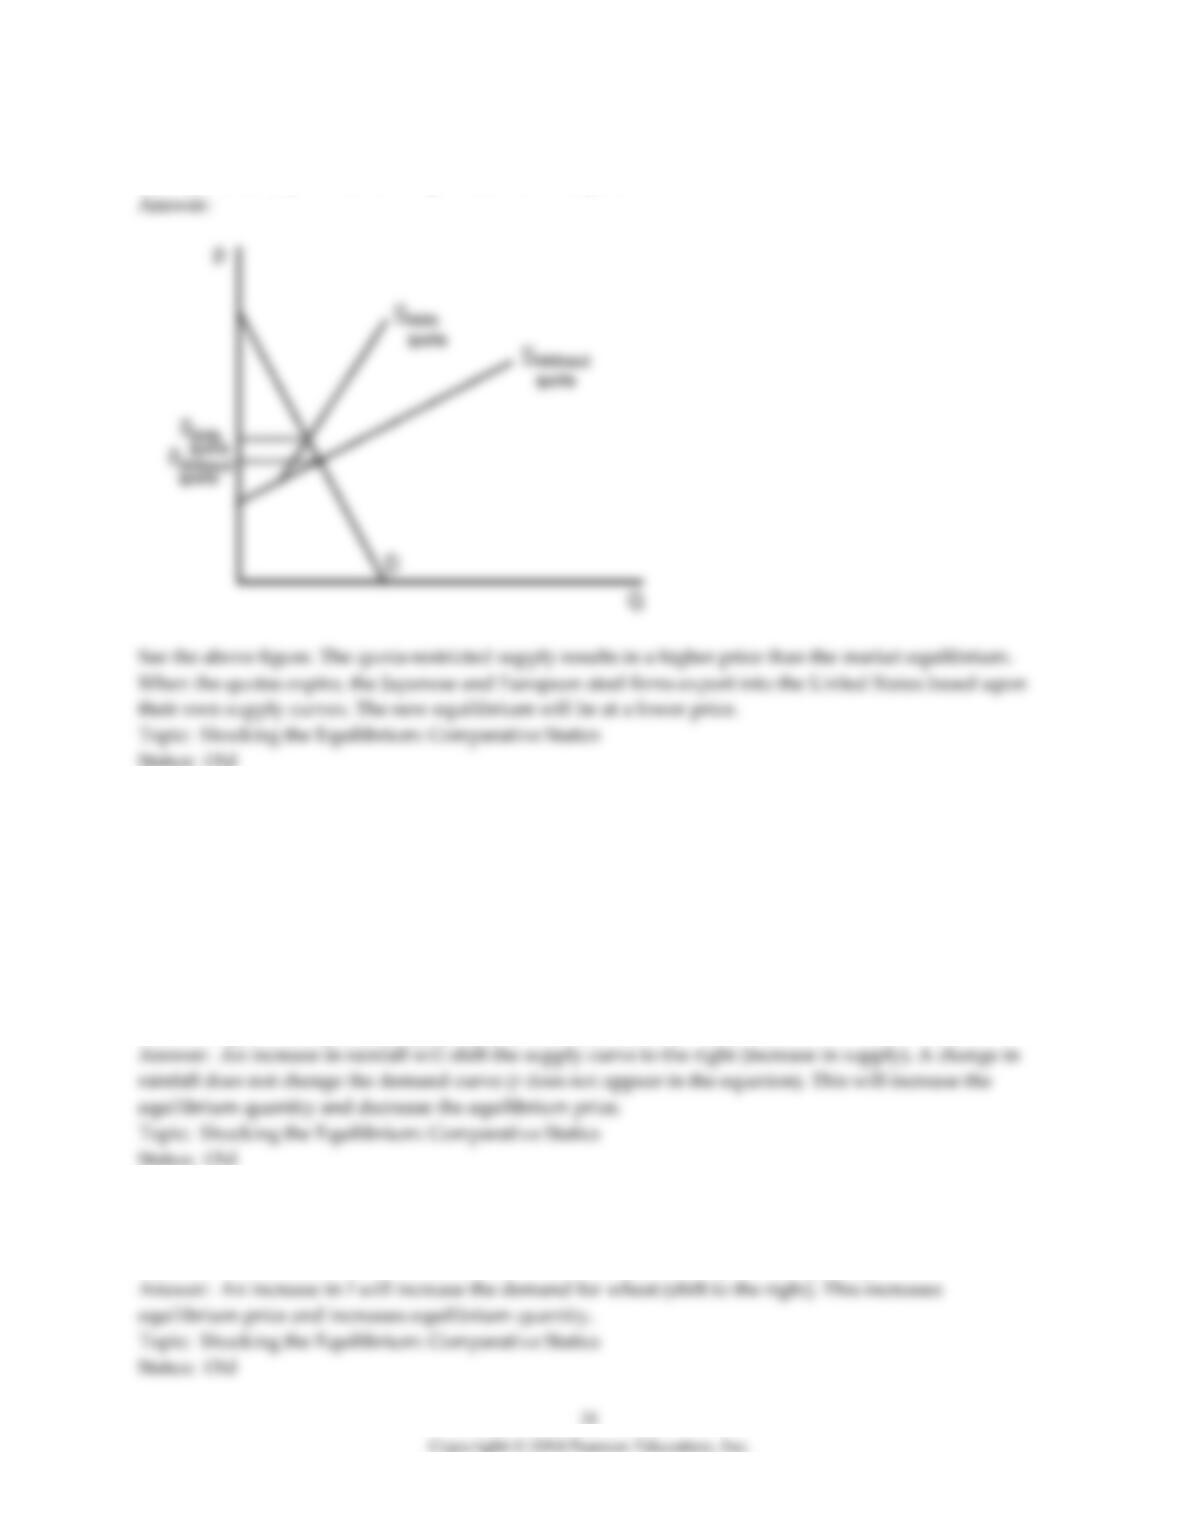
34) Use a supply-and-demand graph to predict what happens to sheet steel prices in the United States
after quotas on Japanese and European sheet steel expire.
35) Suppose that the supply and demand of wheat depend on the price of wheat (p), the amount of
annual rainfall (r), and the level of disposable consumer income (I). The equations describing the supply
and demand curves are given by:
QS = 20r + 100p
QD = 4000 – 100p + 10I
Sketch a graph of the supply and demand curves for wheat and show the effects of an increase in the
quantity of rainfall. How does each curve shift (if at all) from the increase in rainfall? What does this shift
do to the equilibrium price and quantity (increase/decrease)?
36) Using the supply and demand curve for wheat above, sketch the supply and demand curves
demonstrating the effect of an increase in disposable consumer incomes. How does each curve shift (if at
all) to the increase in income? What does the shift do to equilibrium price and quantity?
37) Using the supply and demand equations for wheat, solve for the equilibrium price and quantity as
functions of I and r.
38) Using the supply and demand equations for wheat above, determine how the equilibrium price and
quantity vary with an increase in rainfall(r) holding other factors that influence supply and demand
fixed. How do the equilibrium price and quantity change with an increase in income(I). Answer this
comparative statics question using calculus.
39) The local lemon market has the following supply and demand relationships:
QD = 100 – 5p – po + 2I
QS = 4p
where p is the price of lemons (per pound), Q is the quantity of lemons in pounds, I is the average
consumer income, and po is the price per pound of oranges. Derive the equilibrium price and quantity of
lemons as functions of the price of oranges and average consumer income. Use the calculus method of
comparative statics to compute the effects of income and the price of oranges on the equilibrium price
and quantity of lemons.
40) The demand curve for Widgets is given by
QD = 5800 – 200p + 30pG
where QD is the quantity of widgets demanded, y is the per capital income and pG is the price of Gizmos.
The supply of Widgets is given by:
QS = 250p – 1250
a. Solve for the equilibrium price and quantity of widgets in terms of the price of Gizmos.
b. Compute the comparative static derivatives for the changes in the equilibrium price and quantity of
Widgets with respect to a change in the price of Gizmos.
41) The supply and demand for wheat are given by
QS= 20 + 100p
QD = 4000 – 100p +10Y
Where Y is the average consumer income.
a. Compute the partial derivative of quantity demand with respect to changes in average consumer
income.
b. Solve for the equilibrium price and quantity as functions of the consumer income.
c. Compute the derivatives of the equilibrium price and quantity with respect to income.
2.5 Elasticities
1) The percentage change in the quantity demanded in response to a percentage change in the price is
known as the
A) slope of the demand curve.
B) excess demand.
C) price elasticity of demand.
D) All of the above.
2) Suppose the inverse demand curve for a good is expressed as Q = 50 – 2p. If the good currently sells for
$3, then the price elasticity of demand is
A) –3 ∗ (2/50).
B) –2 ∗ (50/3).
C) –2 ∗ (3/44).
D) –3 ∗ (44/2).
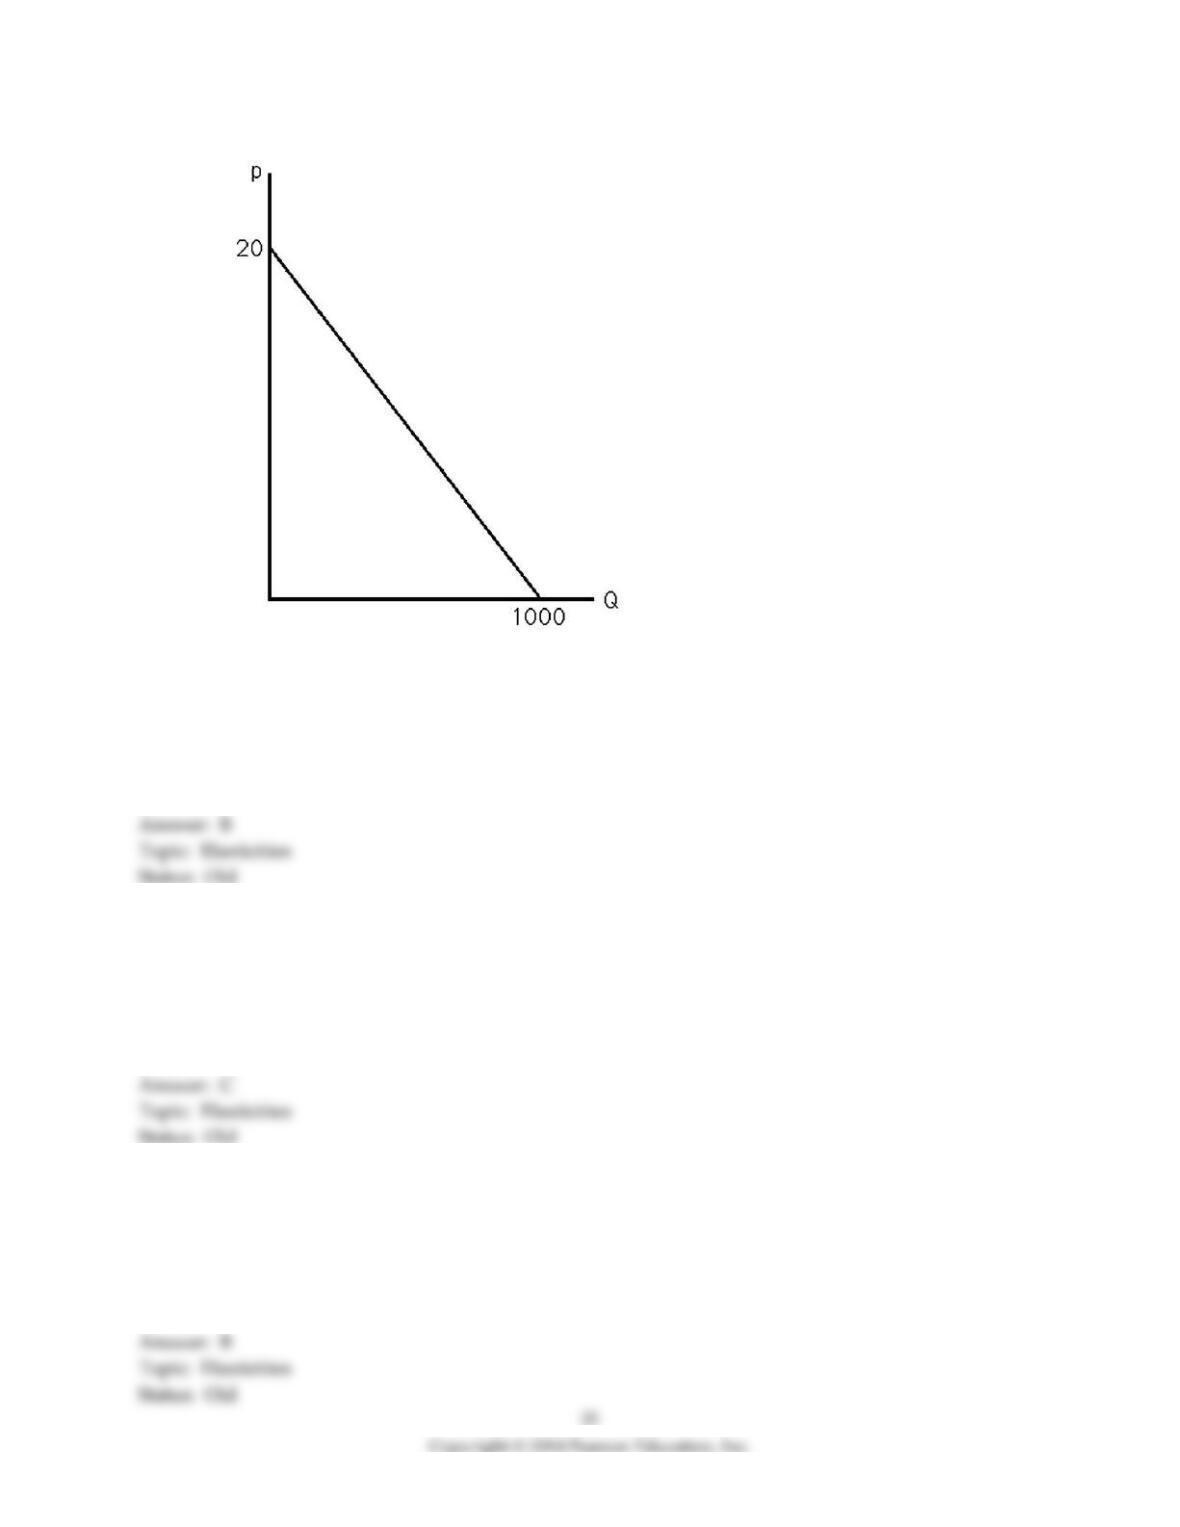
3) The above figure shows the demand curve for crude oil. If the market price is $10 a barrel, what is the
price elasticity of demand?
A) -.02
B) -1
C) –10
D) –500
4) The above figure shows the demand curve for crude oil. The demand curve has unitary price elasticity
when price equals
A) $0.
B) $1.
C) $10.
D) $20.
5) Suppose the demand function for a good is expressed as Q = 100 – 4p. If the good currently sells for $10,
then the price elasticity of demand equals
A) -1.5.
B) -0.67.
C) –4.
D) -2.5.
36
6) If an increase in income results in a rightward parallel shift of the demand curve, then at any given
price, the price elasticity of demand will have
A) increased in absolute terms.
B) decreased in absolute terms.
C) remained unchanged.
D) increased, decreased or stayed the same. It cannot be determined.
7) If the demand function for orange juice is expressed as Q = 2000 – 500p, where Q is quantity in gallons
and p is price per gallon measured in dollars, then the demand for orange juice has a unitary elasticity
when price equals
A) $0.
B) $1.
C) $2.
D) $4.
8) If the demand curve for orange juice is expressed as Q = 2000 – 500p, where Q is measured in gallons
and p is measured in dollars, then at the price of $3, elasticity equals
A) -0.33.
B) –3.
C) –9.
D) –17.
9) If the demand for orange juice is expressed as Q = 2000 – 500p, where Q is measured in gallons and p is
measured in dollars, then at the price of $3, the demand curve
A) is elastic.
B) has a unitary elasticity.
C) is inelastic.
D) is perfectly inelastic.
10) If the demand curve for comic books is expressed as Q = 10,000/p, then demand has a unitary
elasticity
A) only when p = 10,000.
B) only when p = 100.
C) always.
D) never.
11) If the demand curve for a good always has unitary price elasticity, what does this imply about
consumer behavior?
A) Consumers do not react to a price change.
B) Consumers will spend a constant total amount on the good.
C) Consumers are irrational.
D) Consumers do not obey the Law of Demand.
12) If the price elasticity of demand for a good is greater than one in absolute terms, we say that demand
is
A) elastic.
B) inelastic.
C) perfect.
D) vertical.
13) If the price elasticity of demand for a good is less than one in absolute terms, we say consumers of this
good
A) are not very sensitive to price.
B) are not very sensitive to the quantity they demand.
C) are very sensitive to price.
D) are elastic.
14) If the price of orange juice rises 10%, and as a result the quantity demanded falls by 8%, the price
elasticity of demand for orange juice is
A) -1.25.
B) inelastic.
C) Both A and B above.
D) Neither A nor B above.
15) If the price of orange juice rises 10%, and as a result the quantity demanded falls by 8%, the price
elasticity of demand for orange juice is
A) -1.25.
B) elastic.
C) Both A and B above.
D) Neither A nor B above.
16) If the price of orange juice rises 10%, and as a result the quantity demanded falls by 8%, the price
elasticity of demand for orange juice is
A) -1.25.
B) -80.0.
C) -0.80.
D) -10.0.
17) If the price of orange juice rises 10%, and as a result the quantity demanded falls by 10%, then one can
conclude that the demand for orange juice
A) is perfectly elastic.
B) is inelastic.
C) has a unitary elasticity.
D) has a constant elasticity.
18) A horizontal demand curve for a good could arise because consumers
A) are irrational.
B) are not sensitive to price changes.
C) view this good as identical to another good.
D) have no equivalent substitutes for this good.
19) Which of the following is most likely to be true?
A) Income elasticity of demand for fur coats exceeds that of oatmeal.
B) Income elasticity of demand for oatmeal exceeds that of fur coats.
C) Income elasticity of demand for fur coats equals that of oatmeal.
D) It is not possible to make any prediction about relative income elasticities.
20) If a consumer doubles her quantity of ice cream consumed when her income rises by 25%, then her
income elasticity of demand for ice cream is
A) 8.0.
B) 4.0.
C) .25.
D) .08.
21) If a good has an income elasticity of demand greater than one, one might classify that good as
A) a necessity.
B) a luxury.
C) unusual.
D) inelastic.
22) The price for tickets of a sold-out event increase by 30% but quantity sold remains unchanged. The
price elasticity of demand equals
A) 0.
B) 1.
C) infinity.
D) Cannot be determined.
23) The market demand for wheat is Q = 100 – 2p + 1pb, where pb is the price of barley. If the price of
wheat is $2, the price elasticity of demand
A) equals (-4/46).
B) equals (-46).
C) equals (-1).
D) cannot be calculated without more information.
24) How will a decrease in price affect a firm’s revenues?
A) It depends on the price elasticity of demand.
B) Revenues will stay the same.
C) Revenues will decrease.
D) Revenues will increase.
25) The cross price elasticity of demand for a good is the percentage change in the quantity demanded in
response to a given percentage change in
A) income.
B) the price of that good.
C) the price of another good.
D) the quantity demanded of another good.
26) The market demand for wheat is Q = 100 – 2p + 1pb, where pb is the price of barley. The cross price
elasticity of demand for wheat with respect to barley
A) cannot be calculated from just the information provided.
B) is negative.
C) suggests that wheat and barley are complements.
D) equals 1.
27) The market demand for wheat is Q = 100 – 2p + 1pb + 2Y. If the price of wheat, p, is $2, and the price of
barley, pb, is $3, and income, Y, is $1000, the income elasticity of wheat is
A) 2 ∗ (1000/2099).
B) 2.
C) 1/2 ∗ (1000/2099).
D) cannot be calculated from the information provided.
28) The cross price elasticity of demand between two goods will be positive if
A) the two goods are complements.
B) the two goods are substitutes.
C) the two goods are luxuries.
D) one of the goods is a luxury and the other is a necessity.
29) The percentage change in the quantity supplied in response to a percentage change in the price is
known as the
A) slope of the supply curve.
B) excess supply.
C) price elasticity of supply.
D) All of the above.