Multiple Choice Questions
1. The relationship that shows how much buyers of a product want to buy at each possible
price, holding fixed all other factors is called:
D. an indifference curve.
2. Two products are substitutes if:
D. individuals consume the goods together.
3. Two products are complements if:
A. a decrease in the price of one causes buyers to demand less of the other.
4. If an increase in the price of one good causes buyers to demand less of another good,
then the two goods are:
A. normal goods.
5. If an increase in the price of one good causes buyers to demand more of another good,
then the two goods are:
A. normal goods.
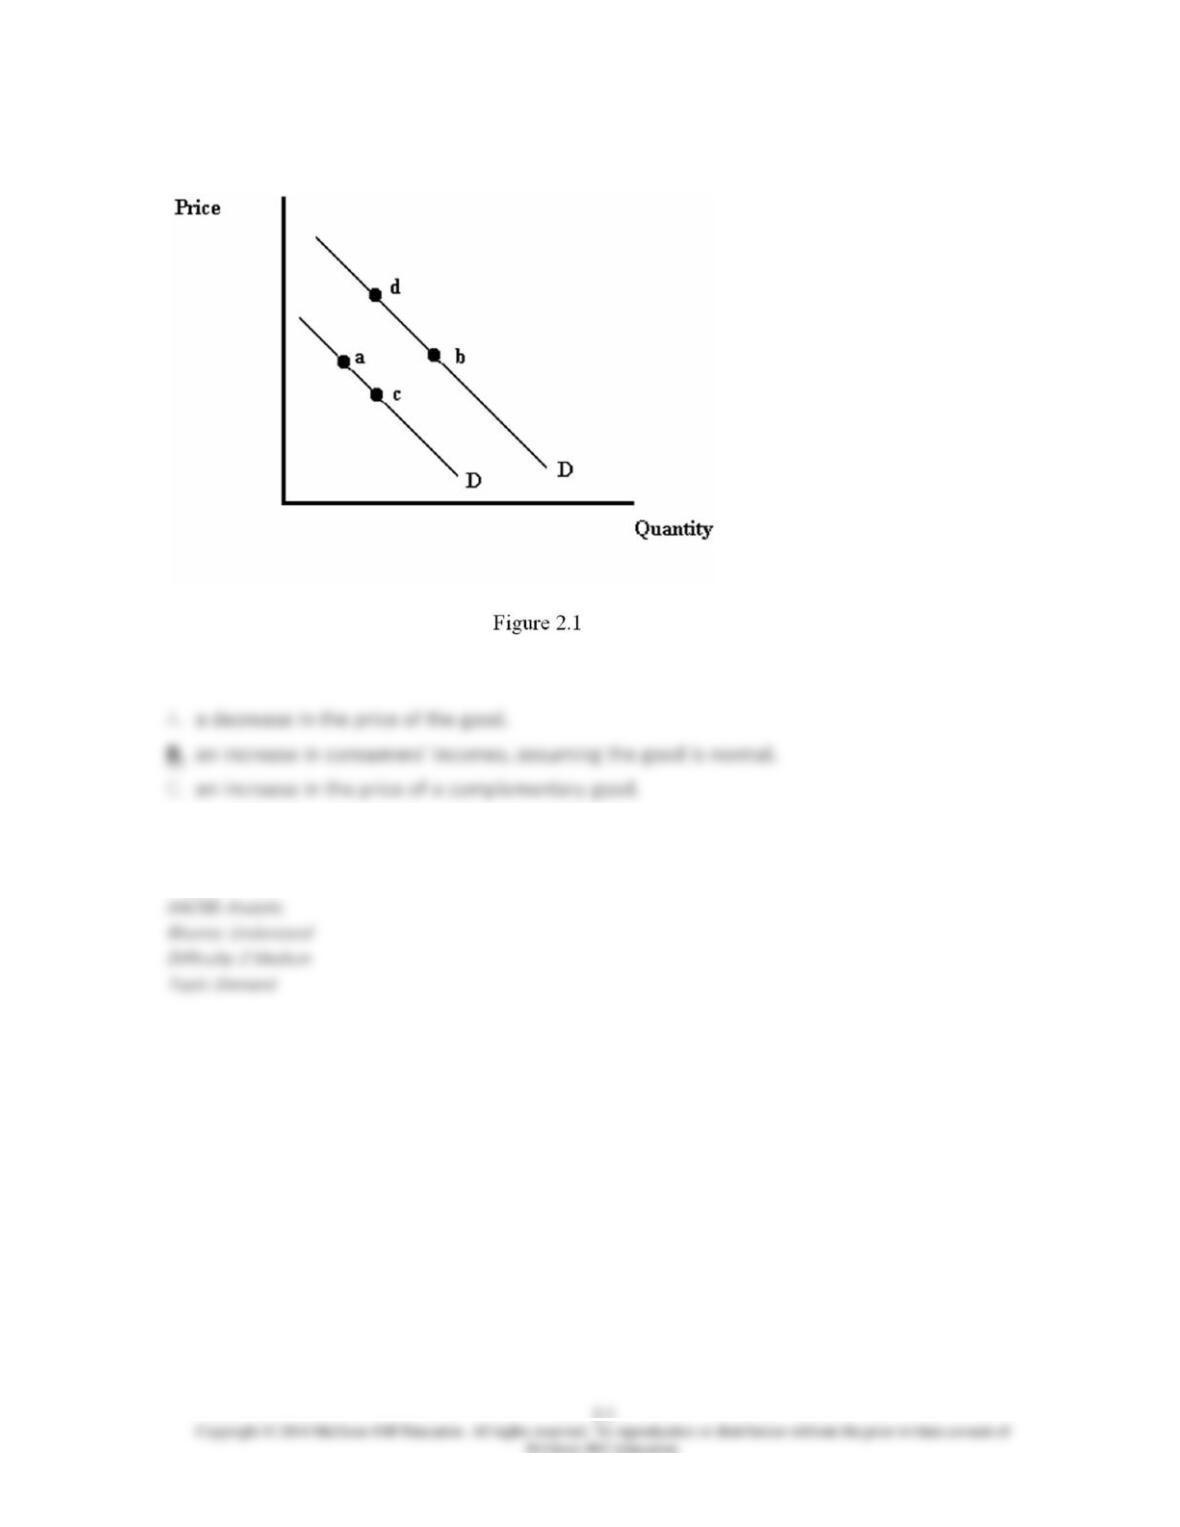
6. Refer to Figure 2.1. A movement from point
a
to point
b
is most likely caused by:
D. a decrease in consumers’ incomes, assuming the good is normal.
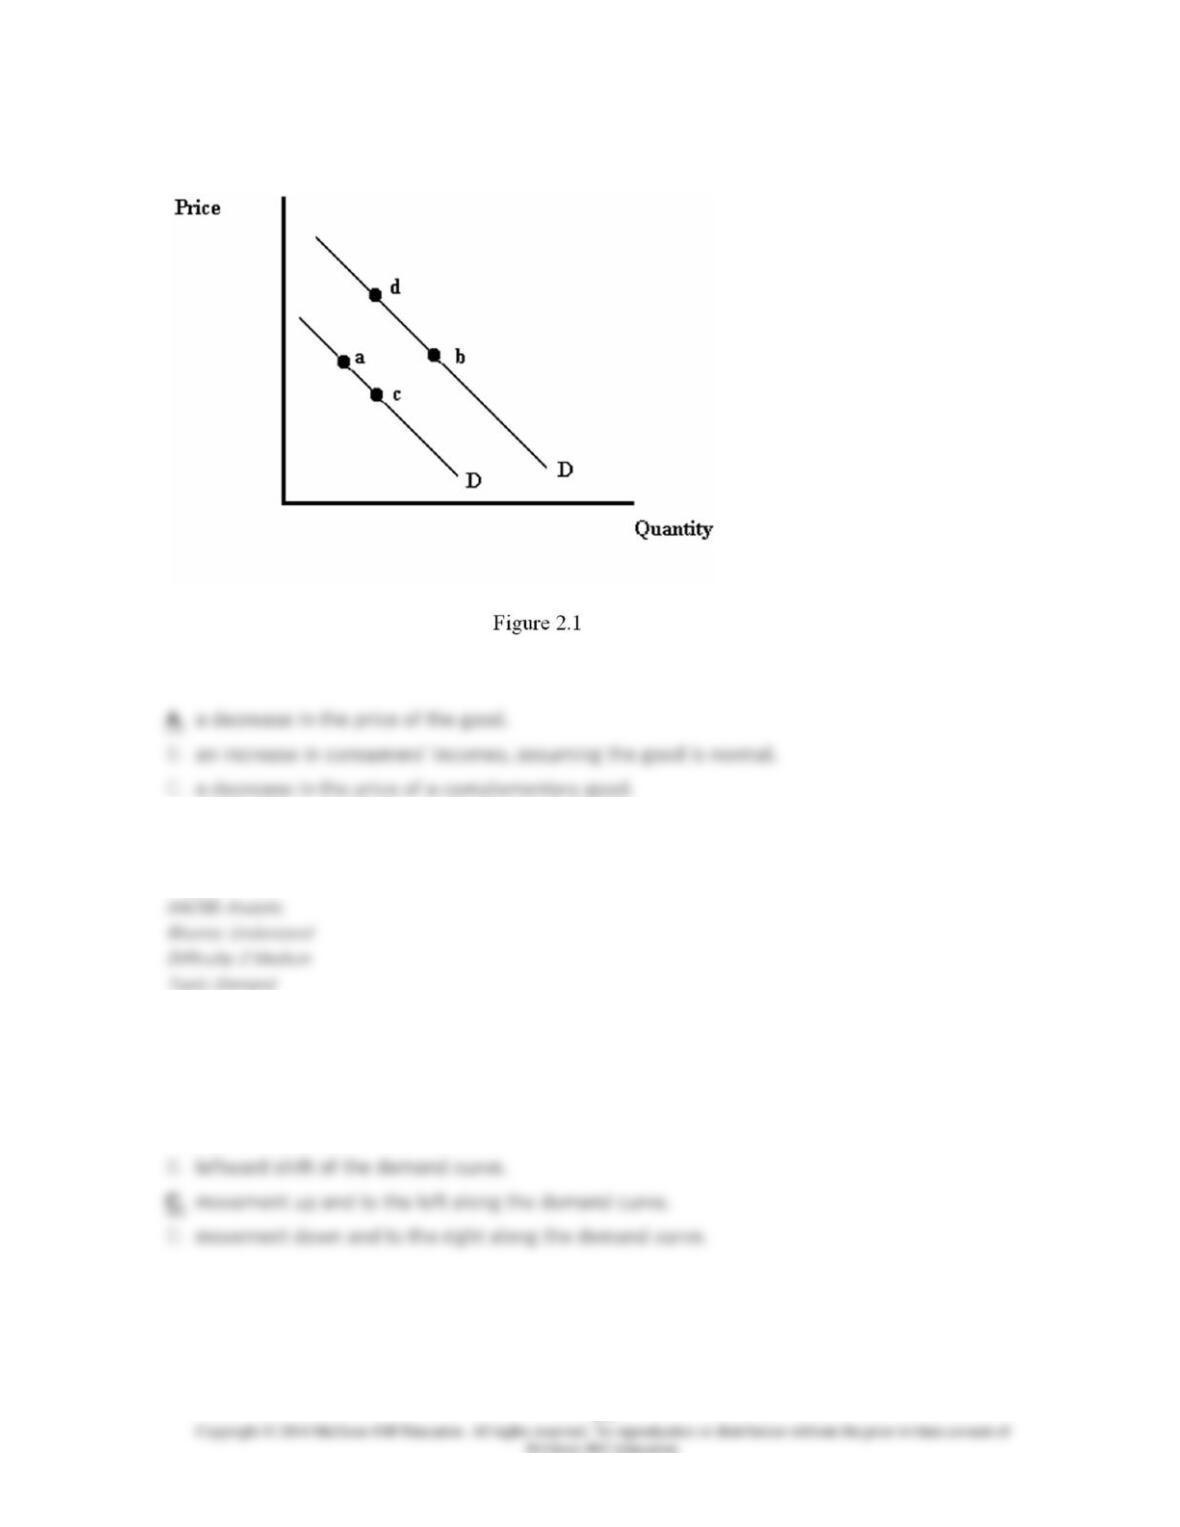
7. Refer to Figure 2.1. A movement from point
a
to point
c
is most likely caused by:
D. an increase in the price of the good.
8. An increase in the price of a good is shown by a:
A. rightward shift of the demand curve.
9. A change in demand of a good is shown by a:
D. shift of the demand function.
10. A product’s ________ describes the amount of the product that is demanded for each
possible combination of its price and other factors.
A. demand curve
11. The effect of an increase in the price of gasoline on the demand for sport utility vehicles
would be shown by a:
D. movement down and to the right along the demand curve for sport utility vehicles.
12. Suppose the demand function for cable TV service is given by QCTV = 15 – 0.25 × PCTV +
0.0005 × M + 0.3 × PSTV, where QCTV is the quantity of cable TV demanded (thousands of
households), PCTV is the price of cable TV, M is income and PSTV is the price of satellite TV service.
If consumers’ income is $50,000 and the price of satellite TV service is $90, then which of the
following gives the demand curve for cable TV?
D. QCTV = 13 – 0.25 × PCTV
13. Suppose the demand function for cable TV service is given by QCTV = 15 – 0.25 × PCTV +
0.0005 × M + 0.3 × PSTV, where QCTV is the quantity of cable TV demanded (thousands of
households), PCTV is the price of cable TV, M is income and PSTV is the price of satellite TV service.
We can see that:
D. cable TV service and satellite TV service are unrelated to one another.
14. Suppose the demand function for cable TV service is given by QCTV = 15 – 0.25 × PCTV +
0.0005 × M + 0.3 × PSTV, QCTV is the quantity of cable TV demanded (thousands of households),
PCTV is the price of cable TV, M is income and PSTV is the price of satellite TV service. Suppose
consumers’ income is $50,000 and the price of satellite TV service is $90. At what price would the
demand for cable TV services be equal to 55,000 households?
D. There is not enough information to answer the question.
15. Suppose the demand function for cable TV service is given by QCTV = 15 – 0.25 × PCTV +
0.0005 × M + 0.3 × PSTV, where QCTV is the quantity of cable TV demanded (thousands of
households), PCTV is the price of cable TV, M is income and PSTV is the price of satellite TV service.
We can see that:
D. satellite TV is an inferior good.
16. Suppose the demand function for cable TV service is given by QCTV = 15 – 0.25 × PCTV +
0.0005 × M + 0.3 × PSTV, QCTV is the quantity of cable TV demanded (thousands of households),
PCTV is the price of cable TV, M is income and PSTV is the price of satellite TV service. All else
equal, a $10 increase in the price of satellite TV will cause the quantity of cable TV demanded to:
D. increase by 5,000 households.
17. Suppose the demand function for cable TV service is given by QCTV = 15 – 0.25 × PCTV +
0.0005 × M + 0.3 × PSTV, QCTV is the quantity of cable TV demanded (thousands of households),
PCTV is the price of cable TV, M is income and PSTV is the price of satellite TV service. Suppose
consumers’ income is $50,000 and the price of satellite TV service is $90. How many households
would demand cable TV if it were free?
A. No households
18. A product’s ________ shows how much sellers of a product want to sell at each possible
price, holding all other factors fixed.
D. total product curve
19. An increase in the price of a good is shown by a:
A. movement up and to the left along the supply curve.
20. An increase in the price of milk would be shown by a:
D. movement down and to the left along the supply curve for milk.
21. Oil is an input used to produce gasoline. An increase in the price of oil would be
represented by:
D. a movement down and to the left along the supply curve for gasoline.
22. An improvement in the technology used to produce cell phones would be shown by a:
D. leftward shift of the demand curve for cell phones.
23. A change in the quantity supplied of a good is represented as a:
D. shift of the supply function.
24. Which of the following is a factor that affects both the supply of and demand for a good?
A. Technology
25. A product’s ______ describes the amount of the product that is supplied for each possible
combination of its price and other factors.
A. production function
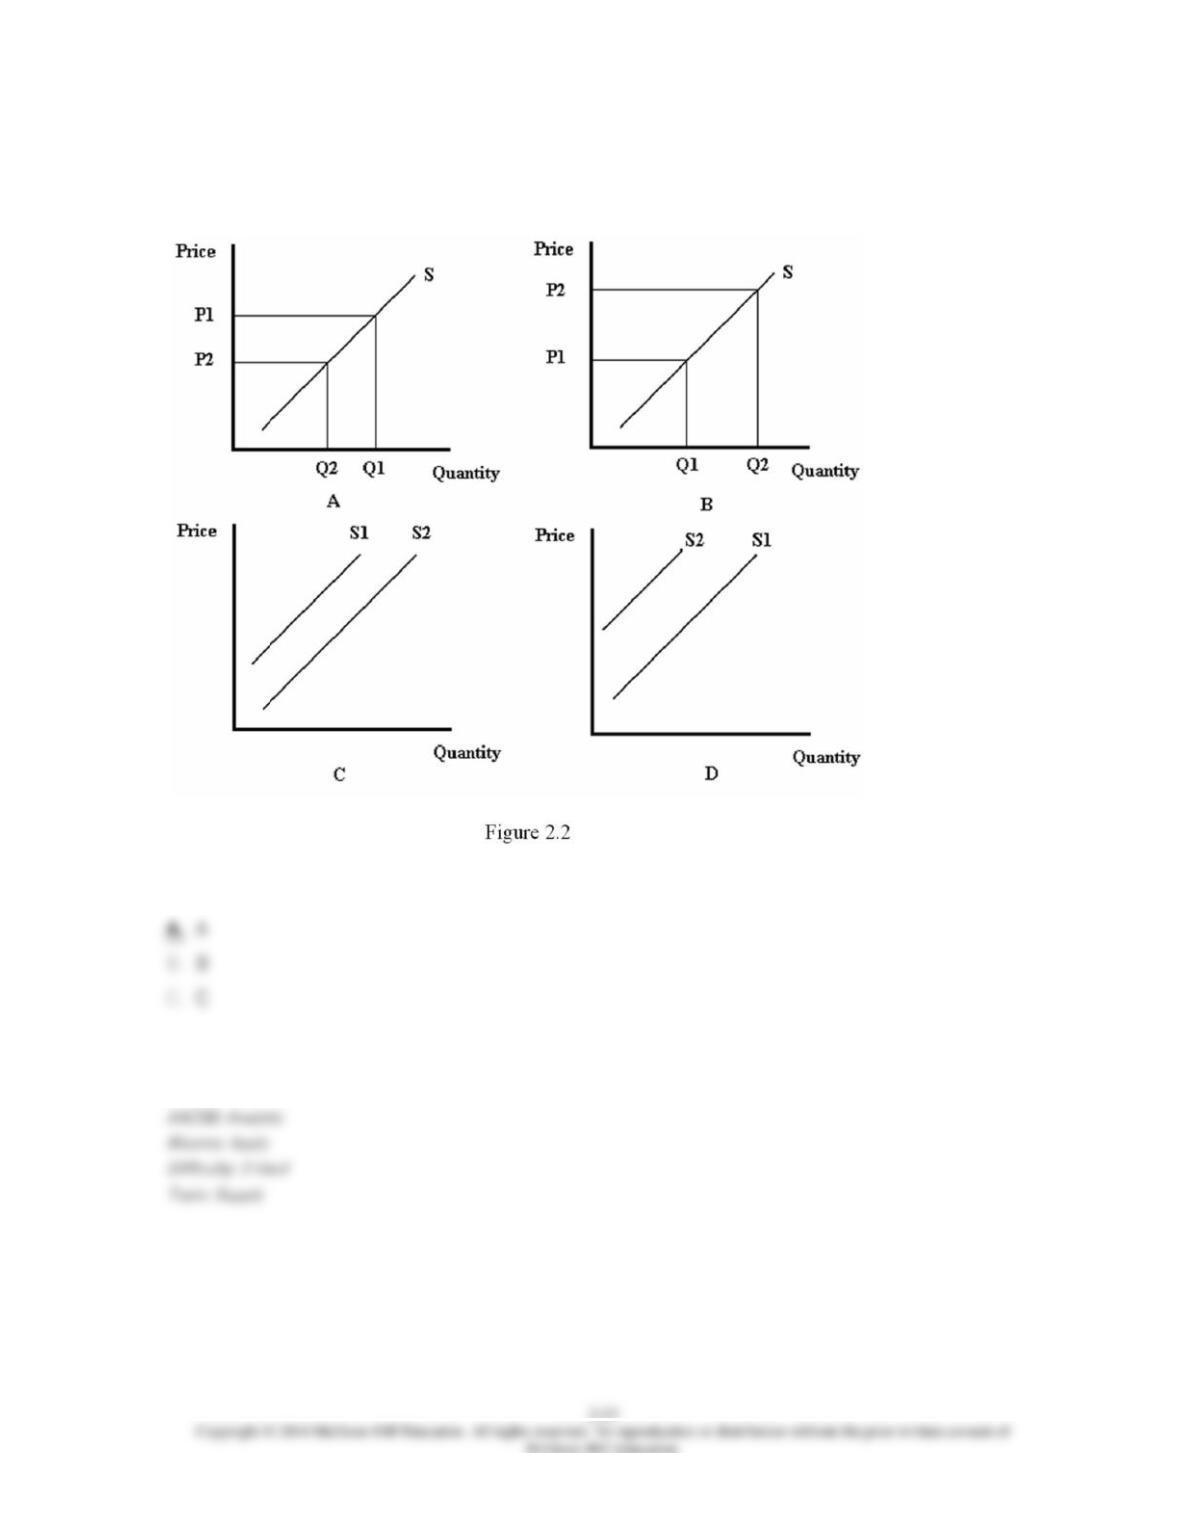
26. Refer to Figure 2.2. Which diagram represents the effect of a lower gasoline price on the
supply of gasoline?
D. D
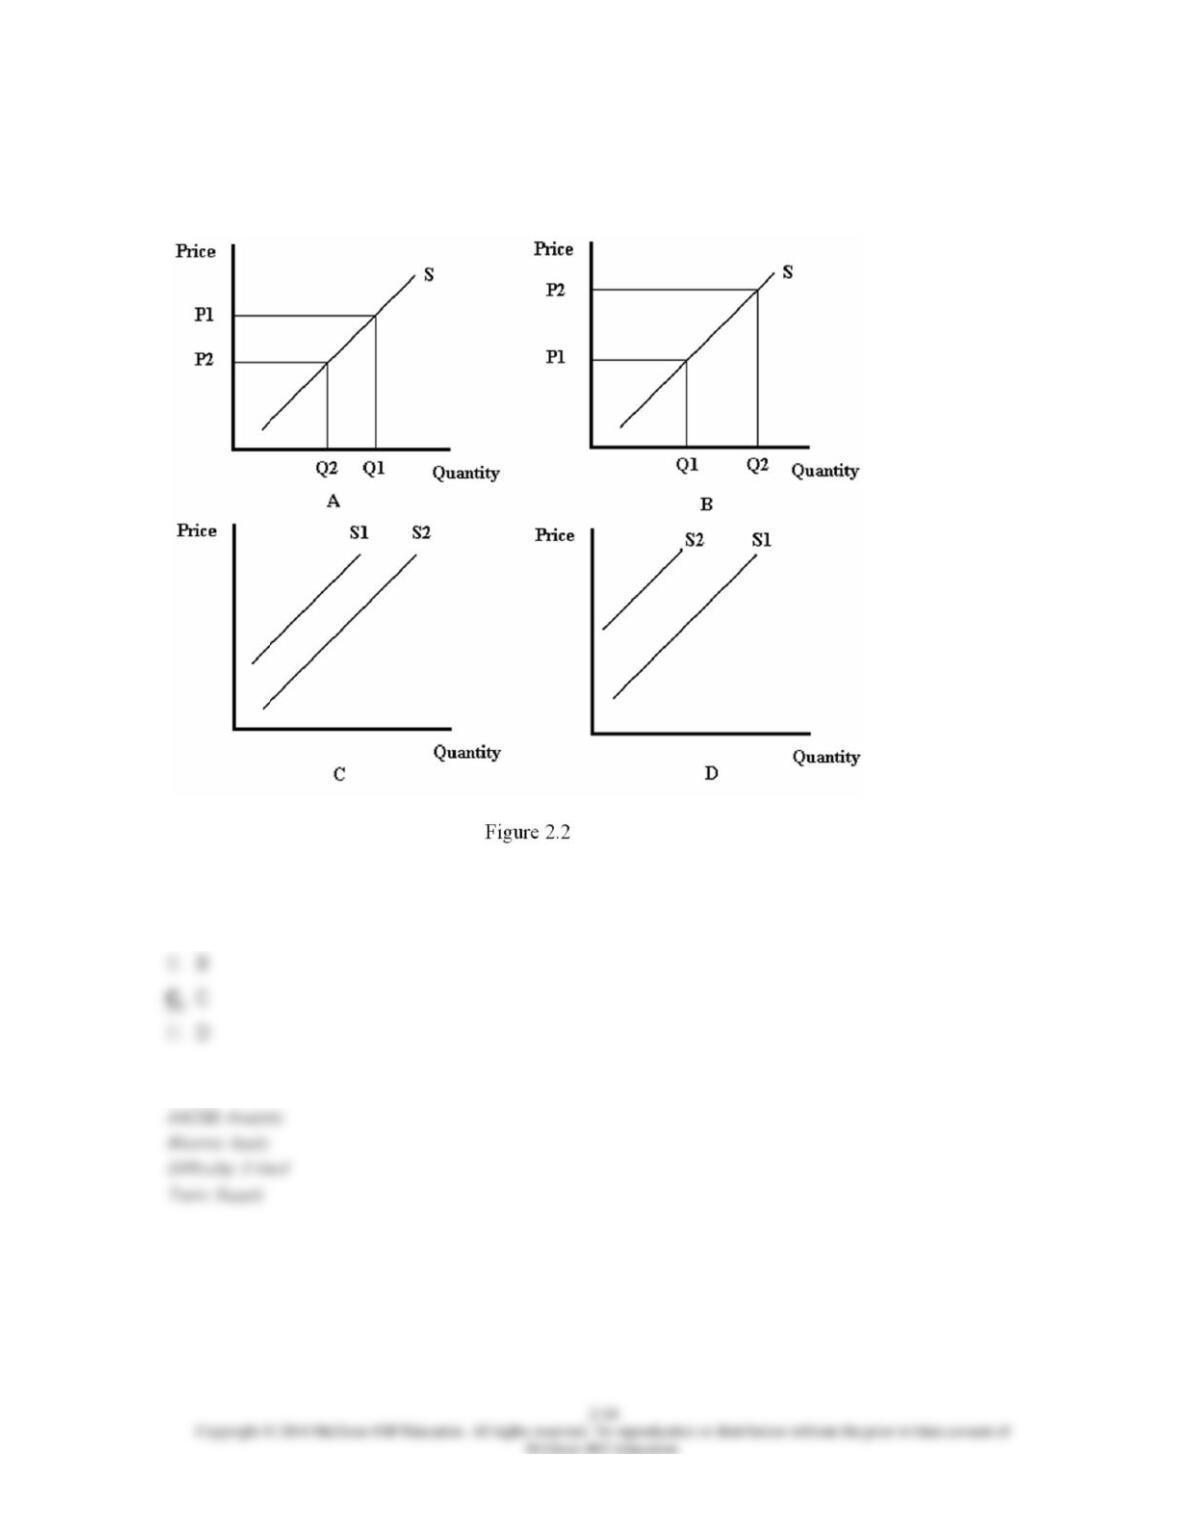
27. Refer to Figure 2.2. Which diagram best represents the effect of lower fertilizer prices on
the market for corn?
A. A
28. Consider the relationship given by QCars = 100 + 4 × PCars – 2 × PSteel – 0.2 × PWorkers, where
QCars is the quantity of cars supplied (in thousands), PCars is the price of cars (in thousands of
dollars), PSteel is the price of steel, and PWorkers is the wage earned by autoworkers. If the price of
steel is $10 per unit and the price of workers (the wage) is $20, what is the supply curve for cars?
A. QCars = 124 + 4 × PCars
29. Consider the relationship given by QCars = 100 + 4 × PCars – 2 × PSteel – 0.2 × PWorkers, where
QCars is the quantity of cars supplied (in thousands), PCars is the price of cars (in thousands of
dollars), PSteel is the price of steel, and PWorkers is the wage earned by autoworkers. What would be
the impact of a $15 increase in the price of steel?
D. The quantity of cars supplied would increase by 7,500 cars.
30. Consider the relationship given by QCars = 100 + 4 × PCars – 2 × PSteel – 0.2 × PWorkers, where
QCars is the quantity of cars supplied (in thousands), PCars is the price of cars (in thousands of
dollars), PSteel is the price of steel, and PWorkers is the wage earned by autoworkers. If the price of
steel is $10 per unit and the price of workers (the wage) is $20, how many cars will be supplied if
the price of cars is $20,000?
D. 960,000
31. Consider the relationship given by QCars = 100 + 4 × PCars – 2 × PSteel – 0.2 × PWorkers, where
QCars is the quantity of cars supplied (in thousands), PCars is the price of cars (in thousands of
dollars), PSteel is the price of steel, and PWorkers is the wage earned by autoworkers. If the price of
steel is $10 per unit and the price of workers (the wage) is $20, at what price would there be
164,000 cars supplied?
A. $10,000
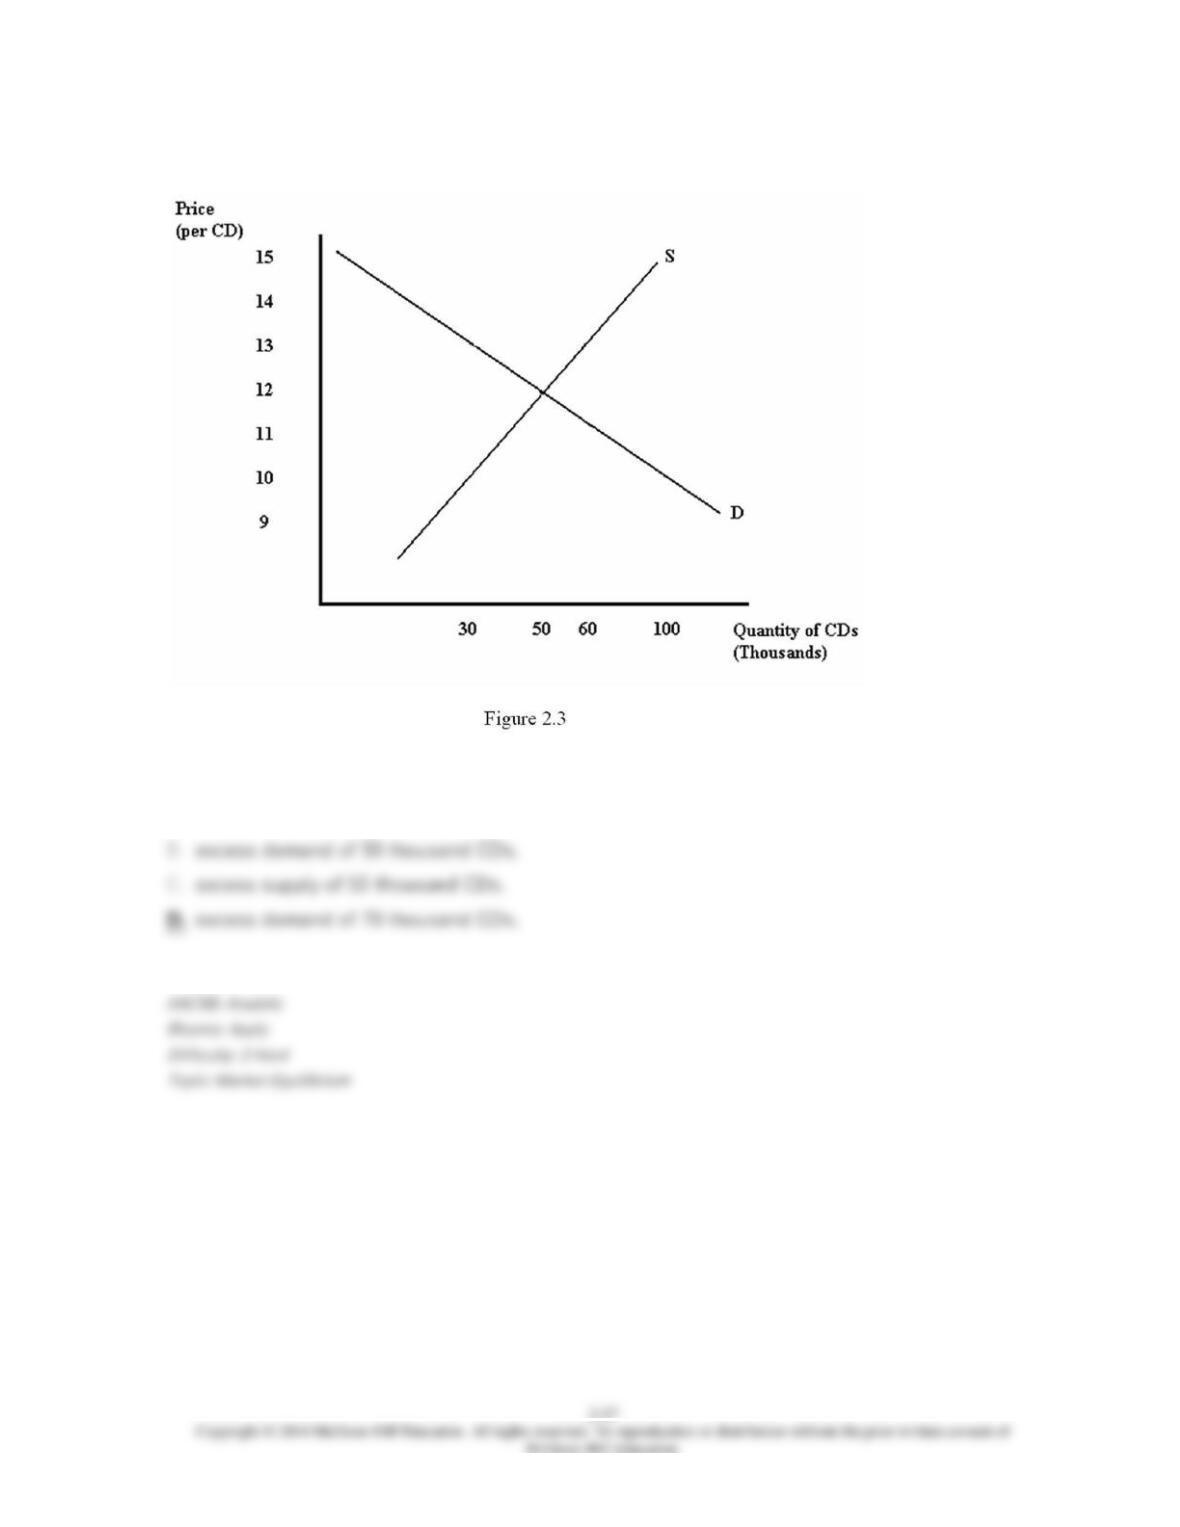
32. Refer to Figure 2.3. At a price of $10 per CD, there would be:
A. excess supply of 70 thousand CDs.
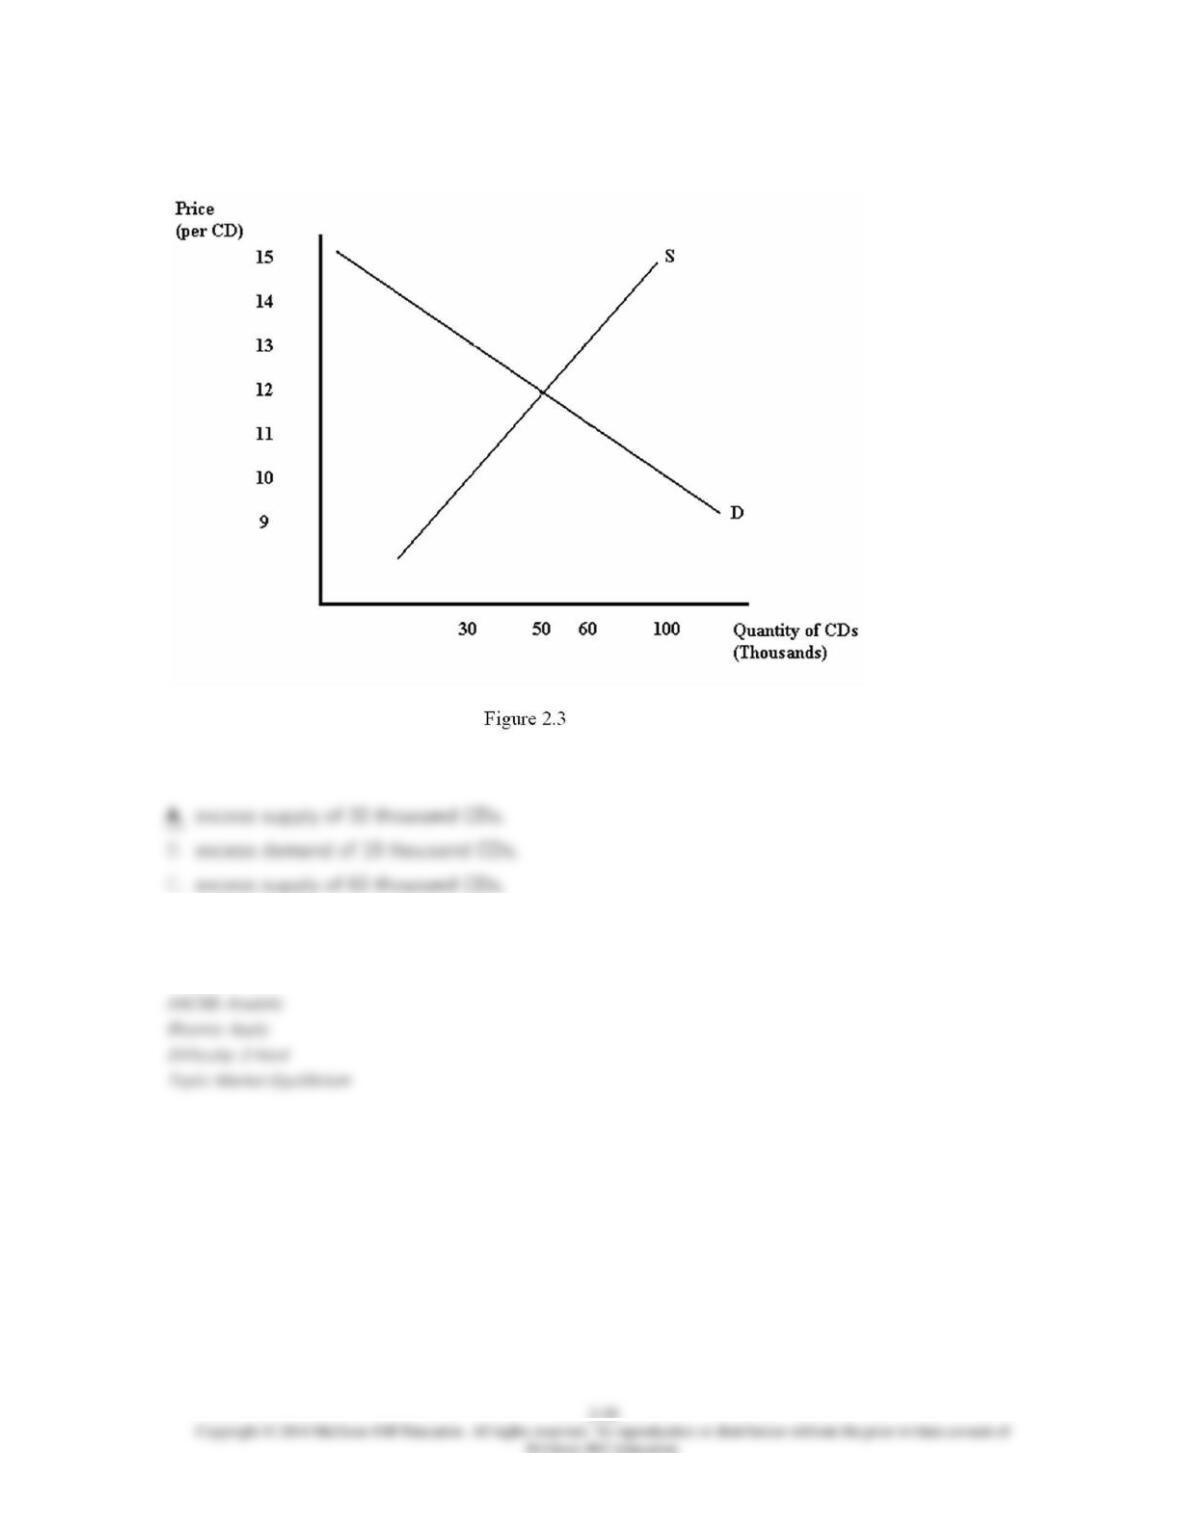
33. Refer to Figure 2.3. At a price of $13 per CD, there would be:
D. excess demand of 60 thousand CDs.
34. Suppose that the demand for movies is given by Qd = 30 – 2 × PMovies and the supply is
given by Qs = 2 + 2 × PMovies. What is the equilibrium price and quantity of movies?
A. PMovies = $7, Q = 30
35. Which of the following best describes the process that occurs when the price of a good is
below equilibrium?
D. The excess supply for the good provides an incentive for buyers to offer a lower price. These
lower prices encourage sellers to supply less of the good.
36. Excess supply is:
A. the result of a price that is above equilibrium, causing the quantity demanded to exceed the
quantity supplied.
37. Which economist is credited with originating the use of supply and demand analysis?
A. Vernon Smith
38. Which economist won the Nobel Prize for using experiments to test the model of supply
and demand?
D. Steven Levitt