File: Chapter 02 The Production Possibility Model, Trade, and Globalization
True/False
[Question]
1. The production possibility model can be used to demonstrate the concept of opportunity cost.
2. Production possibility curves are upward-sloping because increased production of one good
implies reduced production of other goods.
3. An economy that operates inside its production possibility curve is less efficient than it would
be if it were operating on its production possibility curve.
4. If the principle of increasing marginal opportunity cost holds, the opportunity cost of
producing each additional unit of a good should fall as production of that good rises.

5. Productive efficiency is not achieved at any point inside the production possibility curve.
6. If a country has a comparative advantage in the production of a good, its resources are better
suited to the production of that good than are the resources of other countries.
7. Two nations with differing comparative advantages will be able to consume more if they
specialize and trade with each other than if they did not specialize or trade with each other.
8. Two nations with differing comparative advantages will be able to consume more if each
produces the good for which the opportunity cost is highest and trades for the good for which
opportunity cost is lowest.
9. The law of one price means that prices eventually will be the same in all countries and
eventually countries will not have a reason to trade.
10. Which of the following cannot be determined by using a production possibility table?
A. What combination of outputs can be produced
B. How much less of one output must be produced if more of another output is produced
C. What combination of outputs is best
D. How much output can be produced from a given level of inputs
11. Suppose each of the following rows represents the choice faced by policy makers given the
current set of U.S. institutions and technology. What is the opportunity cost of reducing
unemployment from 8 percent to 4 percent?
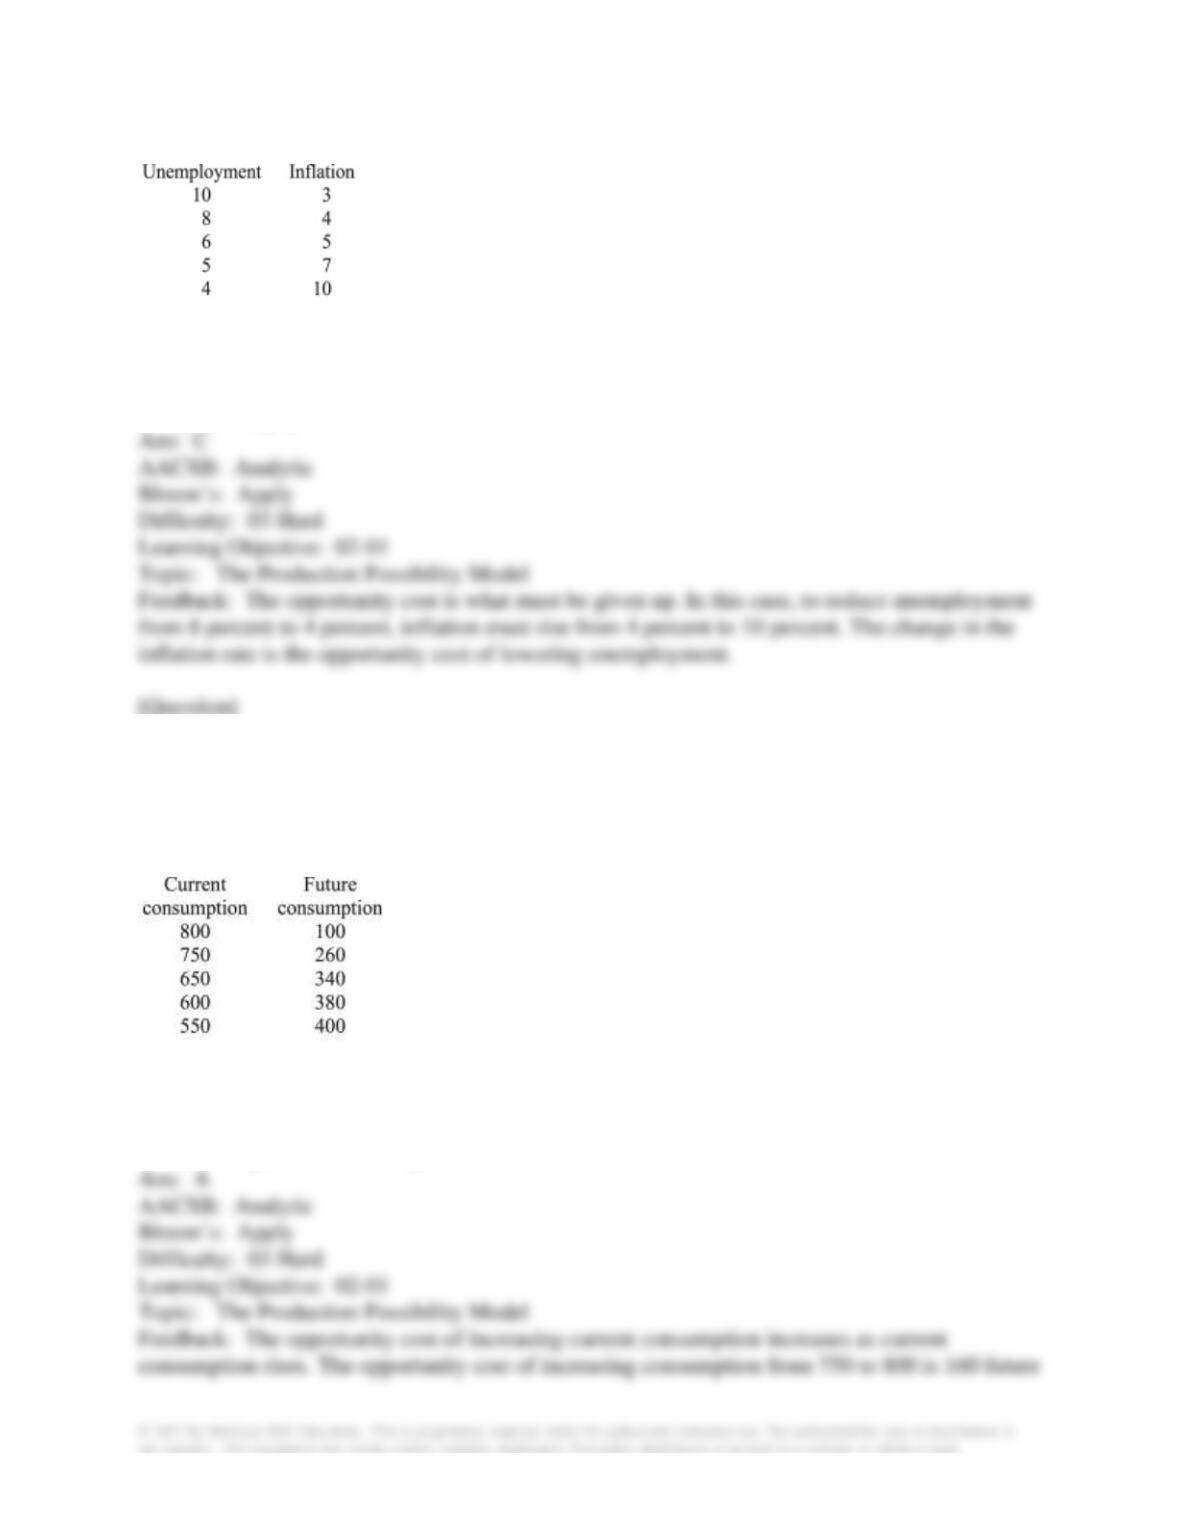
A. 4 percentage points of unemployment
B. 6 percentage points of unemployment
C. 6 percentage points of inflation
D. 4 percentage points of inflation
12. Investment in capital goods is one way to increase the standard of living in the future.
Investment in capital goods, however, means that we must forgo consumption today. One of the
trade-offs facing an economy is consumption today and consumption in the future. The following
table presents such a trade-off. With this information we know that the opportunity cost of which
of the following is the greatest?
A. increasing current consumption from 750 to 800
B. increasing current consumption from 650 to 750
C. increasing current consumption from 600 to 650
D. increasing current consumption from 550 to 600
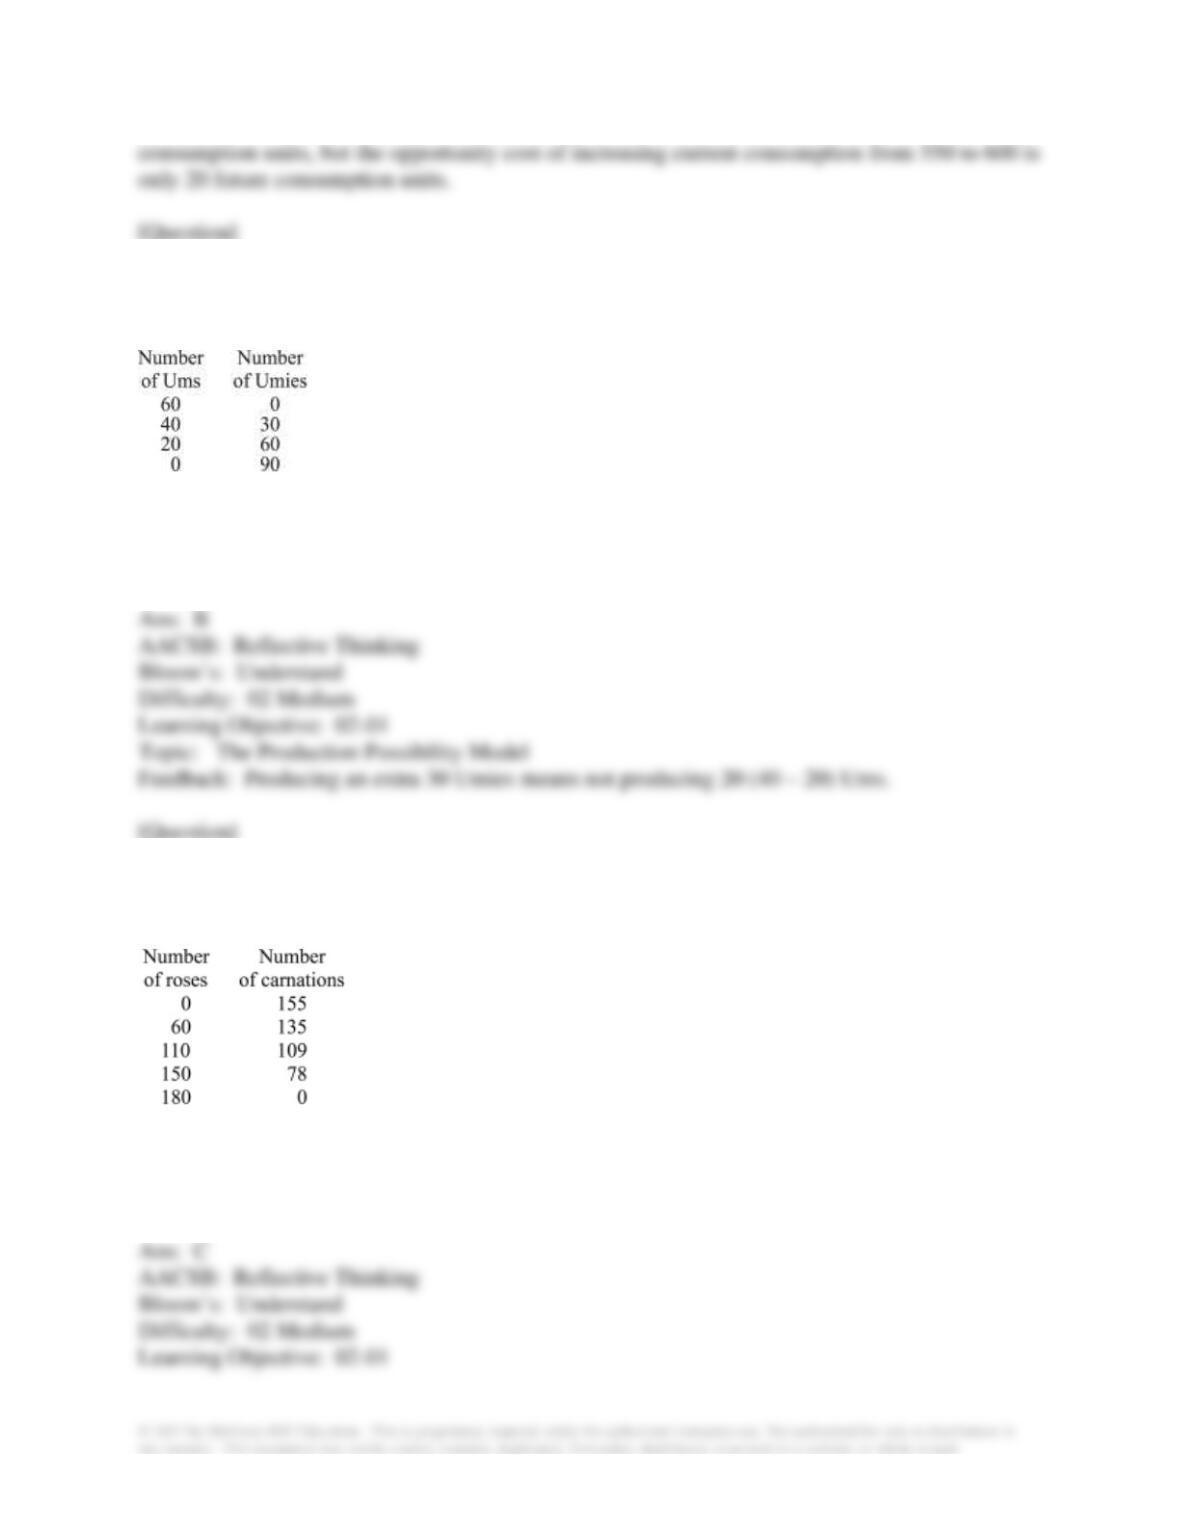
13. With the resources available, you can make the combinations of Ums and Umies (trinkets
from a place called Bandarban) shown in the table. The opportunity cost of producing 60 Umies
instead of 30 Umies is:
A. 10 Ums
B. 20 Ums
C. 30 Ums
D. 40 Ums
14. Evan can grow both roses and carnations in his garden. His production possibility table is
shown below. If he is currently producing 110 roses, his opportunity cost of producing 40 more
roses is:
A. 20 carnations
B. 26 carnations
C. 31 carnations
D. 78 carnations
15. Consider the table below, in which each production choice represents a point on a
production possibility curve.
This production possibility table could be graphed as a:
A. straight line with negative slope.
B. curved line with negative slope.
C. straight line with zero slope.
D. curved line with positive slope.
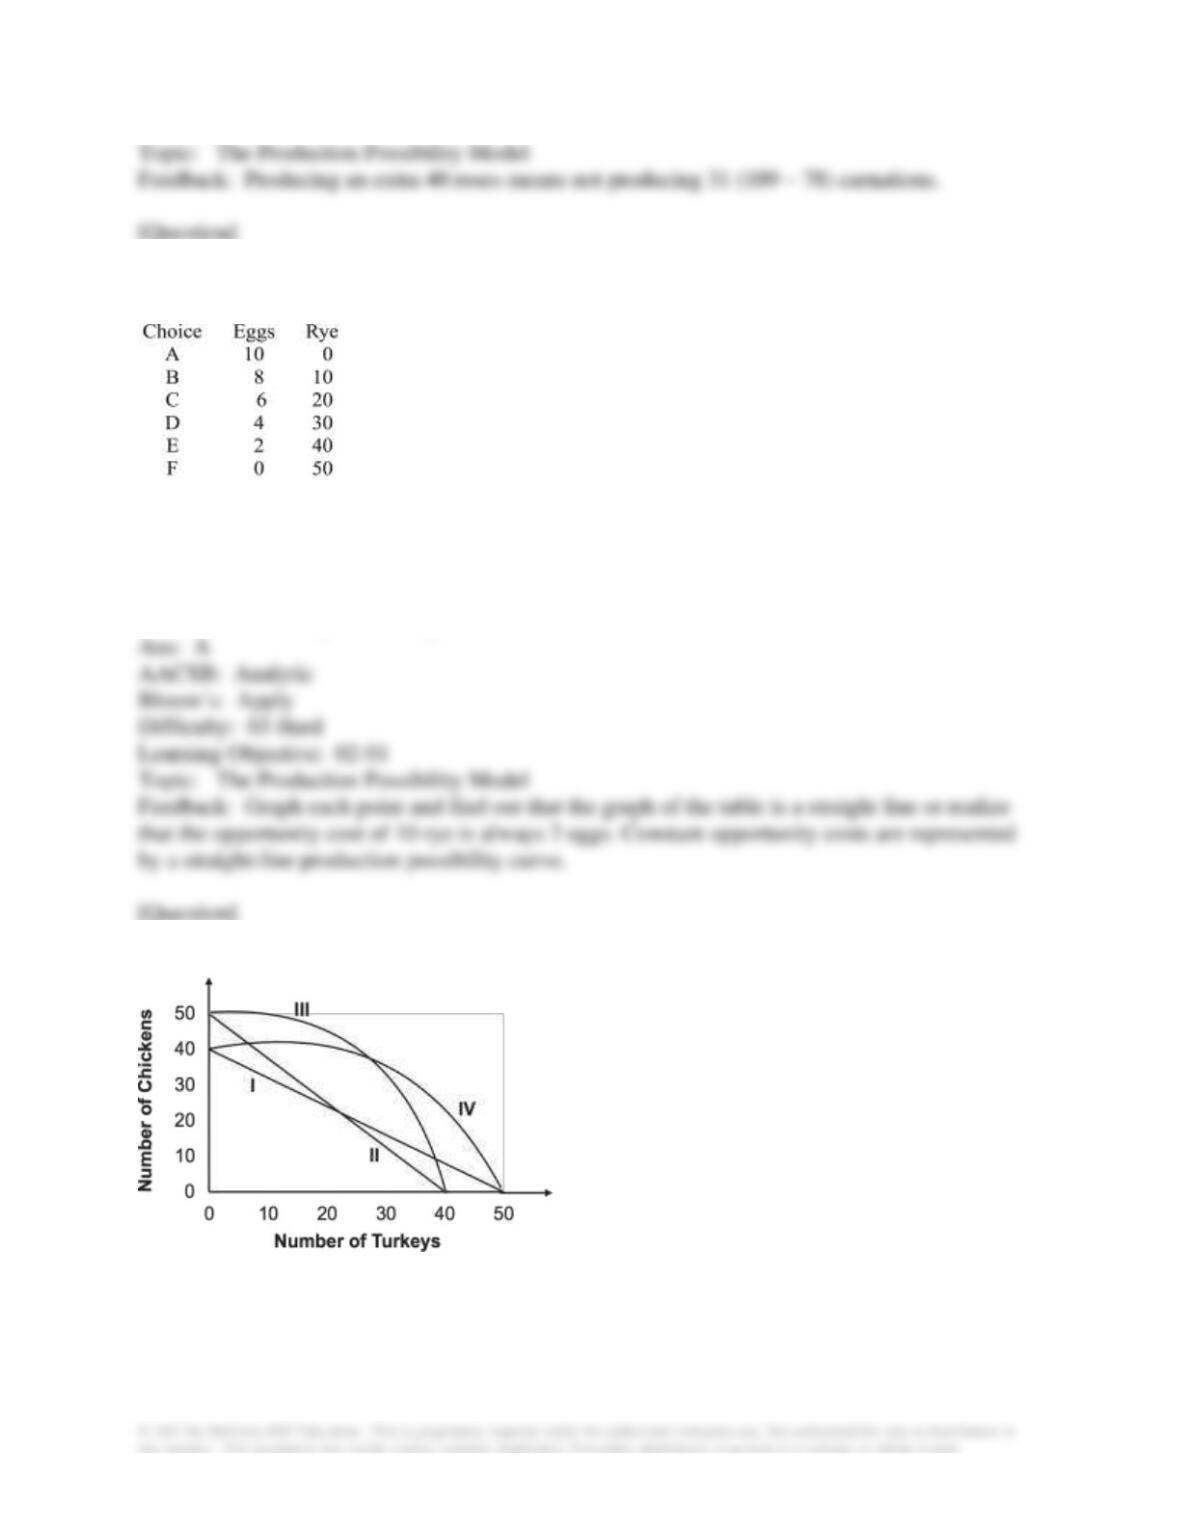
16. Refer to the graph below.
Suppose that the opportunity cost of producing 10 chickens is always 8 turkeys. Given this, the
relevant production possibility curve must be:
A. I.
B. II.
C. III.
D. IV.
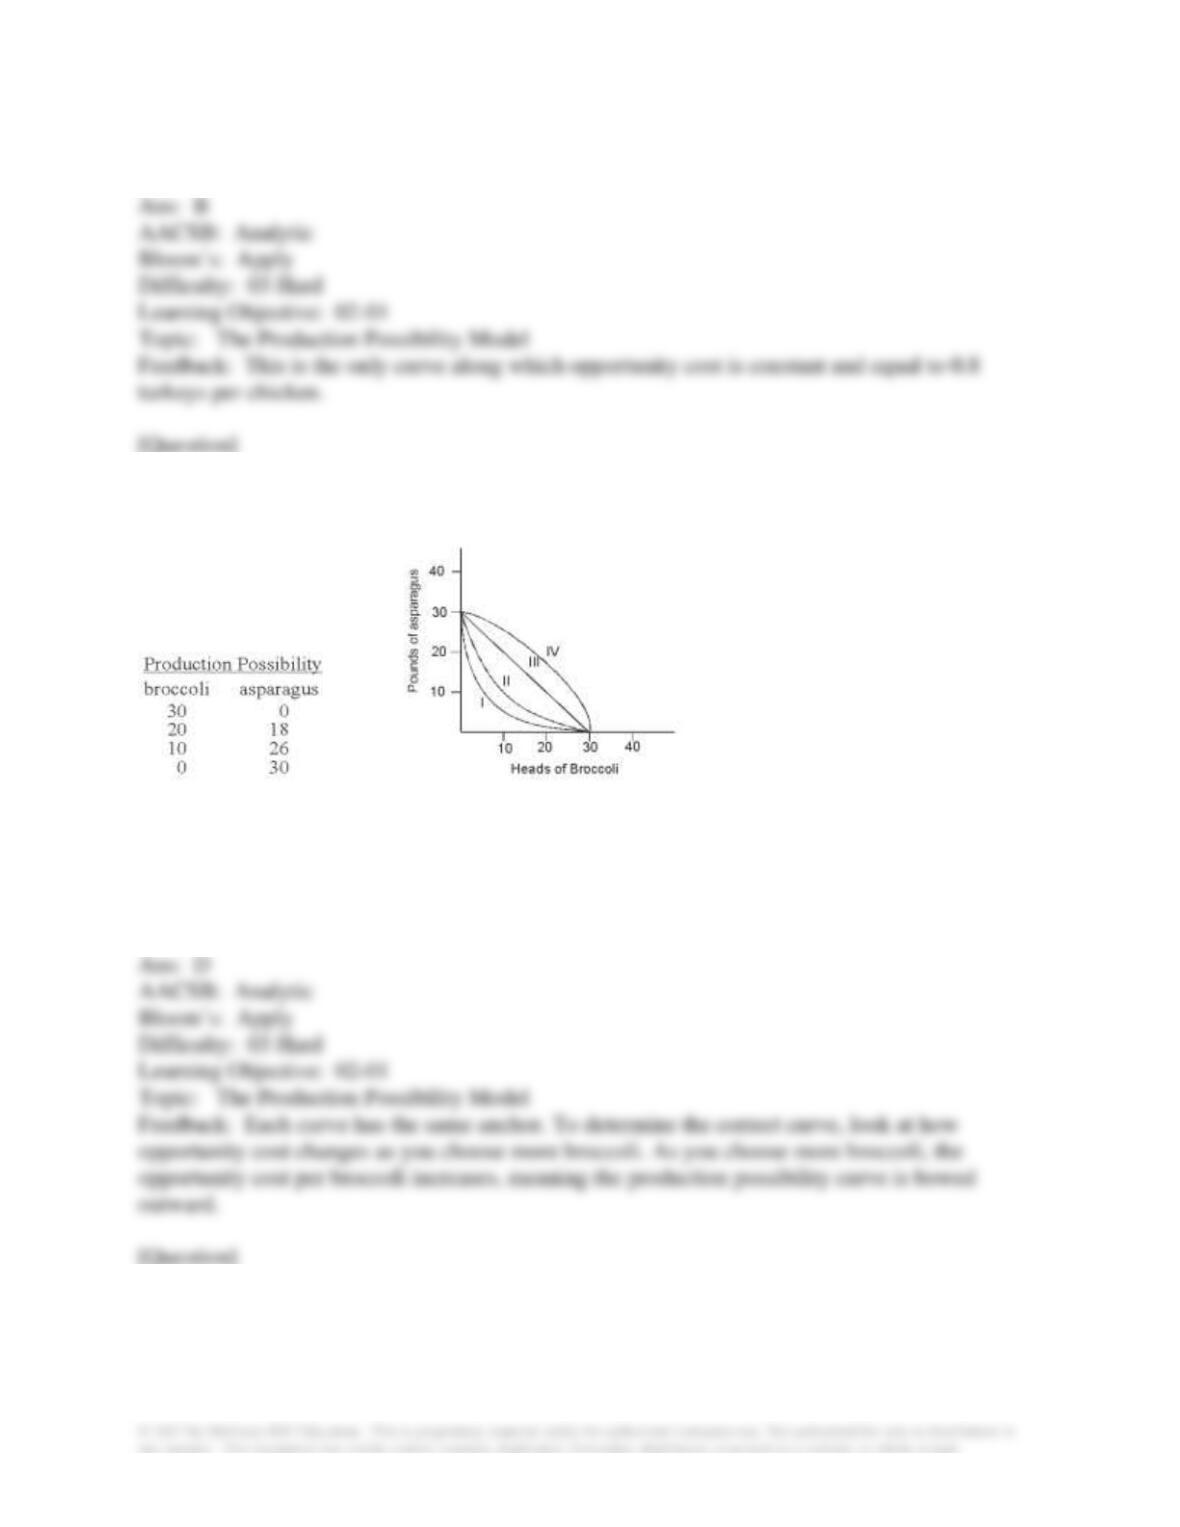
17. The production possibility table below on the left is for growing broccoli and asparagus in a
320-square-foot garden in one season.
Which curve on the graph on the right corresponds to this table?
A. I
B. II
C. III
D. IV
18. Because you can get more of one good only by giving up some of another good, the shape of
a production possibility curve is:
A. upward-sloping.
B. perfectly vertical.
C. perfectly horizontal.
D. downward-sloping.
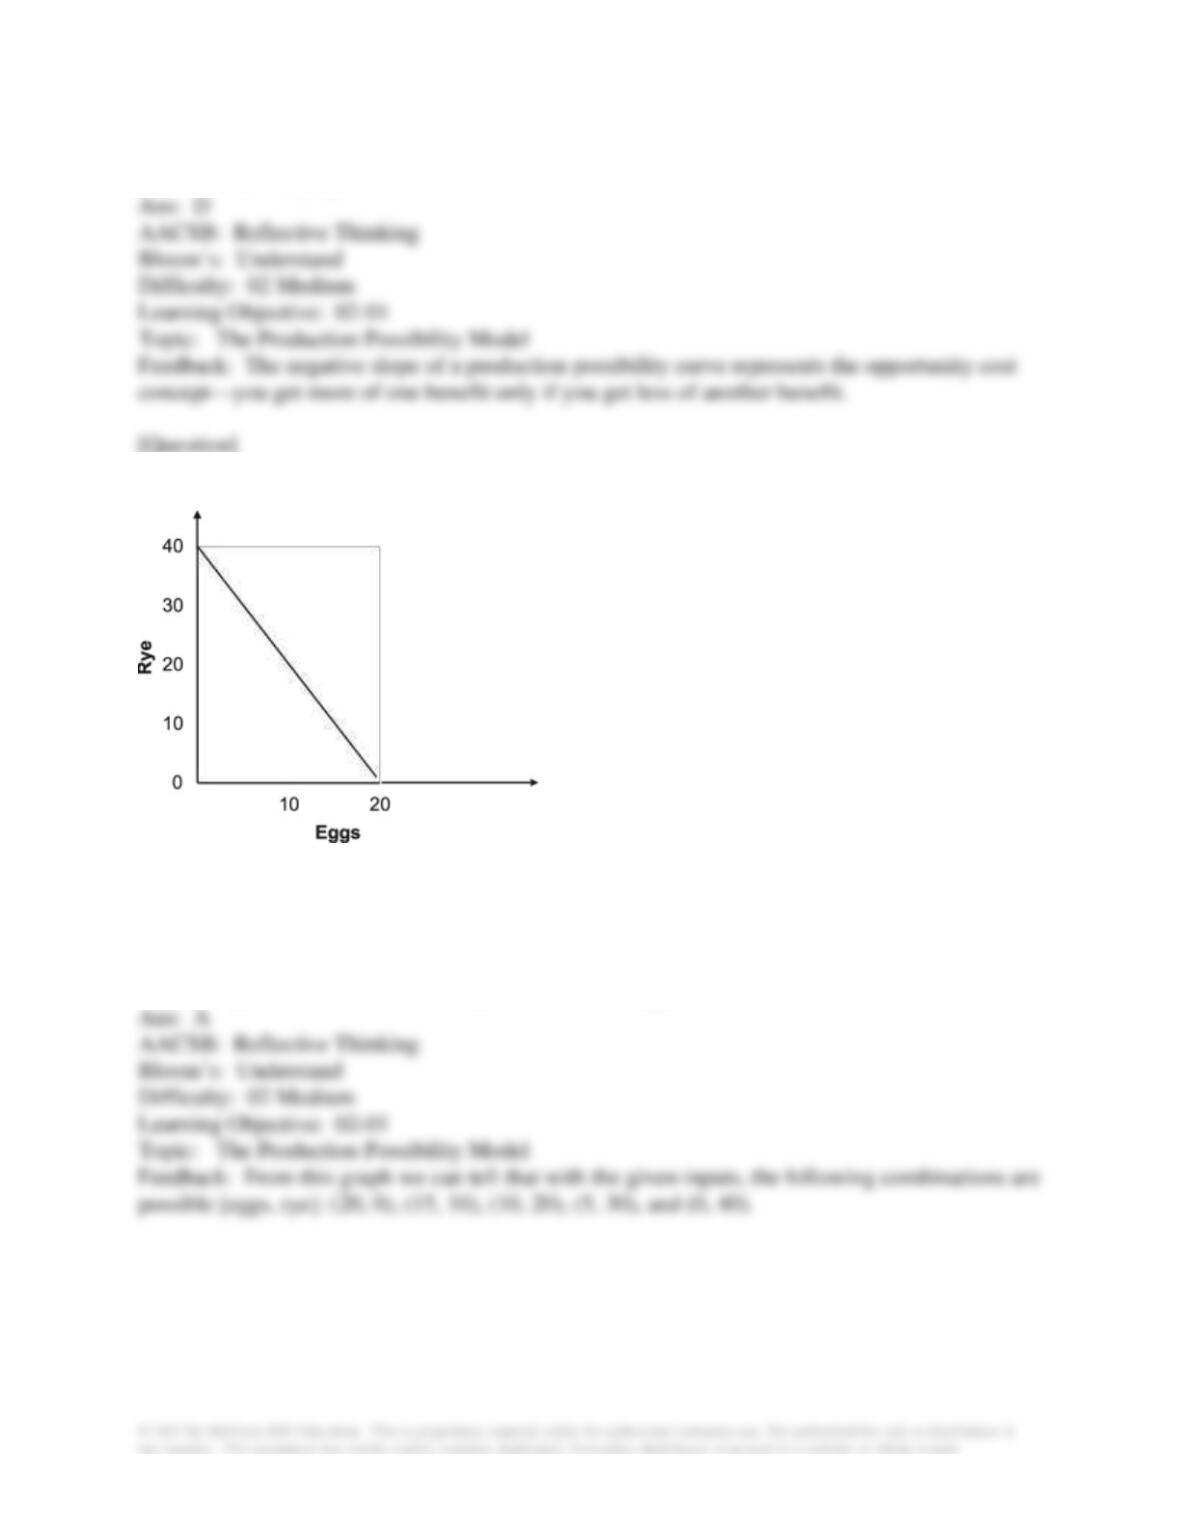
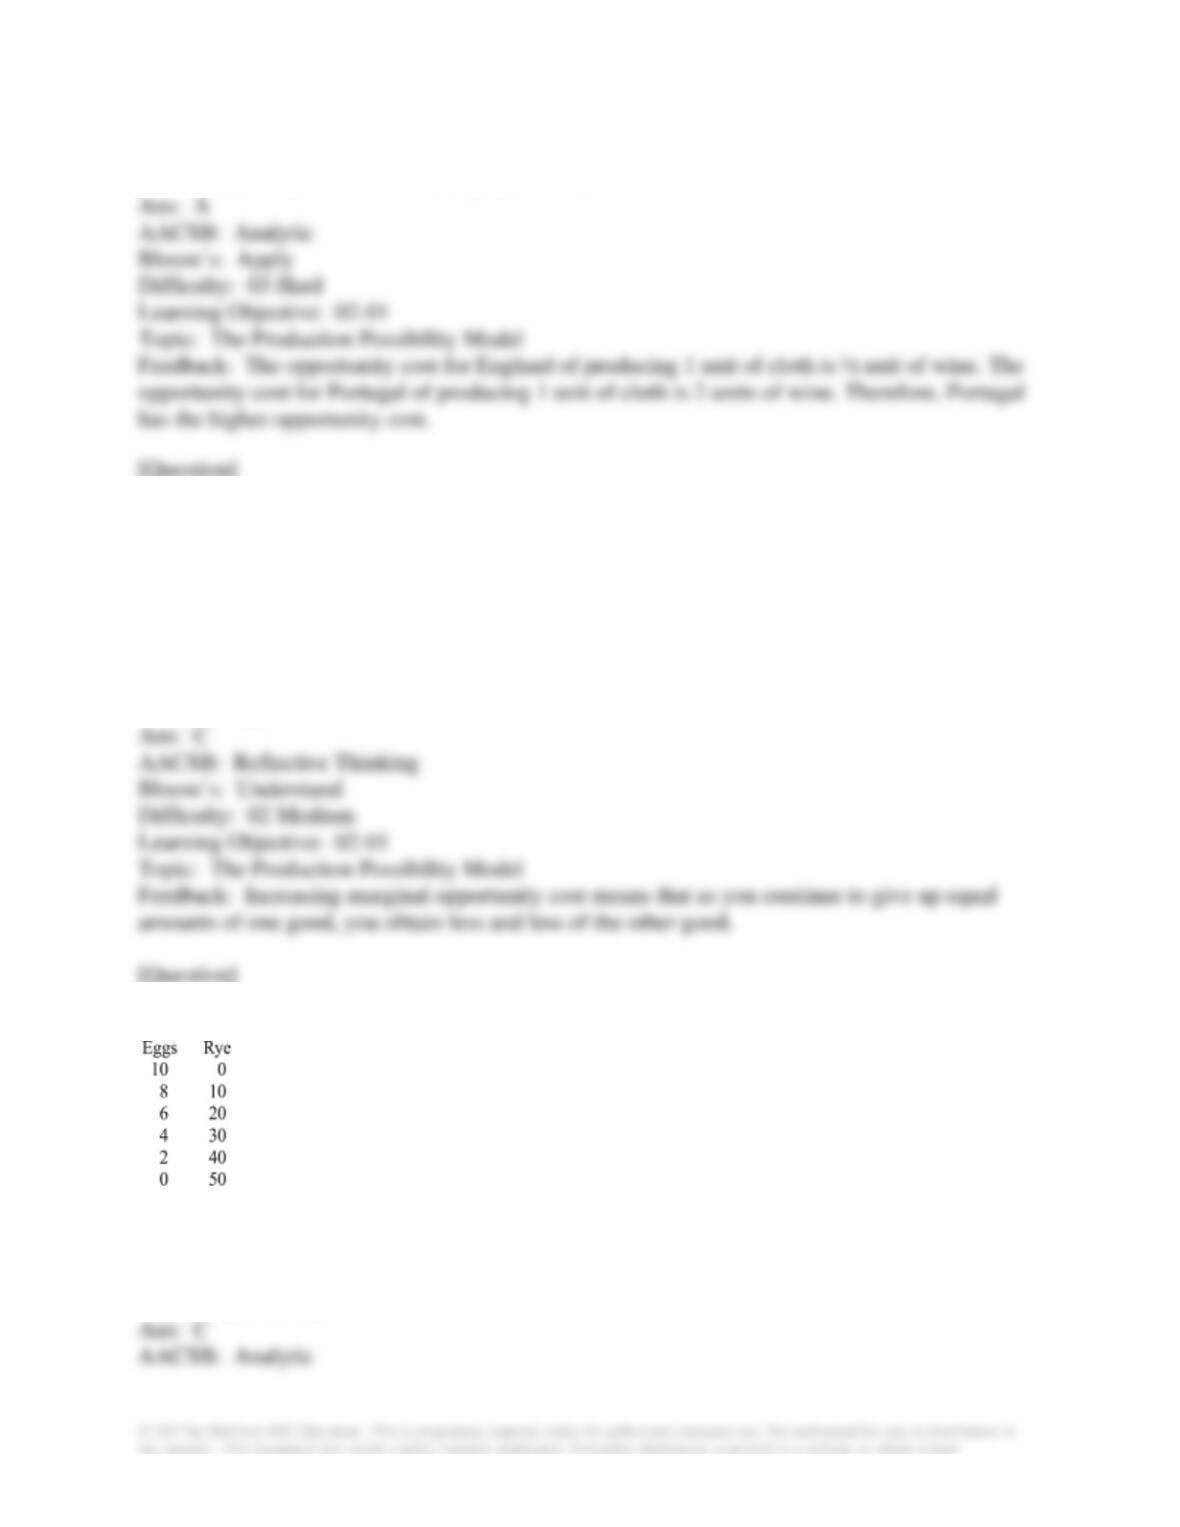
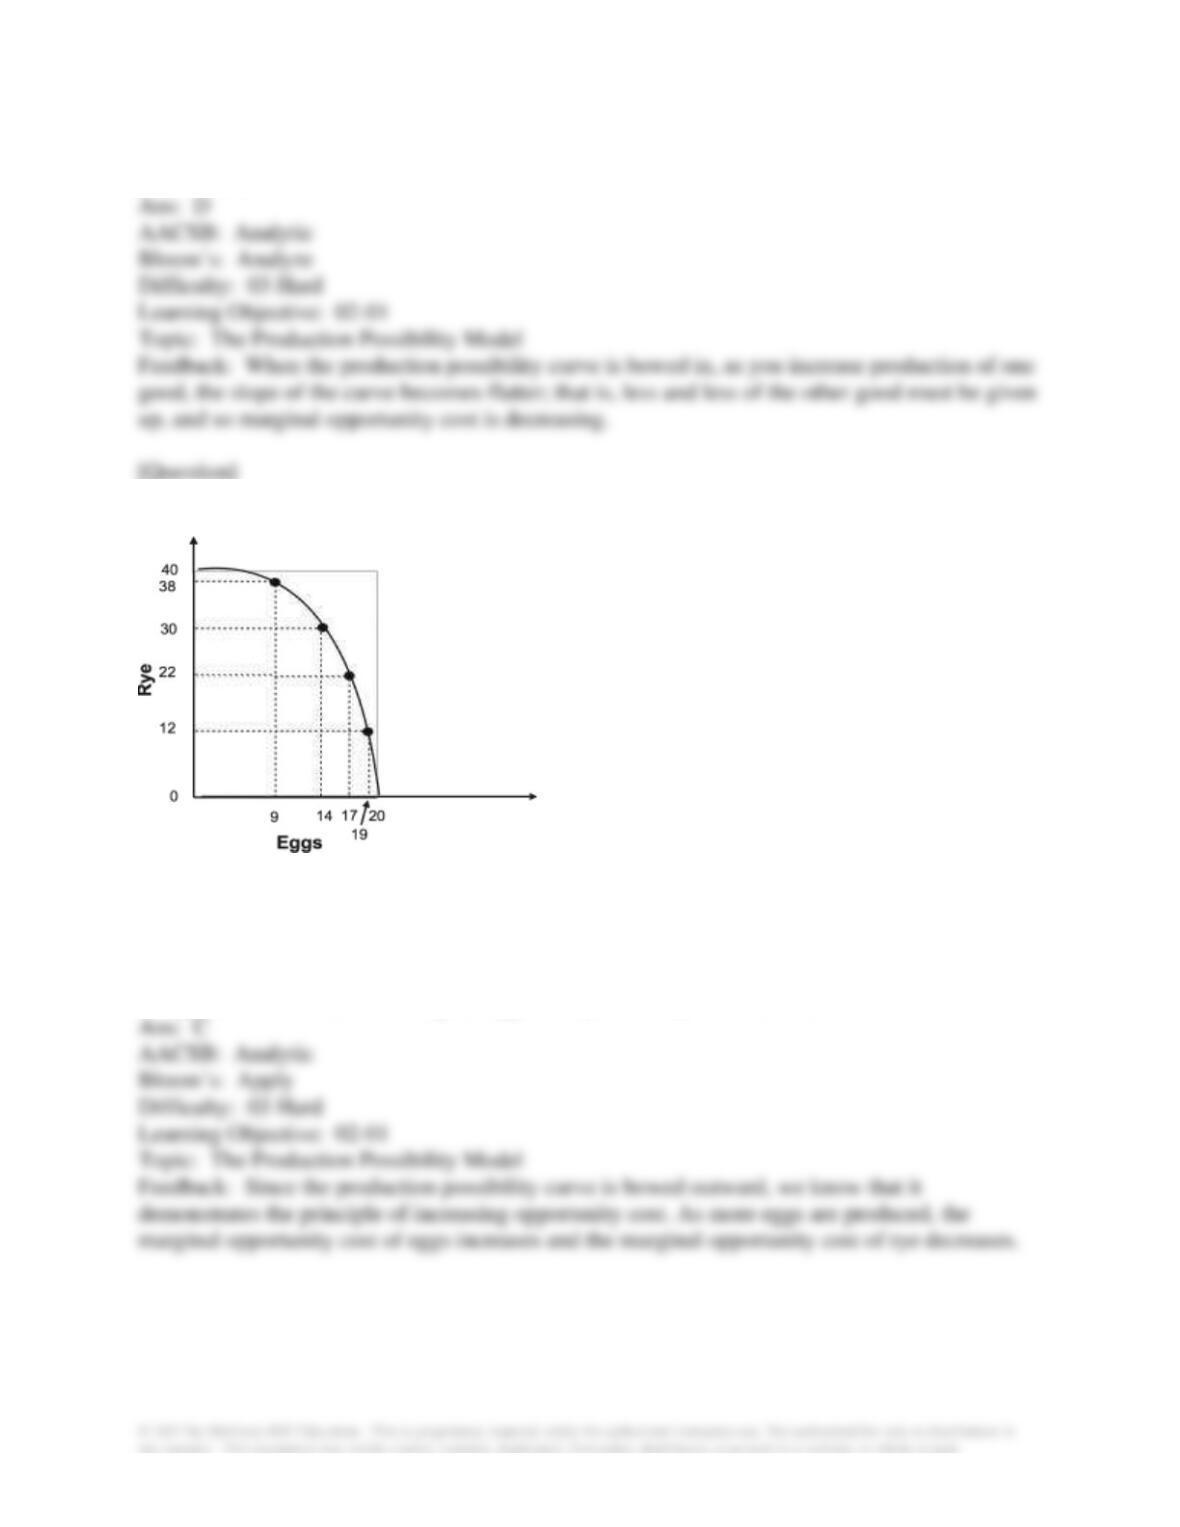
19. Refer to the production possibility curve for Ricardia below.
The graph indicates that with the resources and technology it has available, Ricardia:
A. can produce either 40 units of rye or 20 units of eggs.
B. can produce both 40 units of rye and 20 units of eggs.
C. cannot produce both 20 units of rye and 10 units of eggs.
D. cannot produce both 20 units of rye and 5 units of eggs.
20. Refer to the graph below.
Laura’s production possibility curve for math and economics problems in one night is shown in
the graph. Her opportunity cost of finishing six math problems instead of four math problems is:
A. one economics problem.
B. two economics problems.
C. three economics problems.
D. four economics problems.
21. Given the production possibility curve shown, the opportunity cost of listening to each
additional CD when moving from point B to point A is on average:
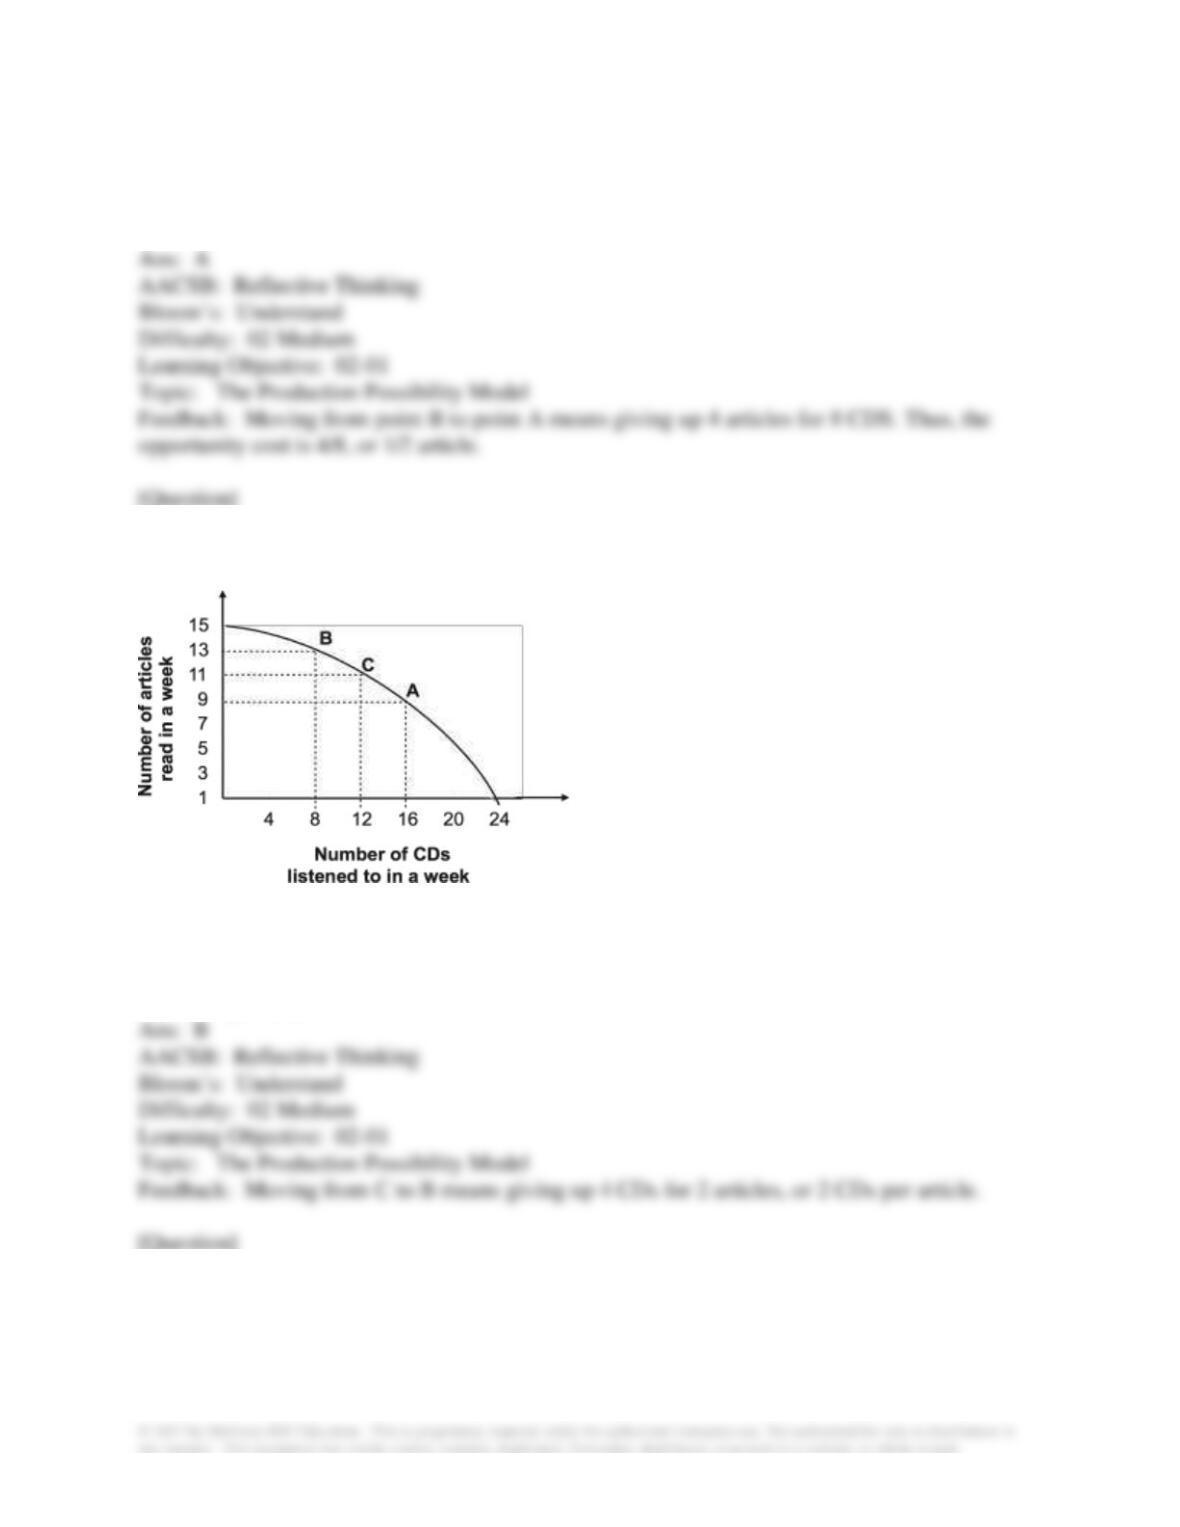
A. ½ article.
B. 1 article.
C. 2 articles.
D. 3 articles.
22. Refer to the graph shown. Given the production possibility curve, the opportunity cost of
reading 2 more articles when you are already reading 11 articles is on average:
A. ½ CD per article.
B. 2 CDs per article.
C. 2/3 CD per article.
D. 3 CDs per article.
23. If a production possibility curve representing a trade-off between a grade in English and a
grade in math has a negative slope, we know that:
A. there is a direct relationship between grades in English and grades in math.
B. there is no relationship between grades in English and grades in math.
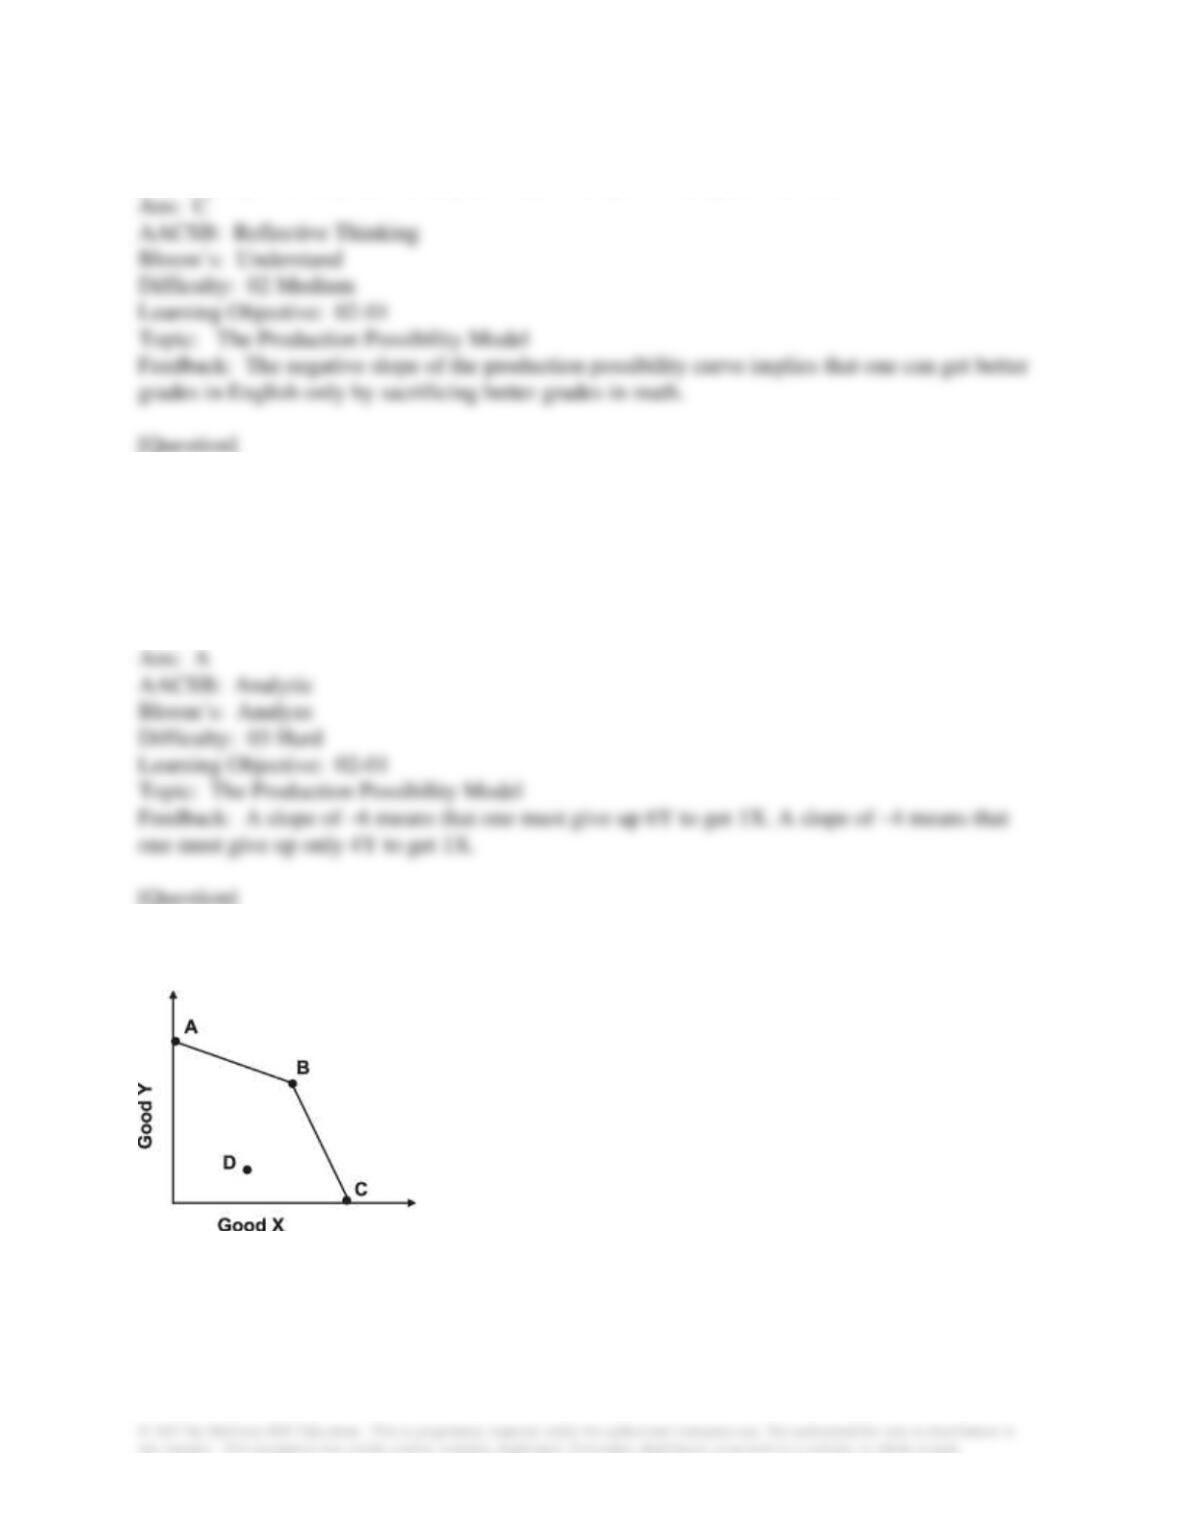
C. there is an inverse relationship between grades in English and grades in math.
D. one can get better grades in English only if one gets better grades in math.
24. Given a production possibility curve for good X (on the x-axis) and good Y (on the y-axis),
the opportunity cost of increasing good X is greatest when the slope of the production possibility
curve is:
A. –6.
B. –4.
C. 6.
D. 4.
25. Refer to the graph shown. In the graph, the opportunity cost of good X in terms of good Y
is:
A. higher along segment AB than along segment BC.
B. lower along segment AB than along segment BC.
C. the same everywhere on the two segments.
D. always increasing as we move from A to C.
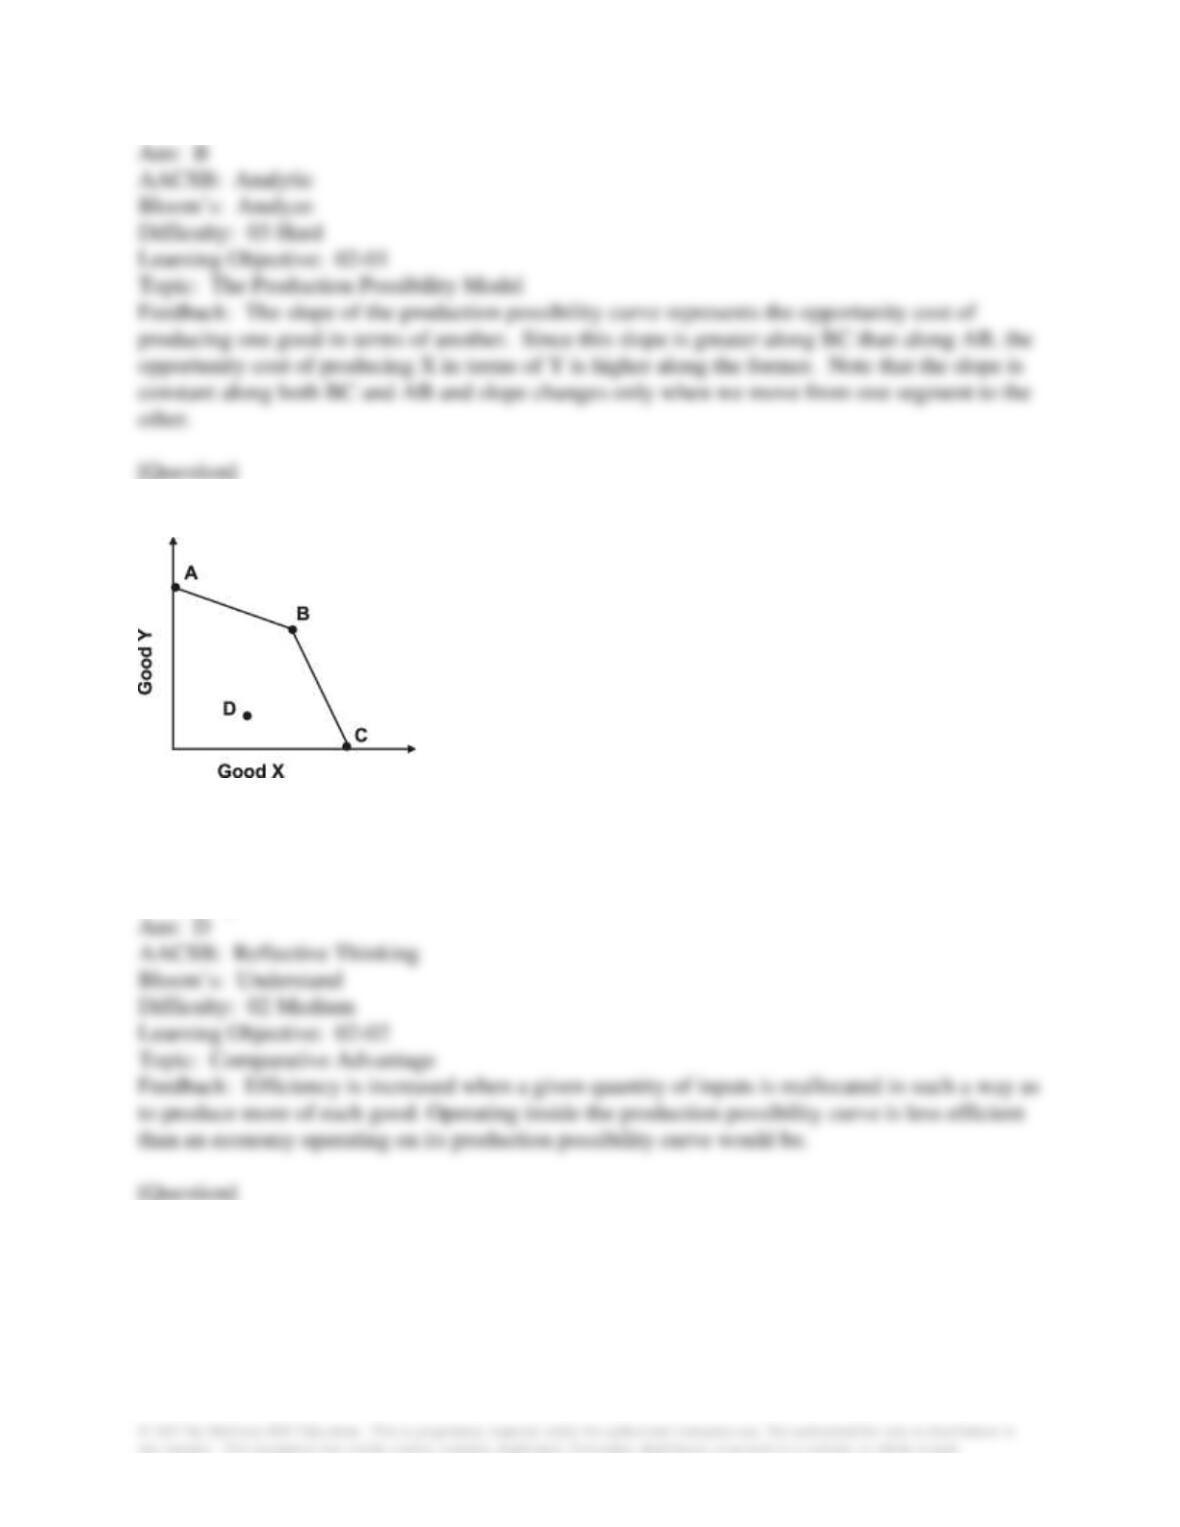
26. In the graph shown, what change would increase production efficiency?
A. moving from A to D
B. moving from A to B
C. moving from C to D
D. moving from D to B
27. England has a relatively cool and cloudy climate that is ill suited for grape growing. It can
produce 200 units of wine for every 400 units of cloth. Portugal, in contrast, has a relatively
warm and sunny climate that is good for growing grapes. It can produce 200 units of wine for
every 100 units of cloth. Which country has the higher opportunity cost of producing cloth?
A. Portugal: 2 units of wine for every unit of cloth
B. England: 2 units of wine for every unit of cloth
C. Portugal: ½ unit of wine for every unit of cloth
D. England: ½ unit of cloth for every unit of wine
28. Increasing marginal opportunity cost means that the production possibility curve is:
A. bowed in so that for every additional unit of one good given up, you get fewer and fewer units
of the other good.
B. bowed in so that for every additional unit of one good given up, you get more and more units
of the other good.
C. bowed out so that for every additional unit of a good given up, you get fewer and fewer units
of the other good.
D. bowed out so that for every additional unit of one good given up, you get more and more units
of the other good.
29. This production possibility table illustrates:
A. increasing marginal opportunity cost.
B. decreasing marginal opportunity cost.
C. constant marginal opportunity cost.
D. zero opportunity cost.
30. The principle of increasing marginal opportunity costs states that the initial opportunity costs
are:
A. high but decrease the more you concentrate on the activity.
B. low but increase the more you concentrate on the activity.
C. high but increase the more you concentrate on the activity.
D. low but decrease the more you concentrate on the activity.
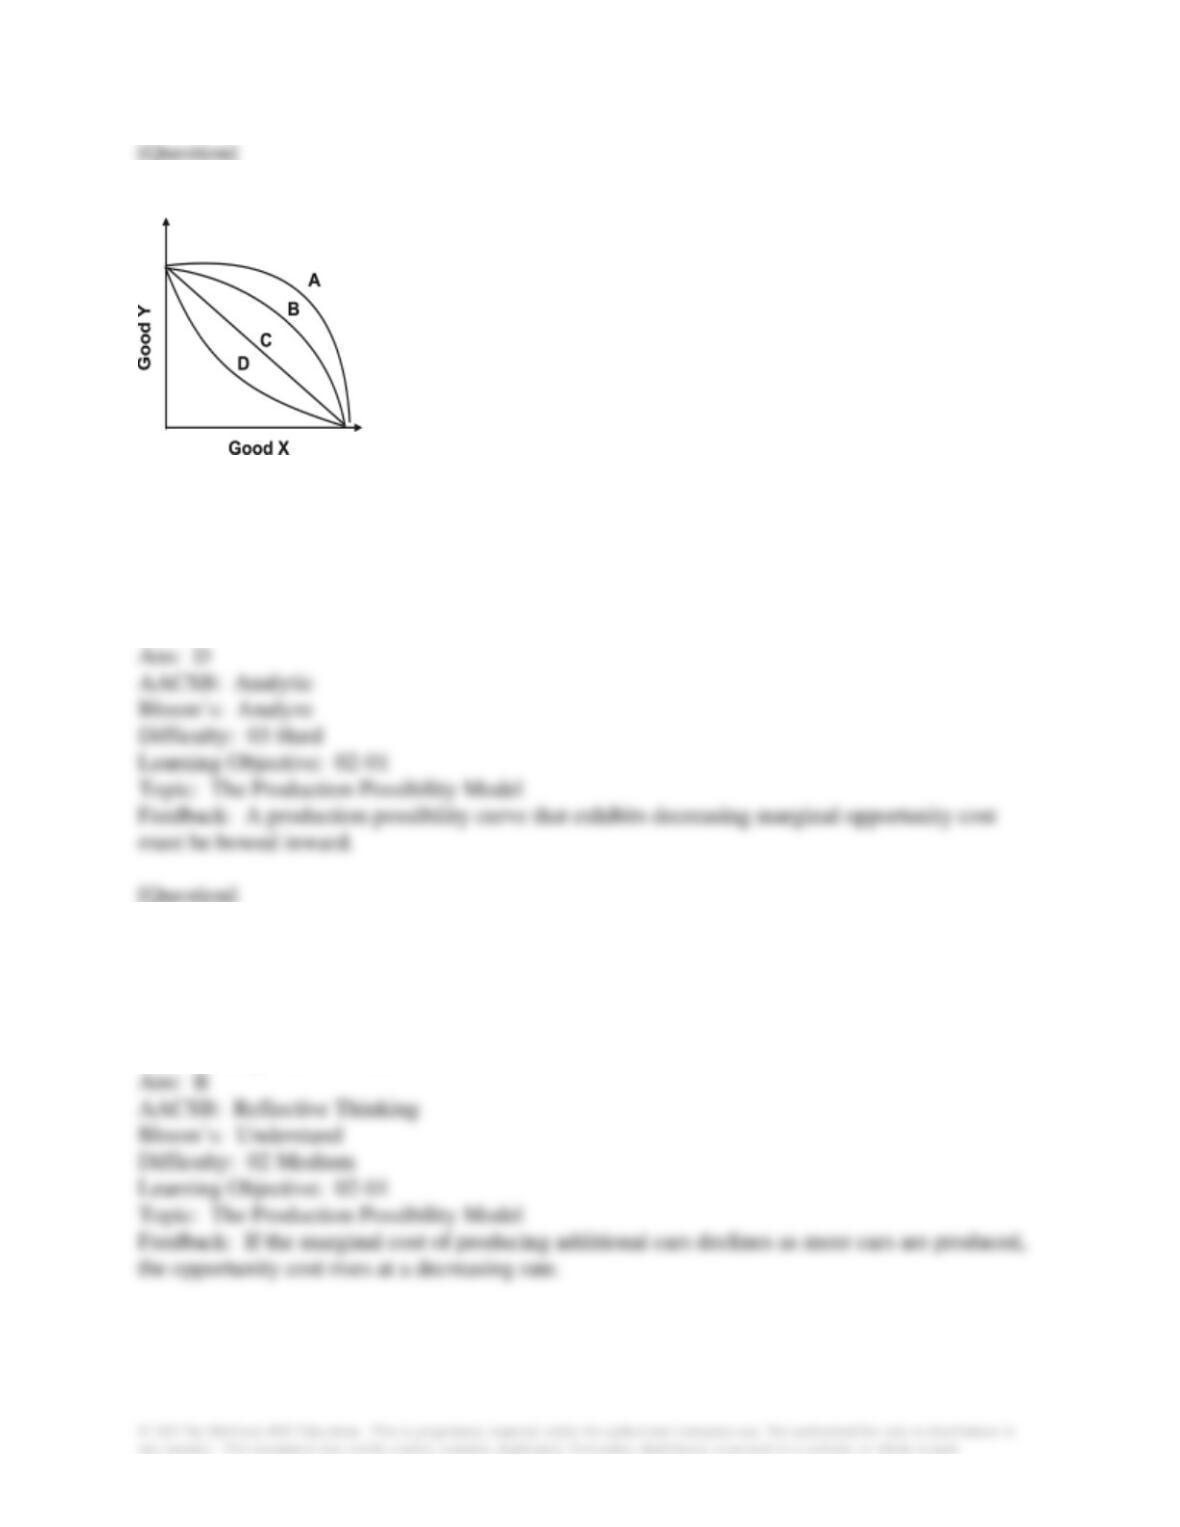
31. To graphically demonstrate the principle of increasing marginal opportunity cost, the
production possibility curve must be:
A. flat.
B. straight.
C. bowed out.
D. bowed in.
32. If there were decreasing marginal opportunity costs, the production possibility curve would
be:
A. flat.
B. straight.
C. bowed out.
D. bowed in.
33. Refer to the graph below.
The graph indicates that as more eggs are produced, the marginal opportunity cost of:
A. both eggs and rye increases.
B. eggs increases while the marginal opportunity cost of rye remains constant.
C. eggs increases while the marginal opportunity cost of rye decreases.
D. eggs decreases while the marginal opportunity cost of rye remains constant.
34. Refer to the graph below.
With which curve does the opportunity cost of an additional unit of good Y decrease as more
units of good Y are produced?
A. A
B. B
C. C
D. D
35. When you produce cars, it is enormously expensive to produce one car, but then the costs
per car decrease as more are produced. This would be an example of:
A. increasing marginal opportunity costs.
B. decreasing marginal opportunity costs.
C. constant marginal opportunity costs.
D. increasing returns to scale.
36. The principle of increasing marginal opportunity cost does not hold in which of the
following cases?
A. All inputs are equally adaptable to the production of all goods.
B. Some inputs are more adaptable to the production of certain goods.
C. Some inputs are less adaptable to the production of certain goods.
D. Each input is adaptable to the production of a limited number of goods.
37. The principle of increasing marginal opportunity cost holds in which of the following cases?
A. All inputs are equally adaptable to the production of all goods.
B. The production possibility curve is a downward-sloping straight line.
C. Some inputs are better for producing particular goods.
D. Each input can be used to produce only one good.
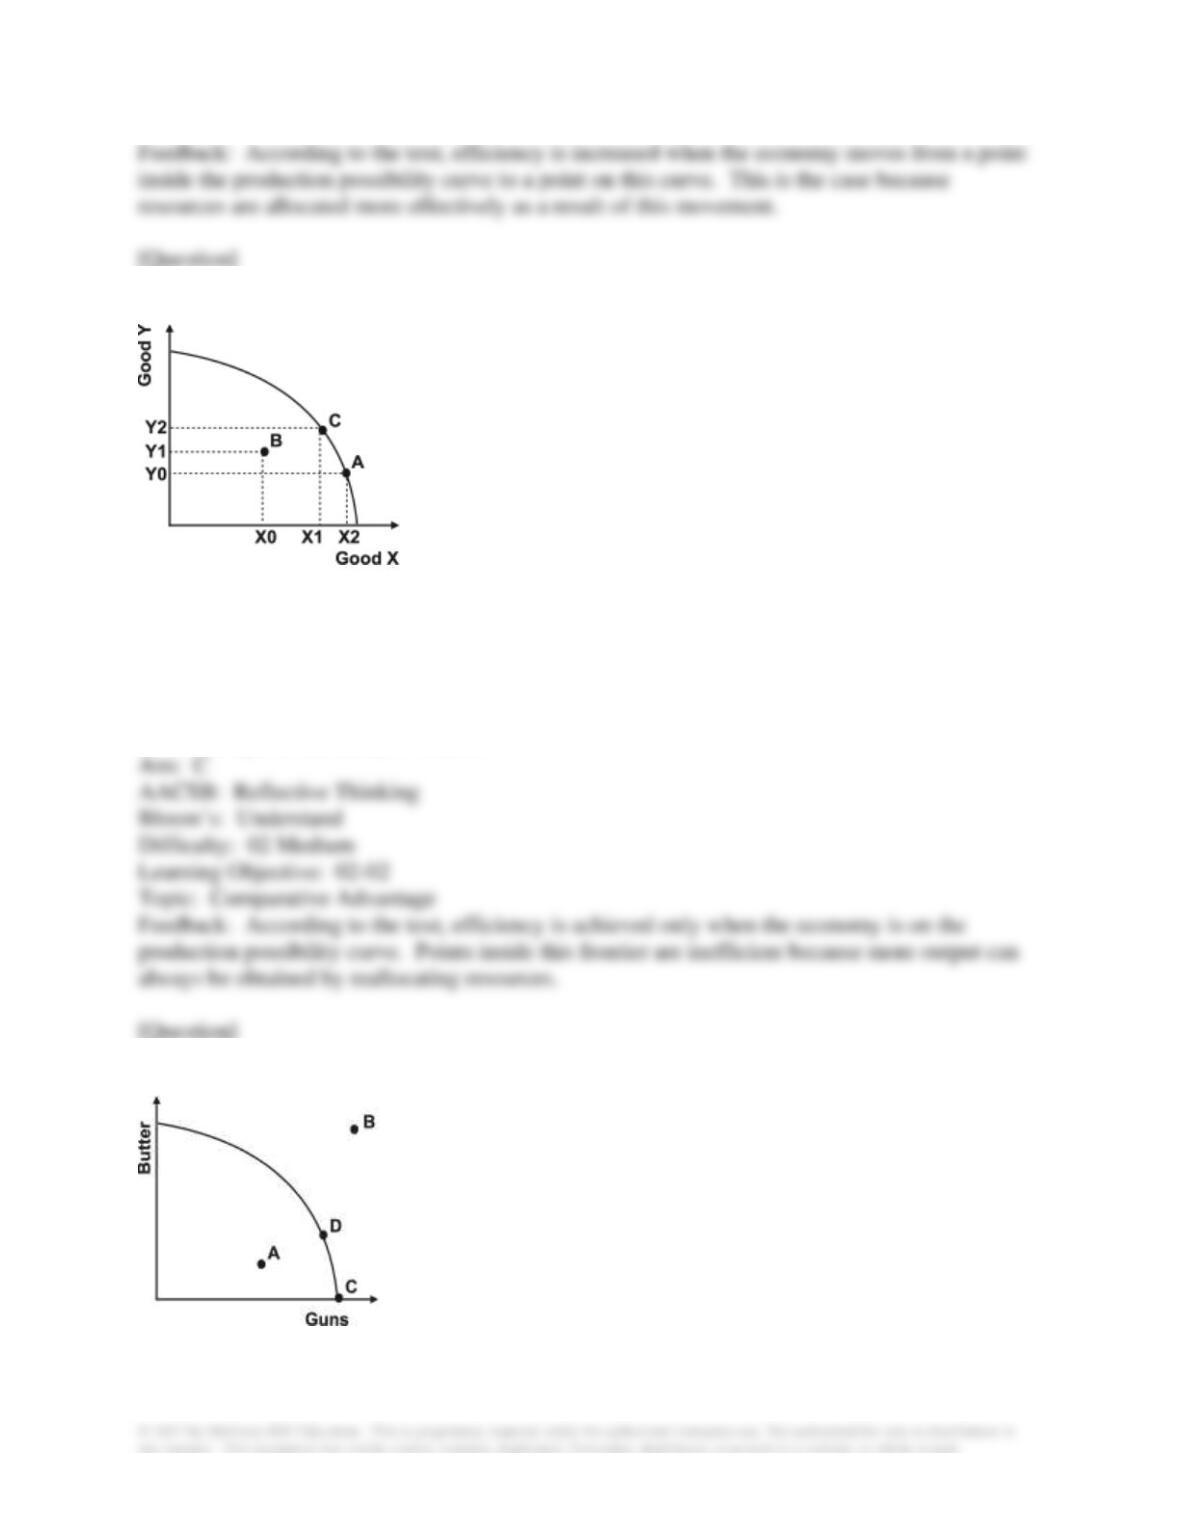
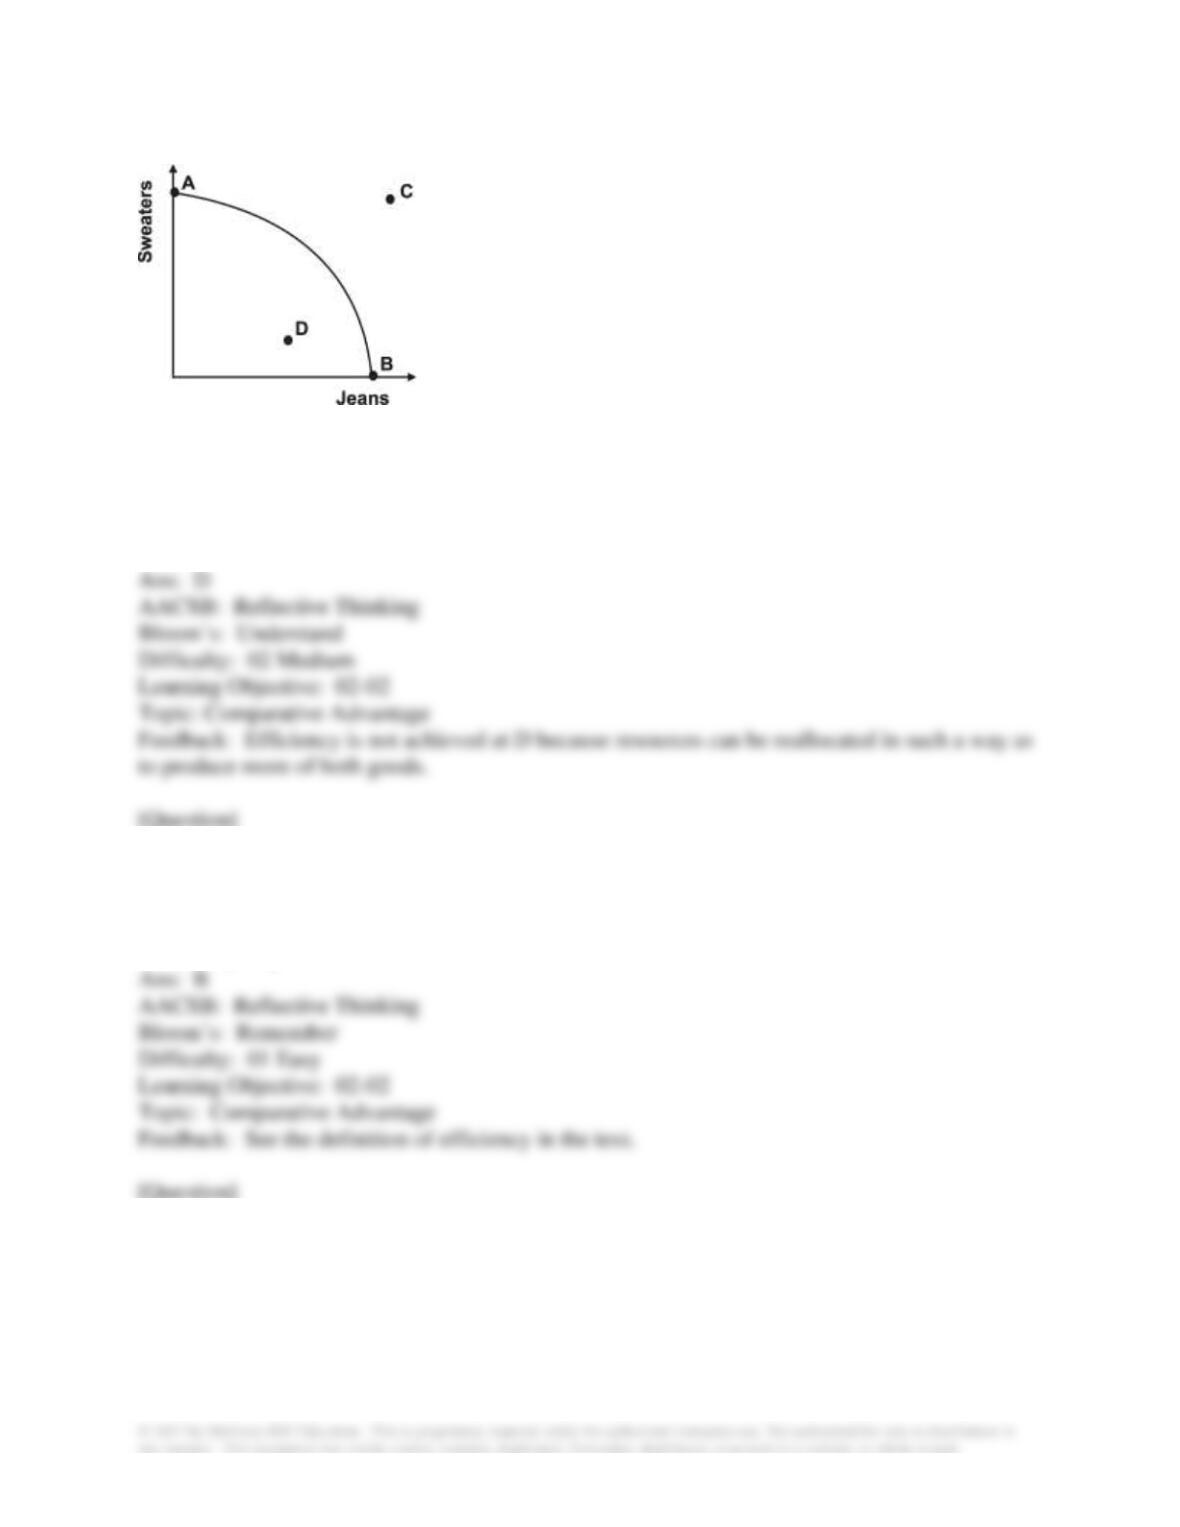
38. If you move from a point inside the production possibility curve to a point on the production
possibility curve, it follows that efficiency is:
A. increased because the economy is now on the production possibility curve.
B. increased only if production of both goods increases.
C. increased as long as the combined output of both goods increases.
D. reduced if less of one good is produced.
39. Refer to the graph below.
As you move from point A to point B:
A. production efficiency is increased because we have more of good X.
B. production efficiency is decreased because we have less of good Y.
C. production efficiency is decreased because we are no longer on the production possibility
curve.
D. the change in efficiency is unclear.
40. Refer to the graph below.
Given the production possibility curve, which point is unattainable?
A. A
B. B
C. C
D. D
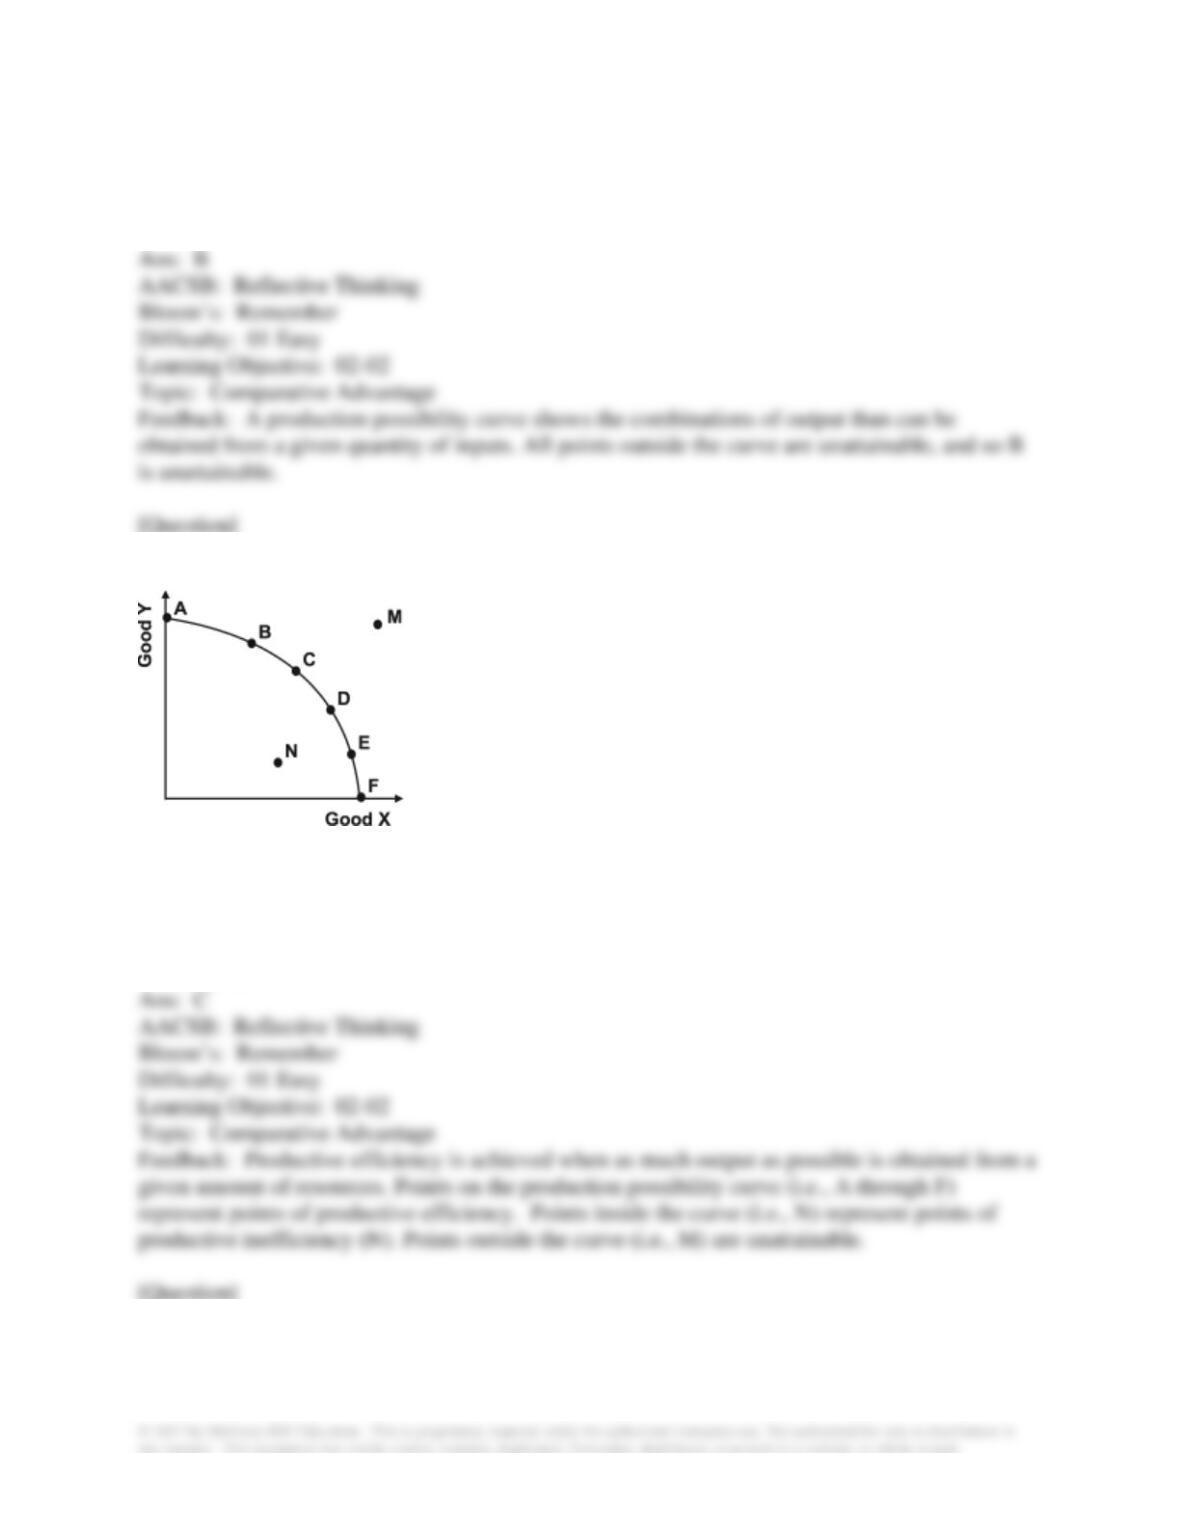
41. Refer to the graph below.
Productive efficiency is achieved at what points?
A. A, B, and M
B. C, D, and N
C. A, C, and F
D. M, D, and E
42. Refer to the graph below.
Productive inefficiency occurs at what point?
A. A
B. B
C. C
D. D
43. The term efficiency involves achieving a goal as:
A. quickly as possible.
B. cheaply as possible.
C. well as possible.
D. steadily as possible.
44. In election campaigns, presidents often promise more of everything (that is, more guns and
more butter). What would help those elected president fulfill that promise?
A. The economy becomes more efficient.
B. The United States limits imports into the country.
C. Illegal immigration into the United States is severely limited.
D. A minimum wage bill is passed.