1
Microeconomics: Theory and Applications with Calculus, 3e (Perloff)
Chapter 2 Supply and Demand
2.1 Demand
1) Suppose the demand for Digital Video Recorders (DVRs) is given by Q = 250 – .25p + 4pc, where Q is the
quantity of DVRs demanded (in 1000s), p is the price of a DVR, and pc is the price of cable television.
How much does the quantity demanded for DVRs change if the p rises by $40?
A) drops by 10,000 DVRs
B) increases by 16,000 DVRs
C) drops by 2,500 DVRs
D) increases by 4,000 DVRs
2) Suppose the demand for Digital Video Recorders (DVRs) is given by Q = 250 – .25p + 4pc, where Q is the
quantity of DVRs demanded (in 1000s), p is the price of a DVR, and pc is the price of cable television.
How much does Q change if the price of cable changes slightly (i.e. the partial derivative of demand with
respect to pc)?
A) 125
B) 4.25
C) 4
D) .25
3) Suppose the demand for Digital Video Recorders (DVRs) is given by Q = 250 – .25p + 4pc, where Q is the
quantity of DVRs demanded (in 1000s), p is the price of a DVR, and pc is the price of cable television.
How much of a change in p must occur for Q to increase by one?
A) fall by 25¢
B) fall by $4
C) increase by 25¢
D) fall by $4.25

4) According to the Law of Demand, the demand curve for a good will
A) shift leftward when the price of the good increases.
B) shift rightward when the price of the good increases.
C) slope downward.
D) slope upward.
5) An increase in the price of pork will lead to
A) a movement up along the demand curve.
B) a movement down along the demand curve.
C) a rightward shift of the demand curve.
D) a leftward shift of the demand curve.
6) An increase in consumer incomes will lead to
A) a rightward shift of the demand curve for plasma TVs.
B) a movement upward along the demand curve for plasma TVs.
C) a rightward shift of the supply curve for plasma TVs.
D) no change of the demand curve for plasma TVs.
7) Consider the demand function Qd = 150 – 2P. The effects of other determinants of Qd is reflected in
A) the intercept of the function.
B) the slope of the function.
C) neither the slope nor the intercept of the function.
D) in both the slope and the intercept of the function.
8) Consider the demand functions:
A) Qd = 250 – 2P
B) Qd = 300 – 3P
Which of the demand functions reflects a higher level of consumer incomes?
A) A
B) B
C) A and B reflect the same consumer incomes.
D) More information is needed.
9) Holding all other factors constant, consumers demand more of a good the
A) higher its price.
B) lower its price.
C) steeper the downward slope of the demand curve.
D) steeper the upward slope of the demand curve.
10) The demand curve for Widgets is given by QD = 6000 – 2y – 200p + 30pG, where QD is the quantity of
widgets demanded, y is the per capital income and pG is the price of Gizmos. An increase in per capital
income will cause
A) demand shifts left.
B) demand shifts right.
C) demand increases.
D) movement along the demand curve.
11) As the price of a good increases, the change in the quantity demanded can be shown by
A) shifting the demand curve leftward.
B) shifting the demand curve rightward.
C) moving down along the same demand curve.
D) moving up along the same demand curve.
12) If the price of automobiles were to increase substantially, the demand curve for gasoline would most
likely
A) shift leftward.
B) shift rightward.
C) become flatter.
D) become steeper.
13) If the price of automobiles were to decrease substantially, the demand curve for automobiles would
most likely
A) shift rightward.
B) shift leftward.
C) remain unchanged.
D) become steeper.

14) If the price of automobiles were to decrease substantially, the demand curve for public transportation
would most likely
A) shift rightward.
B) shift leftward.
C) remain unchanged.
D) remain unchanged while quantity demanded would change.
15) An increase in the demand curve for orange juice would be illustrated as a
A) leftward shift of the demand curve.
B) rightward shift of the demand curve.
C) movement up along the demand curve.
D) movement down along the demand curve.
16) The term “inverse demand curve” refers to
A) a demand curve that slopes upward.
B) expressing the demand curve in terms of price as a function of quantity.
C) the demand for “inverses.”
D) the difference between quantity demanded and supplied at each price.
17) If the demand for oranges is written as Q = 100 – 5p, then the inverse demand function is
A) Q = 5p – 100.
B) Q = 20 – .2p.
C) p = 20 – 5Q.
D) p = 20 – .2Q.
18) To determine the total demand for all consumers, sum the quantity each consumer demands
A) at a given price.
B) at all prices and then sum this amount across all consumers.
C) Both A and B will generate the same total demand.
D) None of the above
5
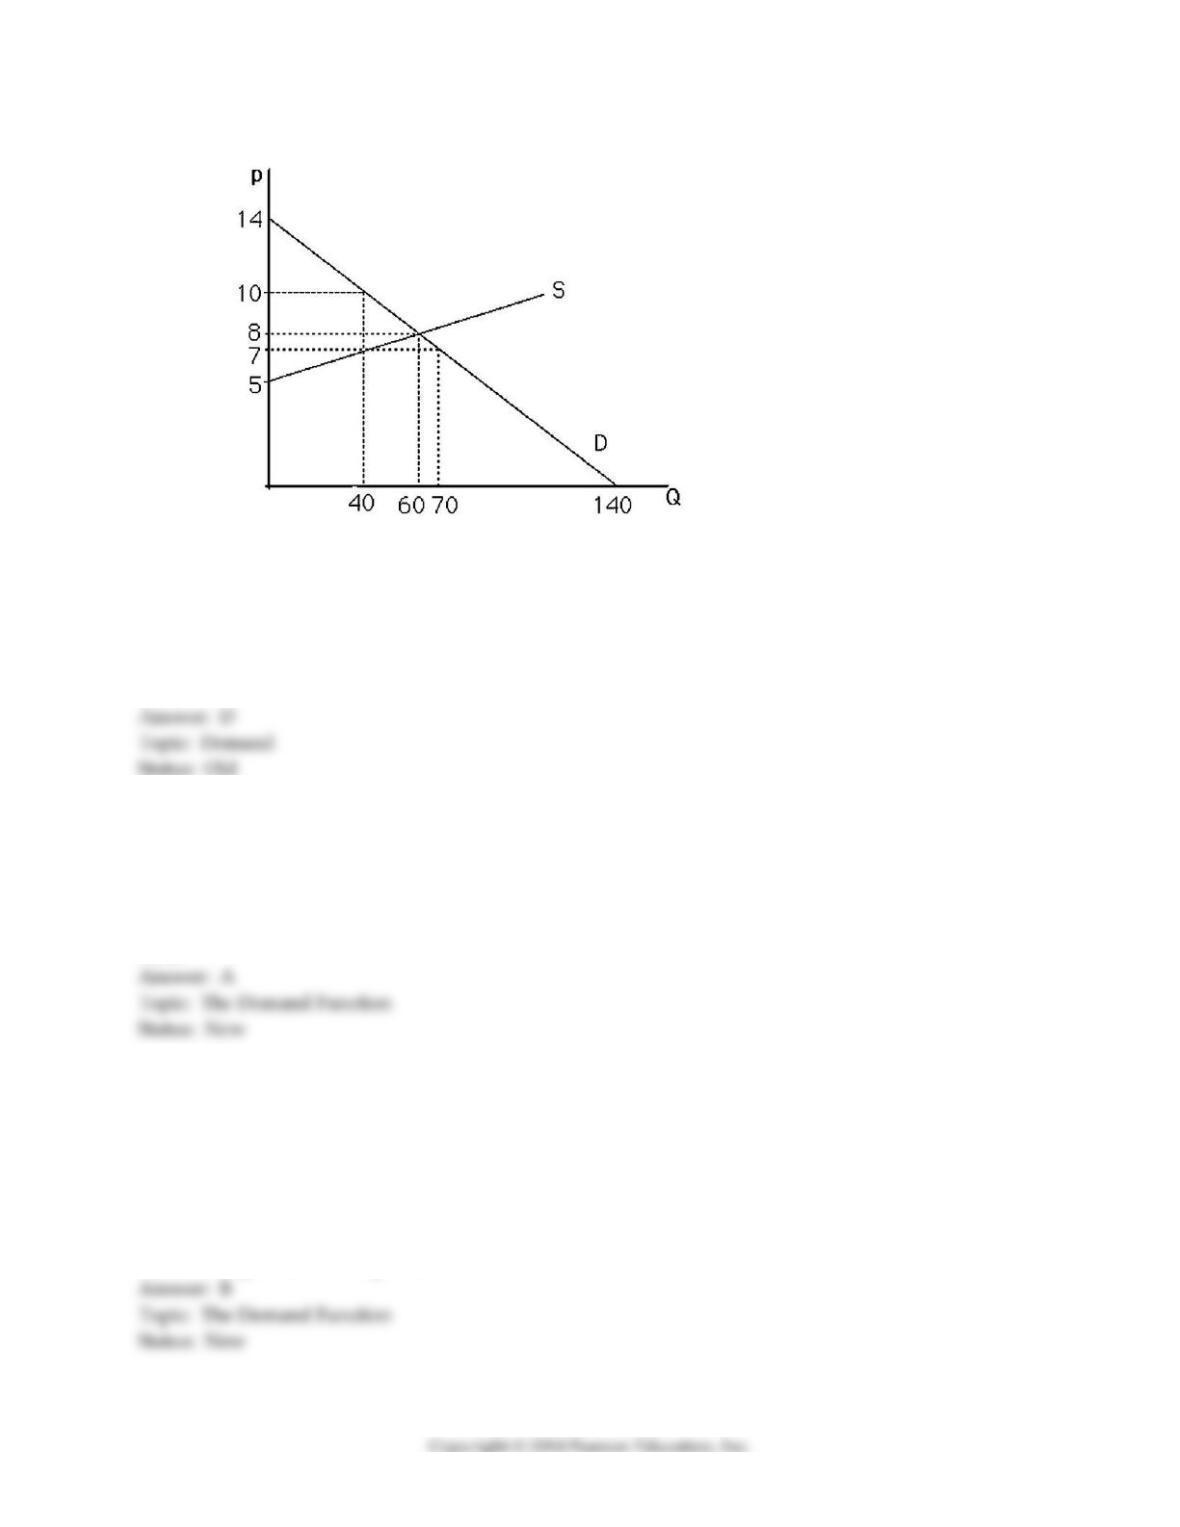
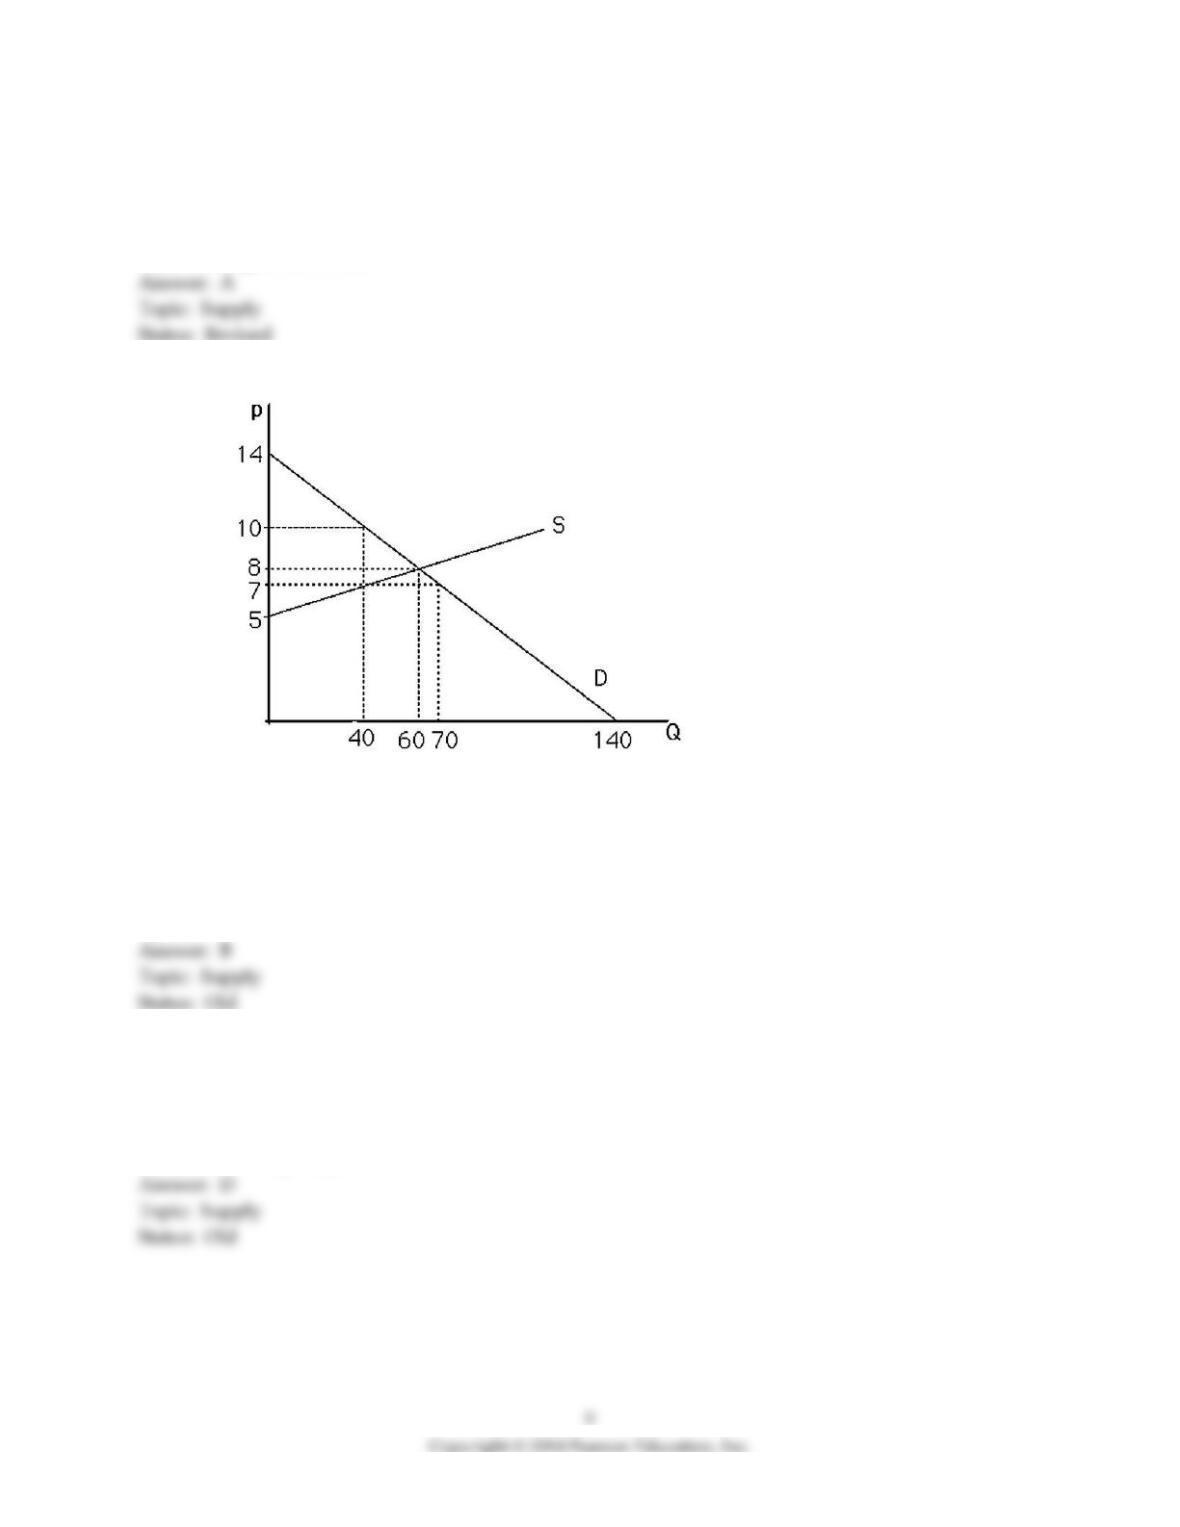
19) The above figure shows a graph of the market for pizzas in a large town. No pizzas will be demanded
unless price is less than
A) $0.
B) $5.
C) $12.
D) $14.
20) The above figure shows a graph of the market for pizzas in a large town. If the price price rises from 7
to 8, what is the change in quantity demanded for pizzas?
A) –10
B) –30
C) –20
D) 20
21) The demand for pizzas in a large town is written as: Qd = 120 – 10P + 5Pb – 0.5Ps – 10Y, where Qd is
the quantity demanded, P is the price, Pb is the price of burritos, Ps is the price of soft drinks sold in the
pizza restaurants, and Y is personal income per month (in thousand dollars). If there is a $1,000 increase
in personal income, how will the Qd change?
A) increase by 10
B) decrease by 10
C) unchanged
D) not enough information provided
22) The demand for pizzas in a large town is written as: Qd = 120 – 10P + 5Pb – 0.5Ps – 10Y, where Qd is
the quantity demanded, P is the price, Pb is the price of buritos, Ps is the price of soft drinks sold in the
pizza restaurants, and Y is personal income per month (in thousand dollars). We can conclude that
burritos and pizzas are
A) substitutes.
B) normal goods.
C) complements.
D) unrelated.
23) The demand for pizzas in a large town is written as: Qd = 120 – 10P + 5Pb – 0.5Ps – 10Y, where Qd is
the quantity demanded, P is the price, Pb is the price of burittos, Ps is the price of soft drinks sold in the
pizza restaurants, and Y is personal income per month (in thousand dollars). What is ∆Q/∆Ps?
A) 5
B) -5
C) 0.5
D) -0.5
24) Suppose the demand for widgets is given by QD = 100 – 5p – pd + 2I, where I is average consumer
income, p is the price of lemons, and pd is the price of doodads. According to this equation, doodads are
a(n) ________ for widgets.
A) substitute
B) complement
C) input
D) None of the above.
For the following, please answer “True” or “False” and explain why.
25) If a good is not produced, then there is no demand for it.
26) Because people prefer name-brand pain-relieving drugs over store-brand pain-relieving drugs,
demand curves do not slope downward for pain-relieving drugs.
7
27) The quantity of a good that consumers demand depends only on the price of the good.
28) During the winter of 1997-1998, the northeastern United States experienced warmer than usual
conditions. The price of home heating oil was less than it was during the previous winter, but people
bought less home heating oil. This contradicts the Law of Demand.
29) When the price of beef rises, consumers switch consumption to substitutes such as chicken and fish,
thereby decreasing the demand for beef.
30) Suppose an individual inverse demand curve is given as P = 2 – 1/2 qi, where qi is the quantity
demanded by individual i. There are 50 individual consumers with this identical, individual inverse
demand curve. Solve for the market demand curve.
31) Suppose the market demand curve for pizza can be expressed as QD = 100 – 2P + 3Pb, where QD is the
quantity of pizza demanded, P is the price of a pizza, and Pb is the price of a burrito. What is the slope of
this demand function, and what information does the slope provide?
32) Suppose the demand for a particular product can be expressed as Q = 100/p. Calculate the total
amount spent on this good when p = 10, 20, and 50. Can you make a generalization about the
mathematical form of this demand curve and consumer behavior in this market?
33) Suppose N consumers each have an identical demand curve for a good is given by Q = a – bp, where Q
is the quantity demanded, p is the price, and a and b are positive constants. What is the market demand
curve? Is the slope (in price) of the market demand greater or less than the slope of each individual
demand curve?
34) Show that the slope of the market demand curve is the summation of the slopes of individuals’
demand curves.
35) The demand curve for Widgets is given by QD = 6000 – 2y – 200p + 30pG, where QD is the quantity of
widgets demanded, y is the per capital income and pG is the price of Gizmos. Compute the partial
derivatives with respect to y and pG.
2.2 Supply
1) Suppose the demand curve for a good shifts rightward, causing the equilibrium price to increase. This
increase in the price of the good results in
A) a rightward shift of the supply curve.
B) an increase in quantity supplied.
C) a leftward shift of the supply curve.
D) a downward movement along the supply curve.
2) A rise in the oil price will
A) shift the supply curve of gas to the left.
B) shift the supply curve of gas to the right.
C) leave the supply curve of gas unchanged.
D) not enough information.
3) The above figure shows a graph of the market for pizzas in a large town. No pizzas will be supplied
unless the price is above
A) $0.
B) $5.
C) $12.
D) $14.
4) Supply curves
A) slope upward.
B) slope downward.
C) are horizontal.
D) can have many shapes.
5) Suppose there are 100 identical firms in the rag industry, and each firm is willing to supply 10 rags at
any price. The market supply curve will be a(n)
A) vertical line where Q = 10.
B) vertical line where Q = 100.
C) vertical line where Q = 1000.
D) horizontal line where Q = 1000.
6) The expression “increase in quantity supplied” is illustrated graphically as a
A) leftward shift in the supply curve.
B) rightward shift in the supply curve.
C) movement up along the supply curve.
D) movement down along the supply curve.
7) If the supply curve of a product changes so that sellers are now willing to sell two additional units at
any given price, the supply curve will
A) shift leftward by two units.
B) shift rightward by two units.
C) shift vertically up by two units.
D) shift vertically down by two units.
8) The market supply curve is found by
A) horizontally summing all individual supply curves.
B) vertically summing all individual supply curves.
C) Either A or B above since they both give the same answer.
D) None of the above.
9) Technological innovation in the production of computers has led to
A) a decrease in the quantity demanded for computers.
B) a rightward shift of the supply curve for computers.
C) a decrease in the quantity supplied of computers.
D) None of the above.
10) Restricting imports tends to
A) shift the demand curve for the product to the left.
B) shift the demand curve for the product to the right.
C) change the shape of the supply curve.
D) increase the quantity supplied of a product.
11) Assume the supply function of ice cream is written as: Qs = 100 + 20P – 10Pm, where Qs is the quantity
supplied, P is price of ice cream, and Pm is the price of milk ($/gallon). If milk price increases by $2
/gallon due to the policy change, how will the Qs change?
A) decreases by 20
B) increases by 20
C) decreases by 10
D) increases by 10
12) Assume the supply function of ice cream is written as: Qs = 100 + 20P – 10Pm, where Qs is the quantity
supplied, P is price of ice cream, and Pm is the price of milk ($/gallon). If milk price is held fixed at $4
/gallon, what is the slope of supply function for ice cream?
A) –10
B) 10
C) –20
D) 20
For the following, please answer “True” or “False” and explain why.
13) The Law of Supply insures that supply curves slope upward.
14) Suppose the following information is known about a market:
1. Sellers will not sell at all below a price of $2.
2. At a price of $10, any given seller will sell 10 units.
3. There are 100 identical sellers in the market.
Assuming a linear supply curve, use this information to derive the market supply curve.
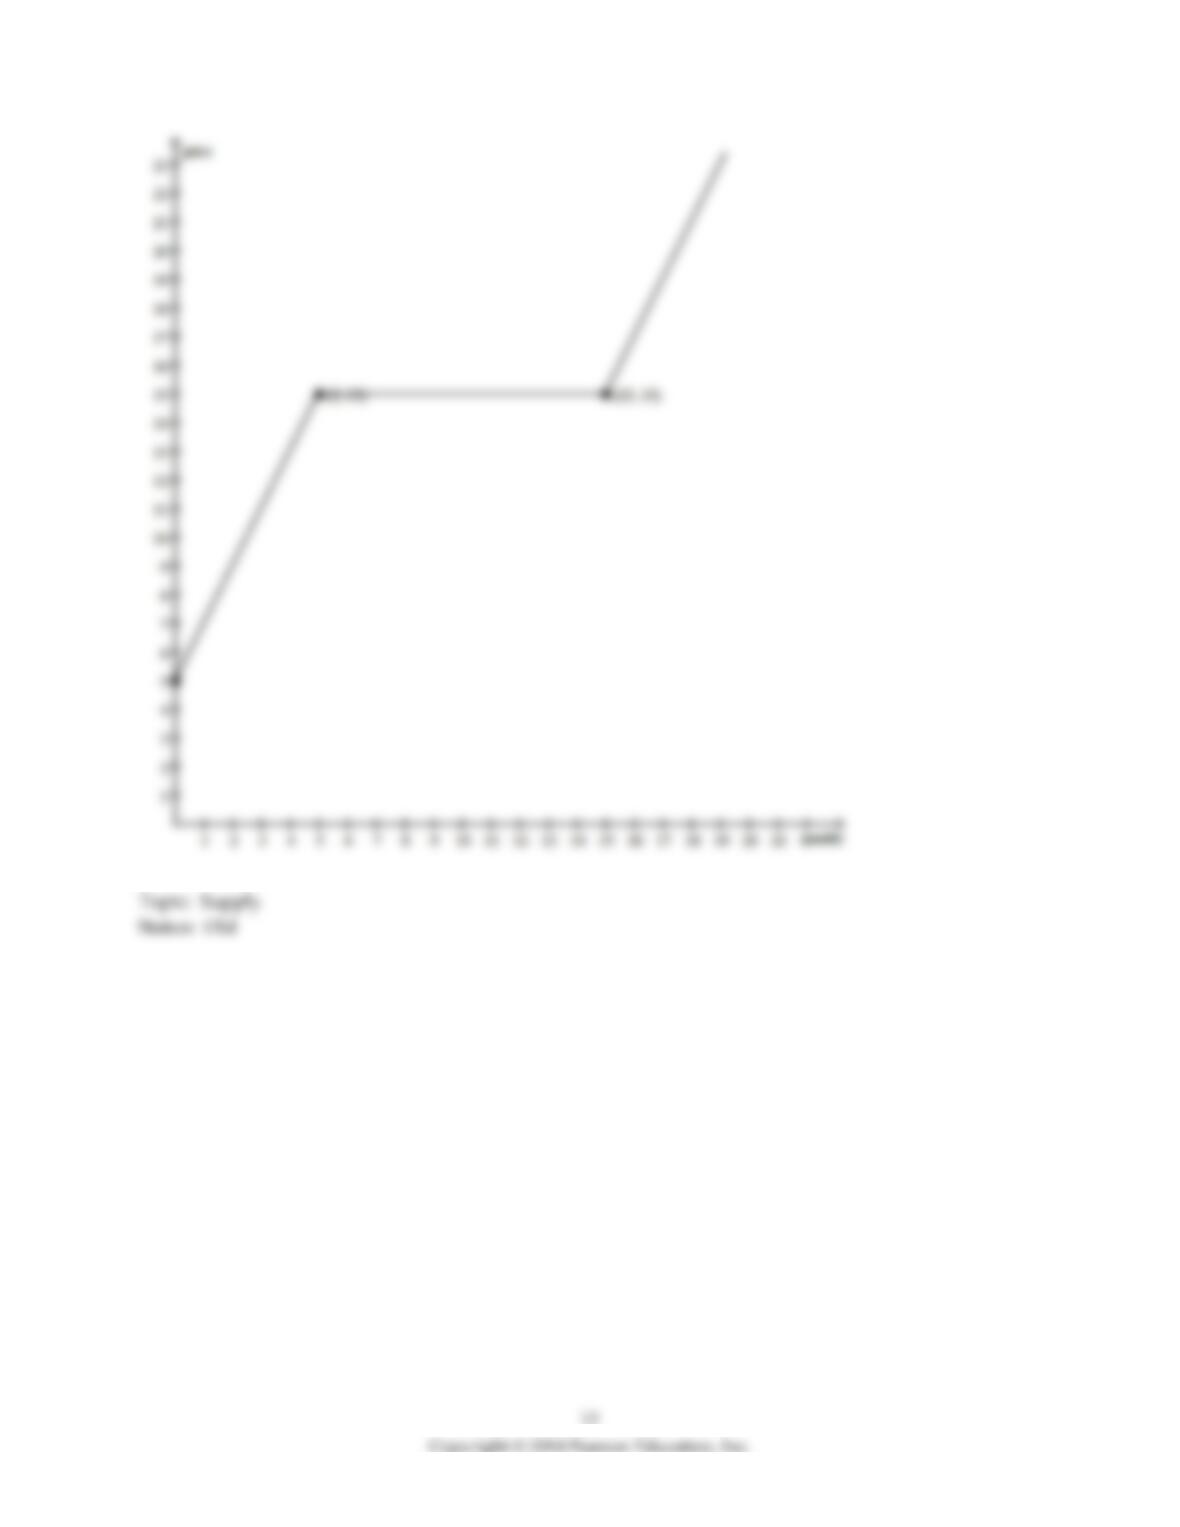
15) Suppose a market is supplied by domestic producers and and an international supply. The domestic
(inverse) supply curve is given by the p=5+2Q, and the foreign supply curve is given by p=15. Draw the
total supply curve. On a second graph, draw the total supply curve if the government imposes a quota of
10 on foreign supply.
16) The U.S. government imposes a number of import quotas on dairy products, including Swiss cheese.
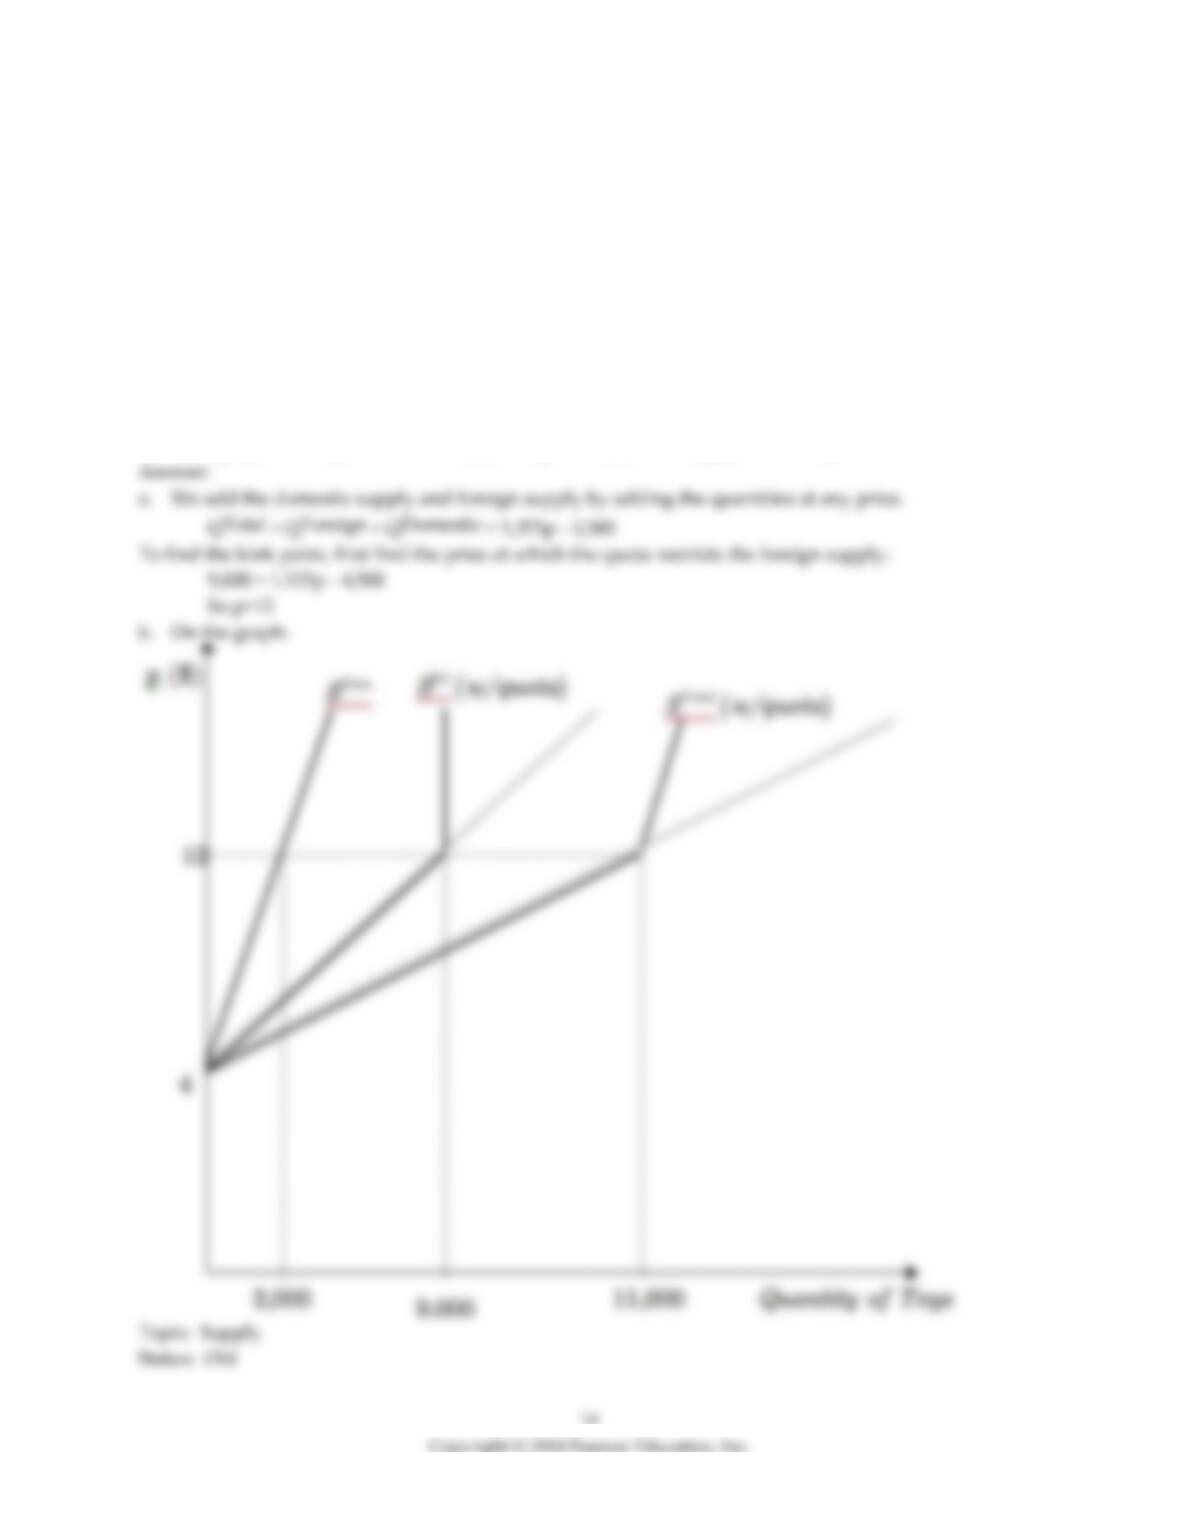
The domestic supply of Swiss cheese is given by:
QDom = 250p – 1000
The supply of Swiss cheese from foreign producers to the U.S. (mostly from Switzerland, of course), is
given by:
QFor = 1125p – 4500
In both equations above, Q is the quantity of cheese (100’s of lbs/month), and p is the price per pound.
a. Using the equations above, derive the total supply of cheese equation to the U.S. in the absence of
any quota.
Suppose that fears of neutral countries (like Switzerland) spark the U.S. to restrict imports of Swiss cheese
to Q = 9000.
b. On a graph, draw (i) the domestic, (ii) foreign and (iii) total supply with the quota.
17) The U.S. is planning on imposing quotas on tires imported from china. Domestic retailers predict this
will result in an increase in consumer prices on tires by about $10. Use a supply and demand graph with
brief explanation to show the effects of an import quota. Assume the quota is binding.
2.3 Market Equilibrium
1) Equilibrium is defined as a situation in which
A) neither buyers nor sellers want to change their behavior.
B) no government regulations exist.
C) demand curves are perfectly horizontal.
D) suppliers will supply any amount that buyers wish to buy.
2) Once an equilibrium is achieved, it can persist indefinitely because
A) shocks that shift the demand curve or the supply curve cannot occur.
B) shocks to the demand curve are always exactly offset by shocks to the supply curve.
C) the government never intervenes in markets at equilibrium.
D) in the absence of supply/demand shocks no one applies pressure to change the price.
3) If price is initially above the equilibrium level,
A) the supply curve will shift rightward.
B) the supply curve will shift leftward.
C) excess supply exists.
D) all firms can sell as much as they want.
4) A competitive equilibrium is described by
A) a price only.
B) a quantity only.
C) the excess supply minus the excess demand.
D) a price and a quantity.
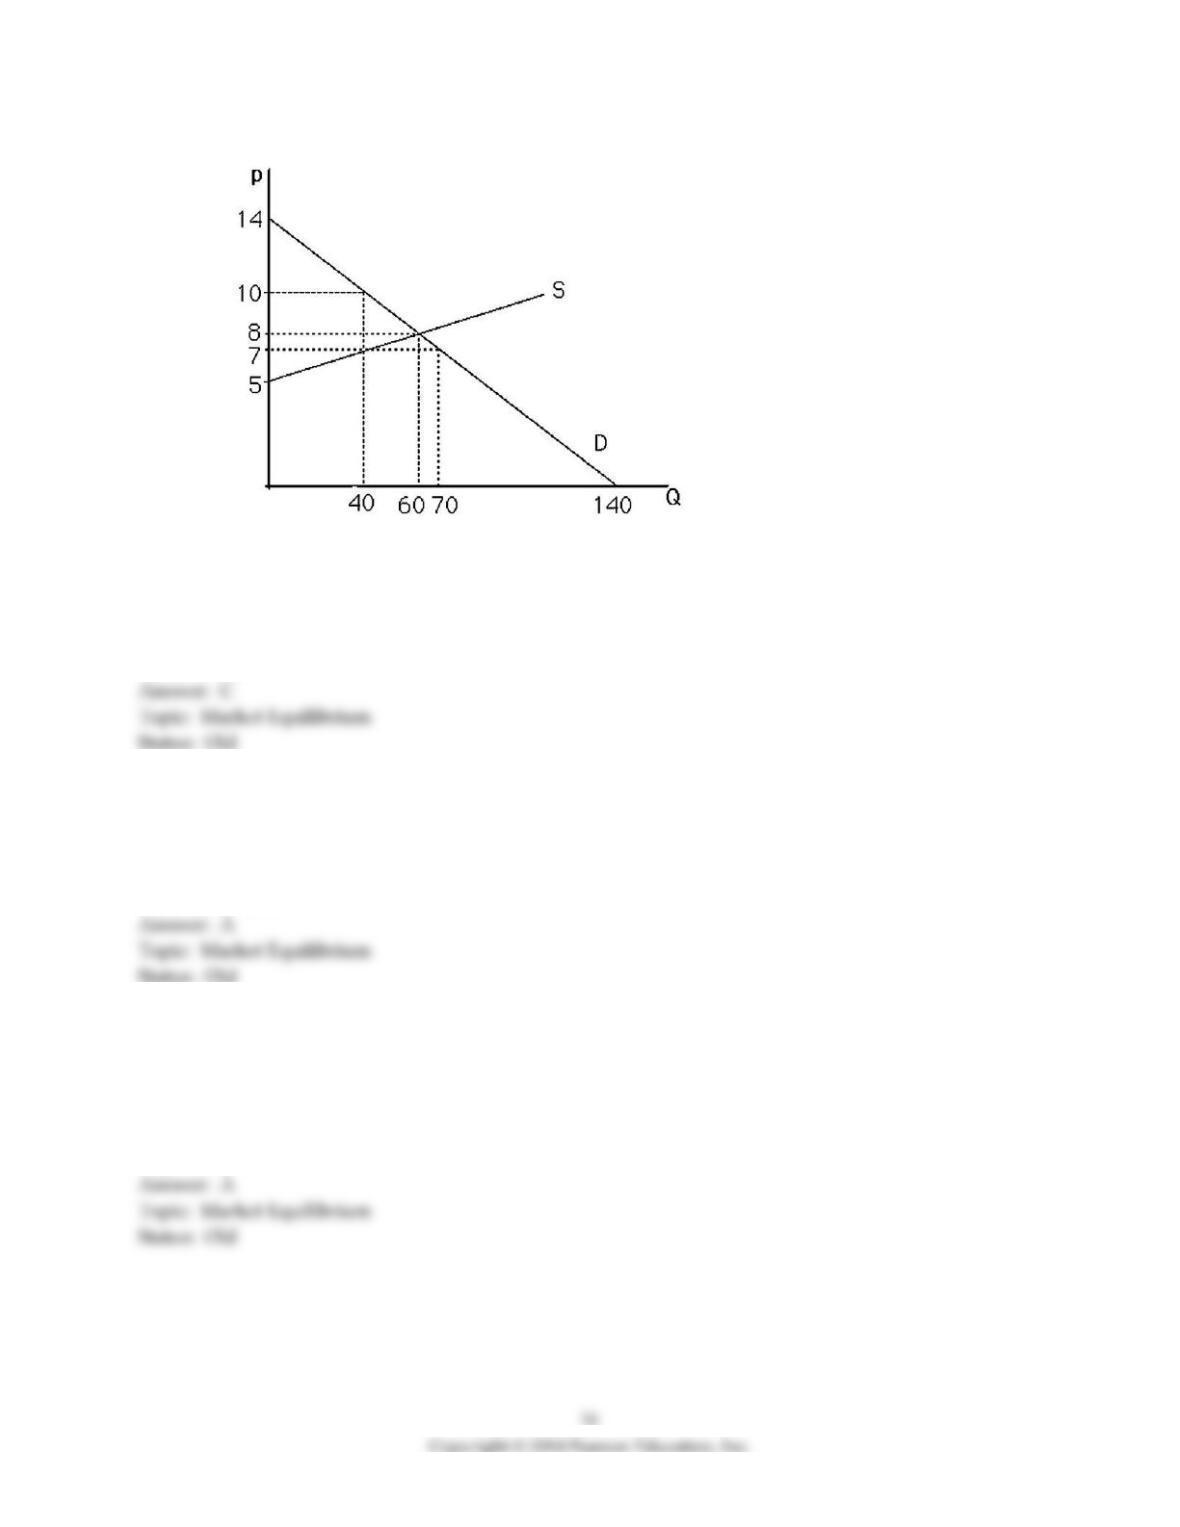
5) The above figure shows a graph of the market for pizzas in a large town. At a price of $14, there will be
A) no pizzas supplied.
B) equilibrium.
C) excess supply.
D) excess demand.
6) The above figure shows a graph of the market for pizzas in a large town. At a price of $5, there will be
A) excess demand.
B) excess supply.
C) equilibrium.
D) zero demand.
7) The above figure shows a graph of the market for pizzas in a large town. What are the equilibrium
price and quantity?
A) p = 8, Q = 60
B) p = 60, Q = 8
C) p = 14, Q = 140
D) p = 5, Q = 60
8) The above figure shows a graph of a market for pizzas in a large town. At a price of $7, what is the
amount of excess demand?
A) 0; there is excess supply at $7.
B) 20 units
C) 30 units
D) 10 units
9) The above figure shows a graph of a market for pizzas in a large town. At a price of $10, the market
A) is not in equilibrium.
B) has excess supply.
C) does not have excess demand.
D) All of the above.
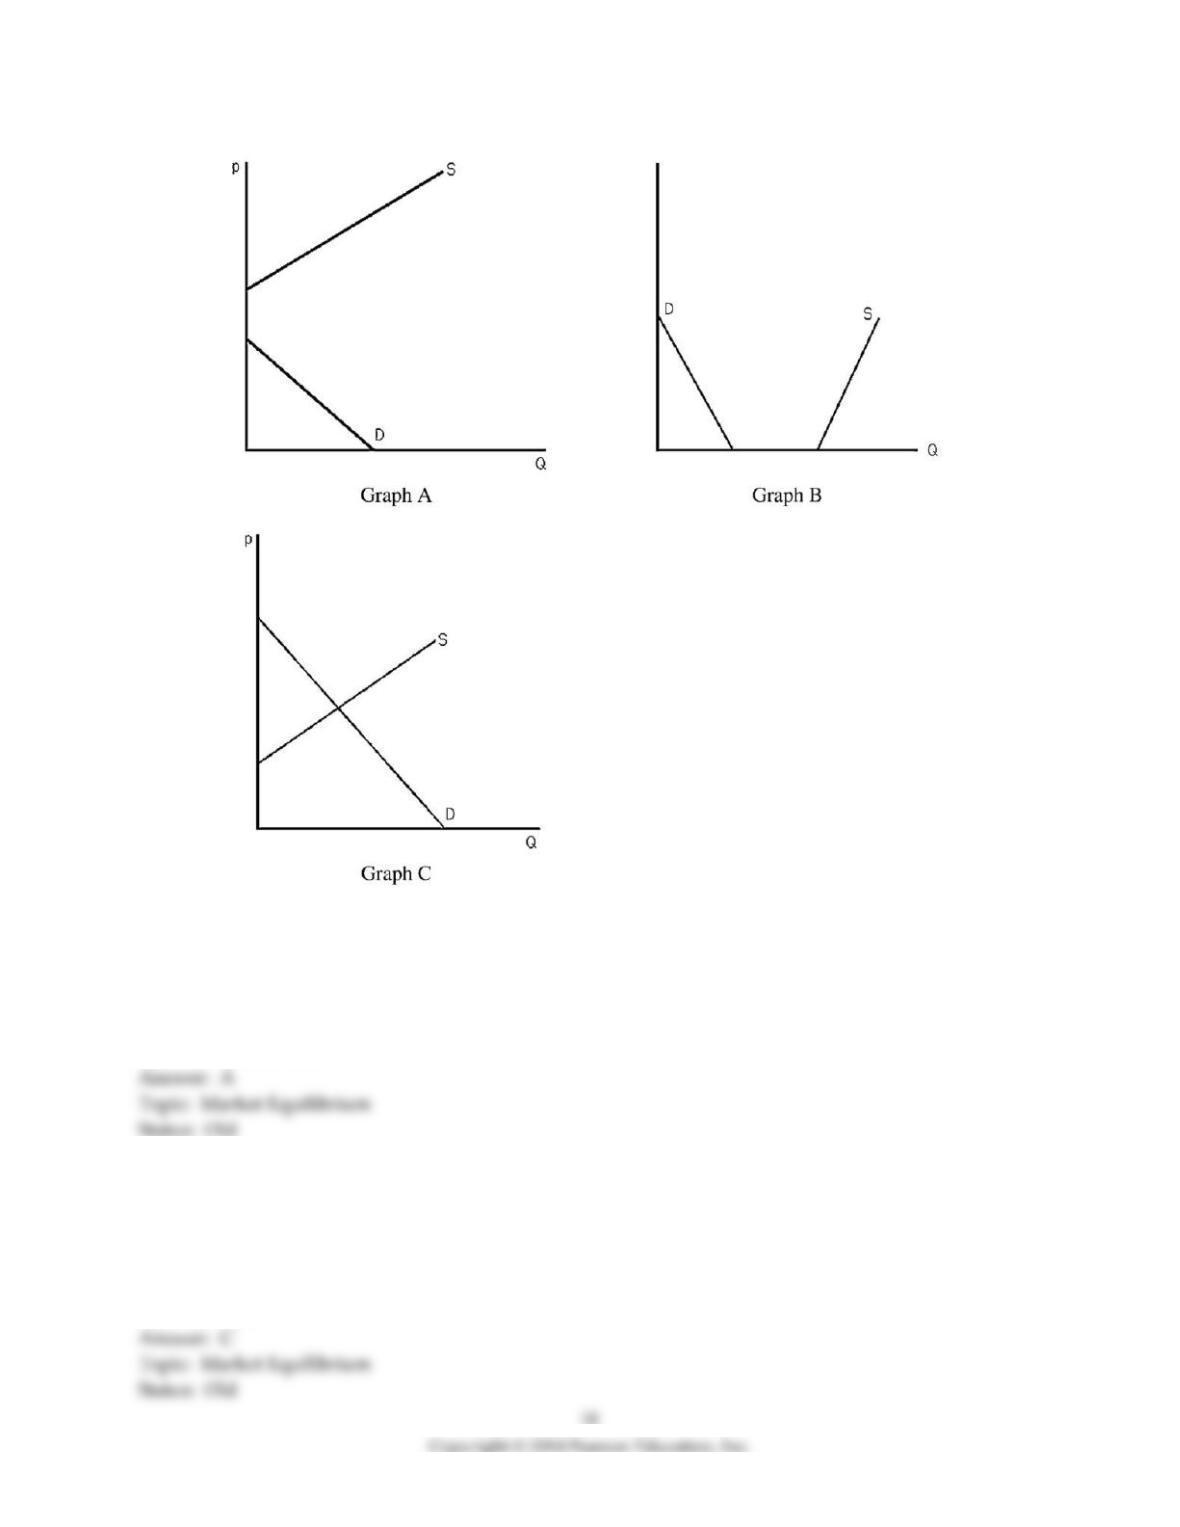
10) The above figure shows three different supply-and-demand graphs. Which graph best represents the
market for vacations on Mars?
A) Graph A
B) Graph B
C) Graph C
D) None of the above.
11) The above figure shows three different supply-and-demand graphs. Which graph best represents the
market for workers at your nearest fast-food restaurant?
A) Graph A
B) Graph B
C) Graph C
D) None of the above.
12) The above figure shows three different supply-and-demand graphs. Which graph best represents the
market for the air we are currently breathing?
A) Graph A
B) Graph B
C) Graph C
D) None of the above.
13) After tickets for a major sporting event are purchased at the official box office price, a market often
develops whereby these tickets sell at prices well above the official box office price. Which of the
following scenarios would NOT be able to explain this result?
A) The official price was below equilibrium from the moment the tickets were available.
B) Increased publicity causes the demand curve for the event to shift rightward.
C) The event was not a sellout.
D) Not everyone who wanted a ticket was able to buy one at the box office.
For the following, please answer “True” or “False” and explain why.
14) When a market is in disequilibrium consumers and producers change their behavior. As a result the
market reaches equilibrium.
15) Suppose the market for potatoes can be expressed as follows:
Supply: QS = -20 + 10p
Demand: QD = 400 – 20p
Solve for the equilibrium price and quantity.
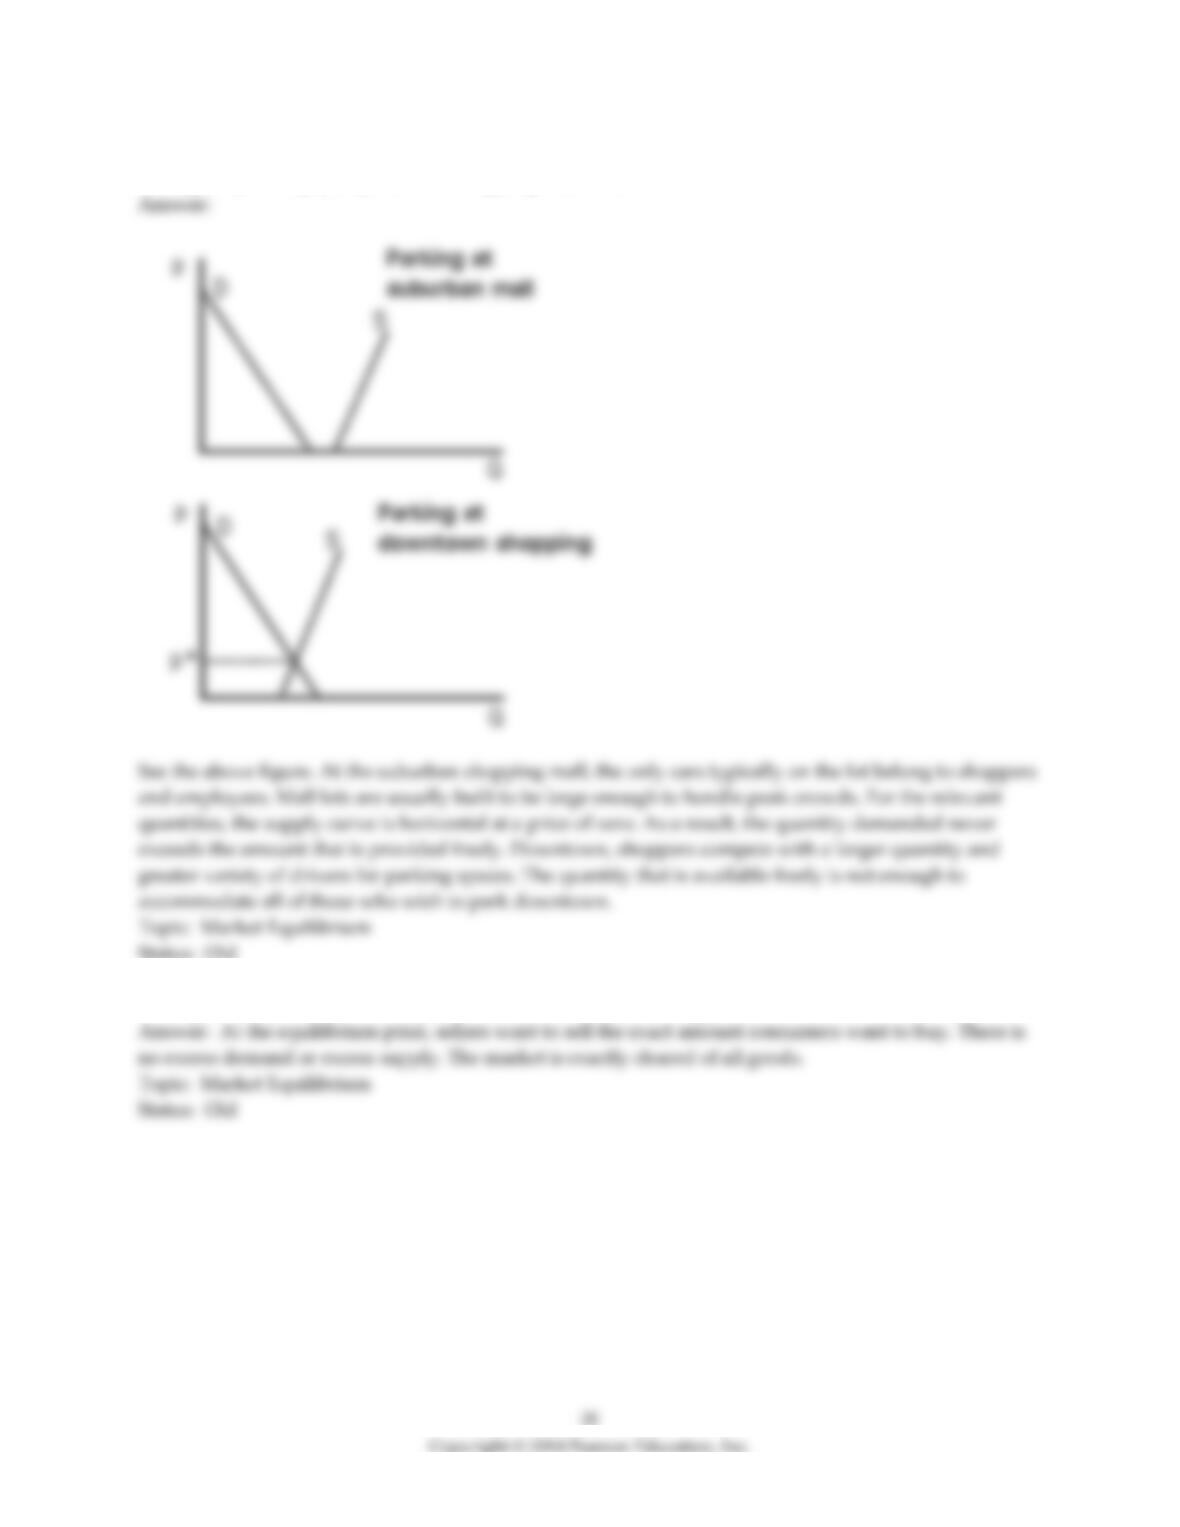
16) Use supply-and-demand graphs to explain why parking is free at the suburban shopping mall but
one typically must pay to park when shopping downtown.
17) Explain why the equilibrium price is called the market clearing price.