Chapter 01A – Graphing: Yes, You Can
Chapter 01A Graphing: Yes, You Can
Multiple Choice
1. In the Cartesian coordinate system, the point on a two-dimensional graph were both variables
have a value of zero, i.e., (0,0), is called the
A) intercept.
B) slope.
C) origin.
D) y-axis.
2. Rene Descartes realized that he could define the location of any point on the ceiling, relative
to a corner of the room, by the distance of the point from two of the room’s
A. slopes.
B) windows.
C) doors.
D) walls.
3. Along a straight line, the increase in the y-axis variable for each one-unit increase in the x-
axis variable is the line’s
A) slope.
B) y-intercept.
C) coordinate.
D) intersection.
4. The value of the y-axis variable when the x-axis variable is zero is the
A) slope.
B) y-intercept.
C) x-intercept.
D) meaning of the symbol “m” in “y = mx + b”.
5. The value of the x-axis variable when the y-axis variable is zero is the
A) slope.
B) y-intercept.
C) x-intercept.
D) meaning of the symbol “m” in “y = mx + b”.
Chapter 01A – Graphing: Yes, You Can
6. The most important quadrant of the Cartesian coordinate system in economics is usually the
first quadrant, where
A) x is negative but y is positive.
B) x and y are both negative.
C) x is positive but y is negative.
D) x and y are both positive.
7. A downward-sloping straight line has an equation of the form y=mx+b where
A) b < 0.
B) b > 0.
C) m < 0.
D) m > 0.
8. An upward-sloping straight line has an equation of the form y = mx + b where
A) b < 0.
B) b > 0.
C) m < 0.
D) m > 0.
9. In economics, an upward-sloping straight line might represent the willingness of firms to
produce and sell
A) more when the price of their product increases.
B) more when the price of their product decreases.
C) less when the price of their product increases.
D) their product at “everyday low prices”.
10. In economics, a downward-sloping straight line might represent the willingness of consumers
to buy
A) more when the price of the product increases.
B) more when the price of the product decreases.
C) less when the price of the product decreases.
D) only in exclusive boutiques, ignoring price.
Chapter 01A – Graphing: Yes, You Can
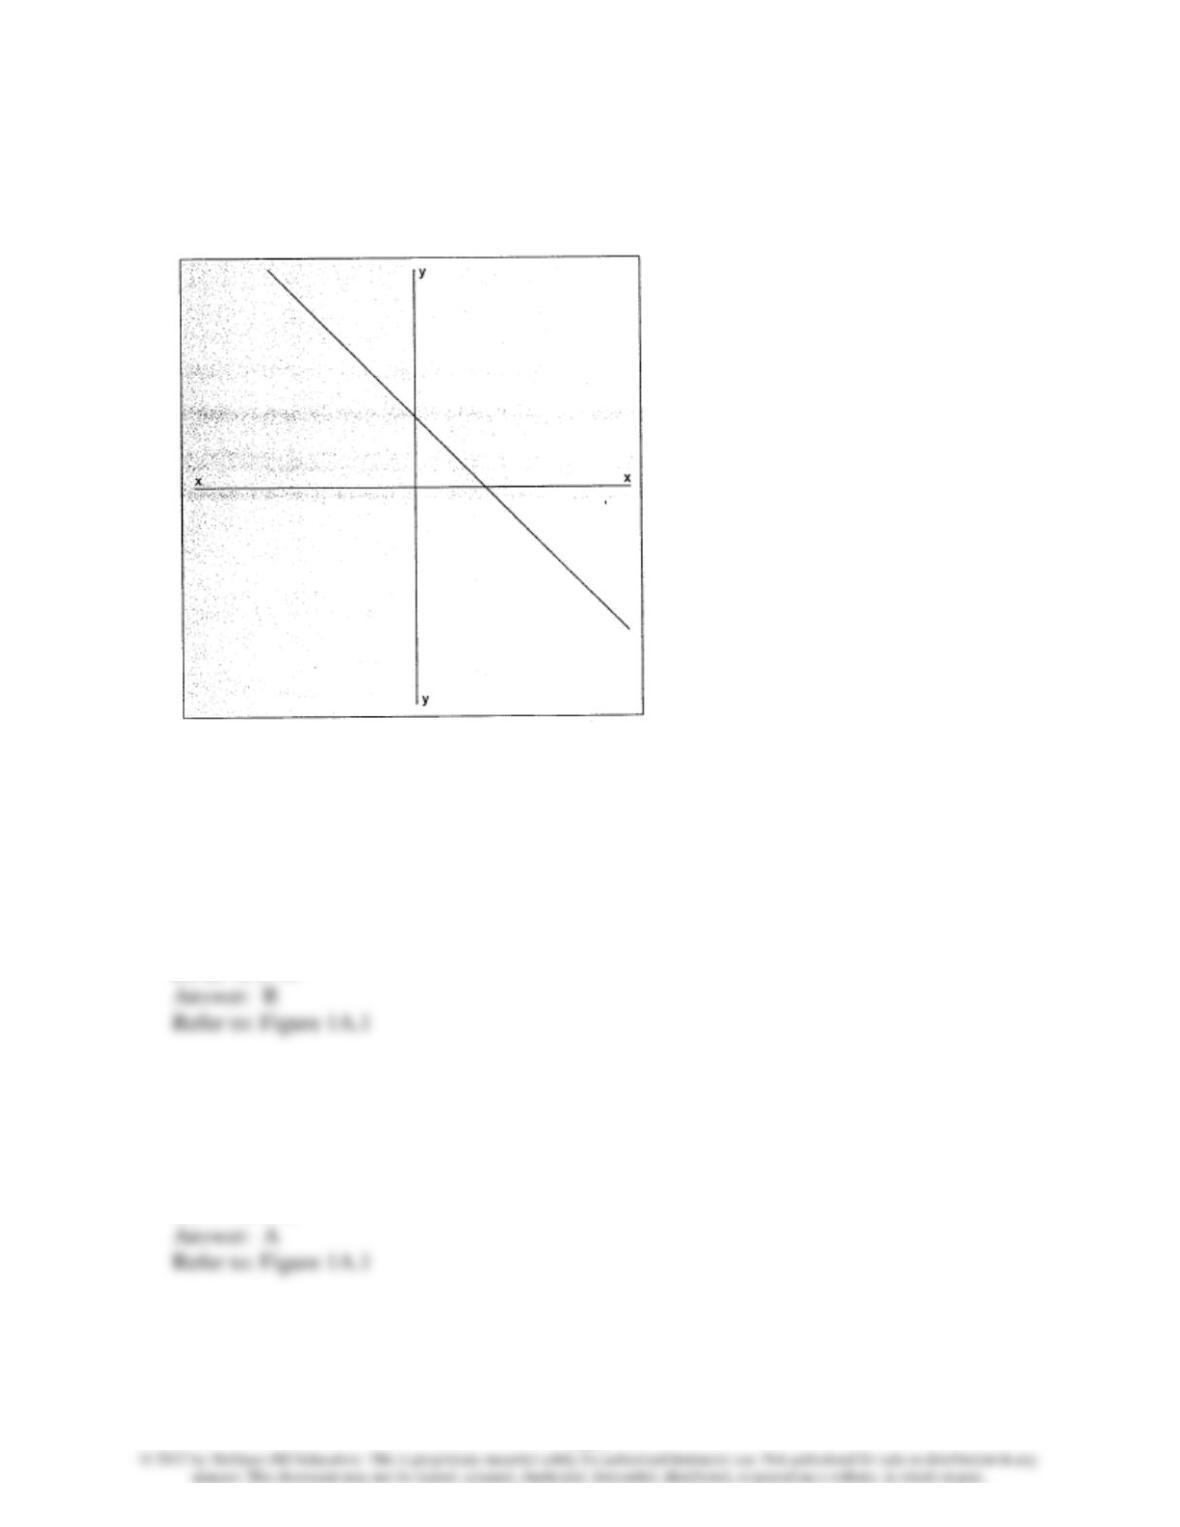
Use Figure 1A.1 in Questions 11 and 12.
Figure 1A.1
11. Refer to Figure 1A.1. This straight line is described by the equation y = mx + b with
A) m<0, b<0.
B) m<0, b>0.
C) m>0, b<0.
12. Refer to Figure 1A.1. This straight line is described by the equation y = mx + b with
A) m<0, b>0.
B) m<0, b=0.
C) m=0, b >0.
D) m>0, b>0.
Chapter 01A – Graphing: Yes, You Can
13. Refer to Figure 1A.1. In economics, a line like this can be used to describe
A) the willingness of producers to produce at different prices
B) supply
C) the willingness of producers to sell at different prices
D) demand
14. Refer to Figure 1A.1. In economics, a line like this can be used to describe
A) the willingness of producers to produce at different prices
B) the willingness of buyers to buy at different prices
C) the willingness of producers to sell at different prices
D) supply
15. Refer to Figure 1A.1. In economics, a line like this can be used to describe
A) the (steadily increasing) marginal cost of producing larger quantities of a product
B) the (steadily decreasing) marginal benefit of consuming larger quantities of a product
C) the willingness of producers to sell at different prices
D) supply
16. Refer to Figure 1A.1. In economics, a line like this can be used to describe
A) ice cream consumption and body mass index in a population of consumers
B) outside daily high temperature and ice cream consumption in a city
C) outside daily high temperature and hot chocolate consumption in a city
D) supply
17. A horizontal straight line has an equation of the form y = mx + b where
A) b < 0.
B) m < 0.
C) m = 0.