Chapter 19 – Agriculture: Economics and Policy
1. Farm commodities are usually sold in:
2. Approximately what percentage of American consumers’ total spending is on food?
Chapter 19 – Agriculture: Economics and Policy
3. Farm outputs’ share of U.S. GDP from 1950 to the present:
4. The demand for agricultural products is quite inelastic and can be explained by:
5. If the prices of agricultural products fall, then the quantities demanded usually:
Chapter 19 – Agriculture: Economics and Policy
6. Suppose the demand for good X, an agricultural product, is price-inelastic. This means that
small variations in the quantity of X produced will be associated with large variations in the:
7. With a fixed level of farm production, a given shift in demand for a crop will cause a:
8. It is estimated that the price elasticity coefficient for farm products is .2. Therefore, in order
for consumers to increase their purchases of farm products by 10 percent, the prices of these
products would have to fall:
Chapter 19 – Agriculture: Economics and Policy
9. The price elasticity of demand for food tends to be:
10. The inelastic demand for agricultural products means that relatively small increases in
supply will result in a relatively:
11. The inelastic demand for agricultural products means that:
Chapter 19 – Agriculture: Economics and Policy
12. The relative price inelasticity of demand for agricultural products has resulted in:
13. If the demand curve for wheat is inelastic, then total farm income from wheat will be:
14. The inelastic demand for agricultural products means that a(n):
Chapter 19 – Agriculture: Economics and Policy
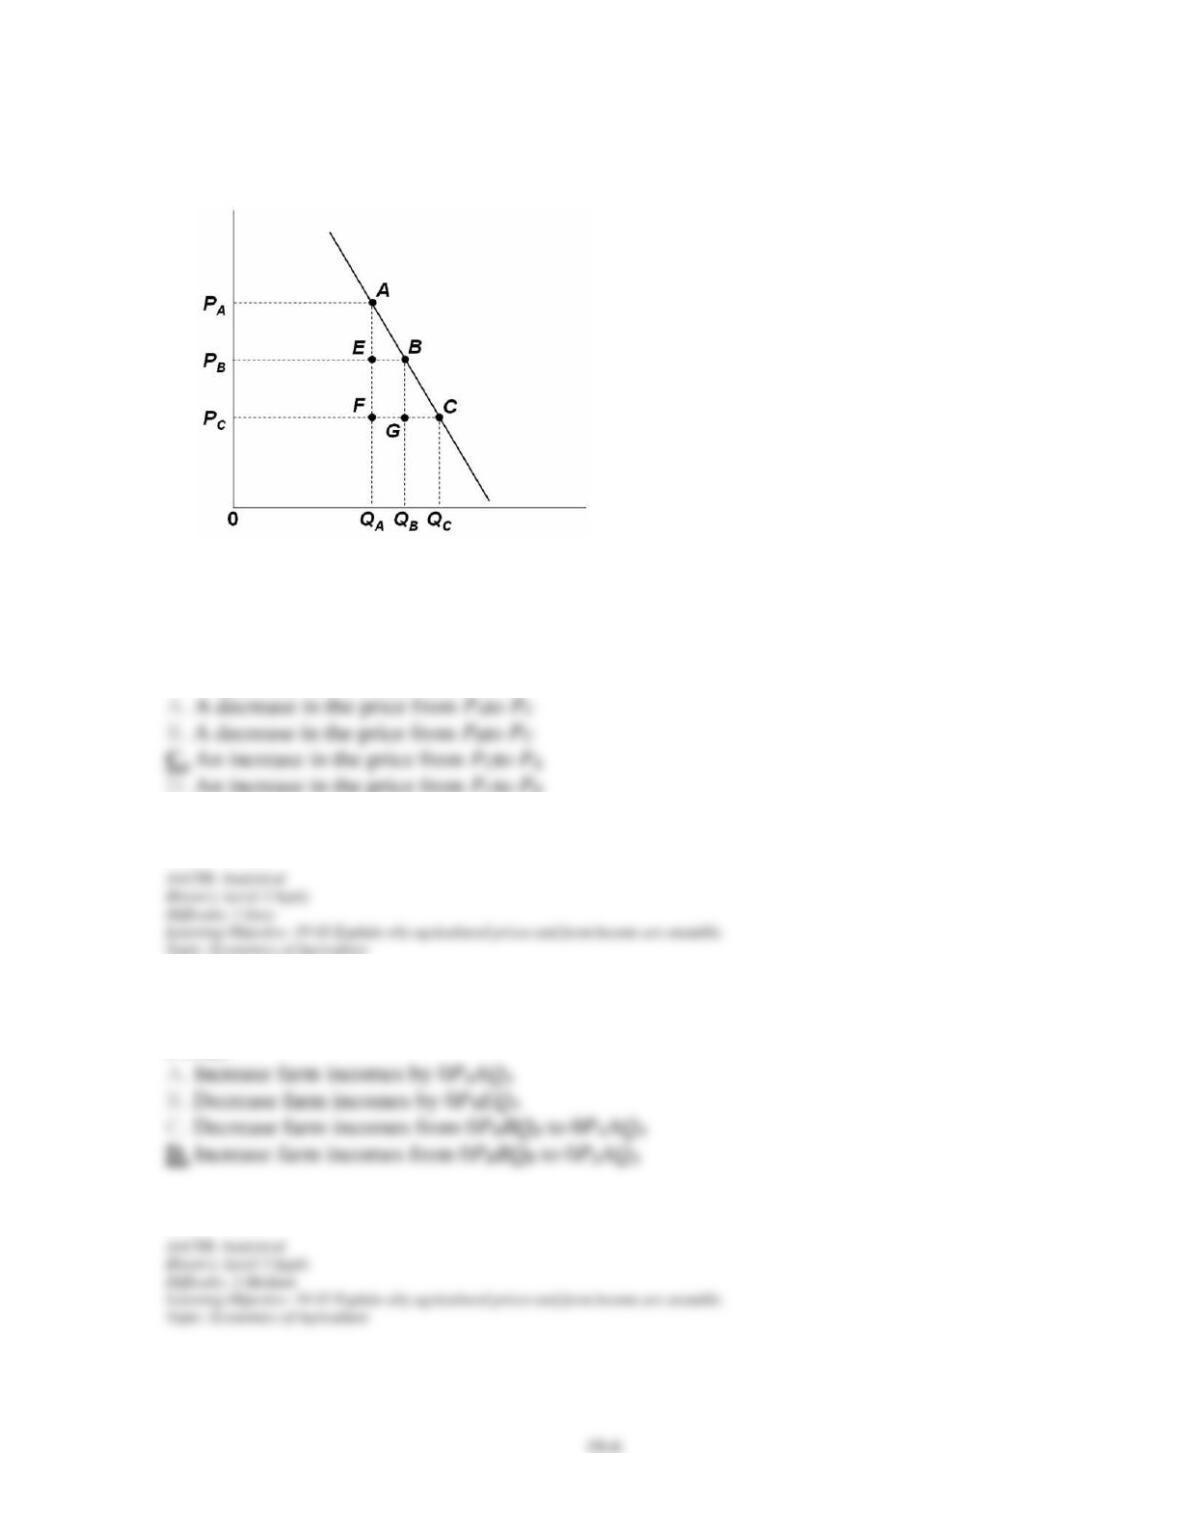
15. Refer to the above demand graph for a farm product. Which of the following will cause
the largest increase in total revenue for farmers?
16. Refer to the above graph. An increase in the price of agricultural products from PB to
Chapter 19 – Agriculture: Economics and Policy
17. Refer to the above demand graph for a farm product. Which of the following will cause
the largest decrease in farmers’ incomes?
18. Refer to the above demand graph for a farm product. It suggests that farmers’ revenues or
incomes tend to:
19. The short-run instability in the prices of agricultural products arises from the following
Chapter 19 – Agriculture: Economics and Policy
20. What is the reason why large, short-run declines in farm prices do not significantly reduce
farm production?
21. Fixed costs faced by farmers typically include the following, except:
22. One reason for the year-to-year instability of agricultural product prices is the:
Chapter 19 – Agriculture: Economics and Policy
23. Incomes of U.S. farmers are adversely affected by:
24. When increases in the supply of an agricultural product are much greater than the
increases in demand for it over time, then the price:
25. Which statement best characterizes the long-run decline in the agricultural industry?
Chapter 19 – Agriculture: Economics and Policy
26. The increase in the productivity of U.S. farmers has caused:
27. Because the demand for food is relatively price-inelastic, what effects would you expect
to see as a result of technological advances that reduce the cost of food production?
28. The U.S. Department of Agriculture’s productivity index in terms of farm output per unit
of farm labor had a value of 14 in 1950. By 2008, the value of the index was:
Chapter 19 – Agriculture: Economics and Policy
29. Most of the technological advances in U.S. agriculture are initiated by the following,
except:
30. Because the demand for agricultural products is highly price-inelastic, a modest increase
in supply will cause:
Chapter 19 – Agriculture: Economics and Policy
31. A significant reason that increases in demand for agricultural products have been
relatively small is because increases in the:
32. Expanding per capita incomes in the United States have resulted in a(n):
33. Changes in the value of the dollar caused exports of U.S. agricultural products to:
Chapter 19 – Agriculture: Economics and Policy
34. A source of demand volatility for agricultural products is:
35. The reason for the long-run decline of the agricultural industry is that the:
Chapter 19 – Agriculture: Economics and Policy
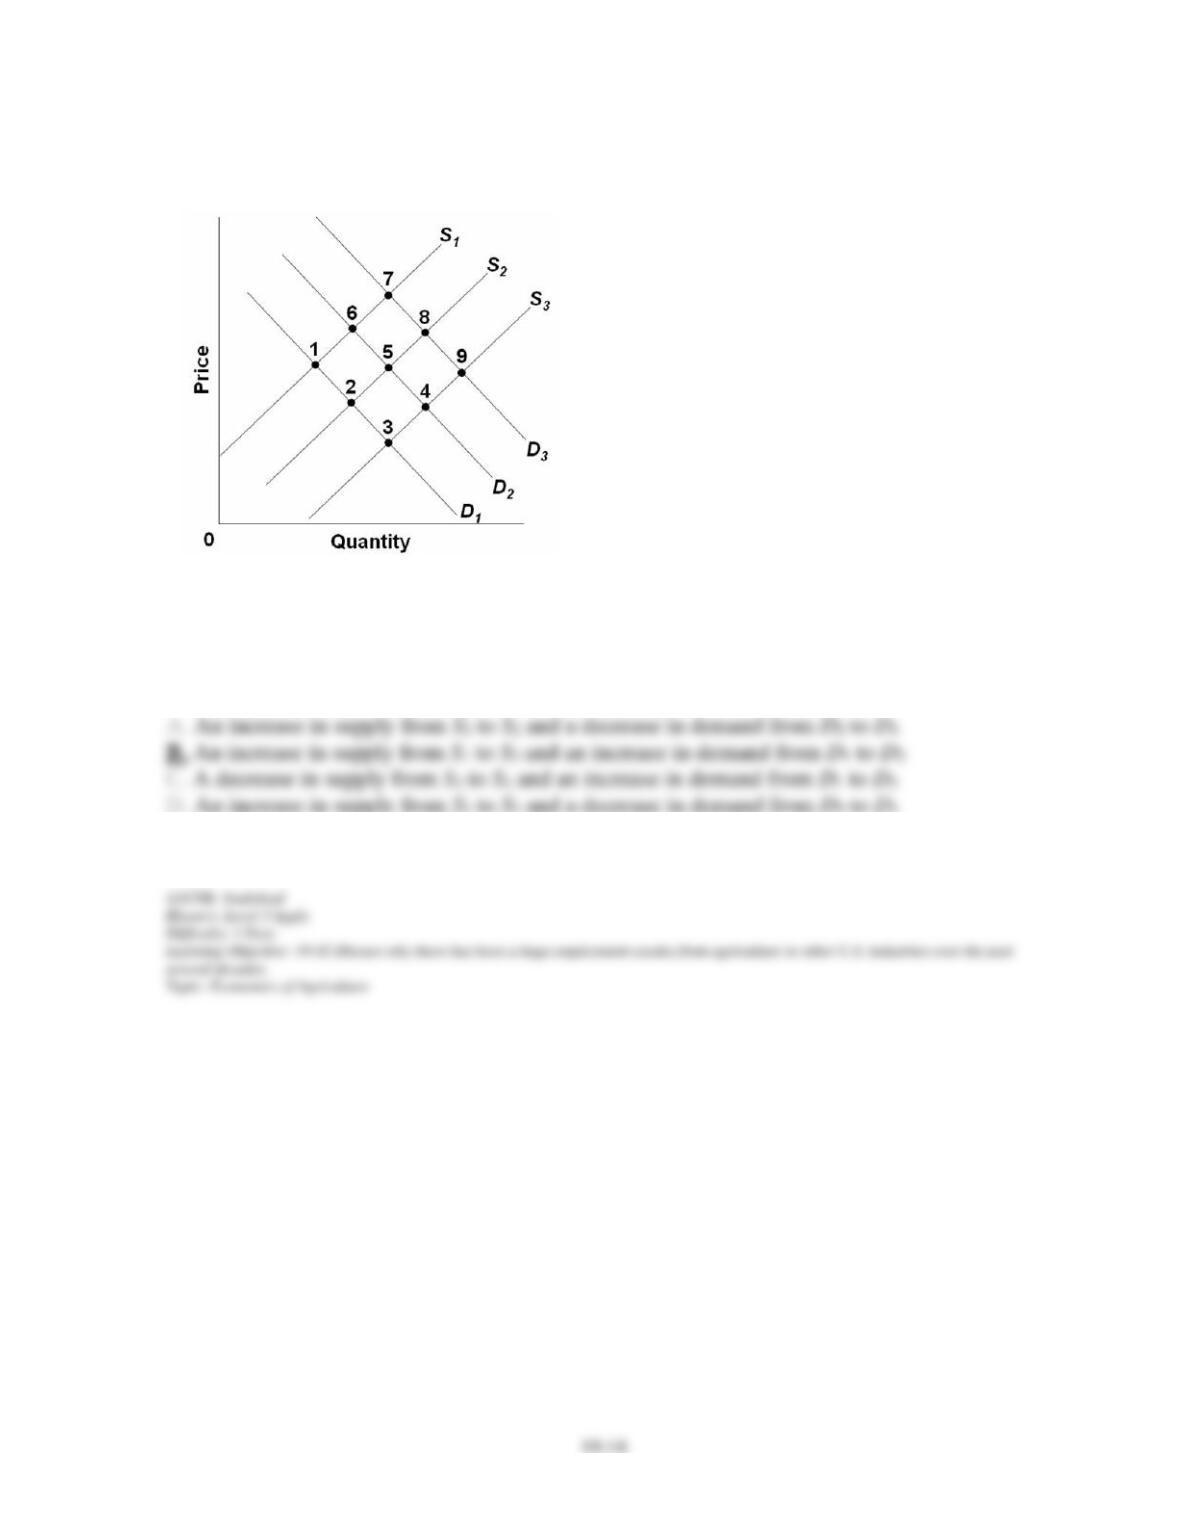
36. Refer to the above graph of the supply and demand for agricultural products. Which of the
following best describes the long-run decline of the agricultural industry?
Chapter 19 – Agriculture: Economics and Policy
37. Refer to the above graph of the supply and demand for agricultural products. If point 1
reflects the supply and demand for agricultural products in the 1950s, then which point would
best characterize long-run change in the equilibrium for agricultural products since that time?
38. Refer to the above graph of the supply and demand for agricultural products. The supply
and demand for agricultural products are in initial equilibrium at point 1. Technological
progress in agriculture will:
39. If turnips are an example of an inferior good, then a decrease in the demand for turnips
could be brought about by a(n):
Chapter 19 – Agriculture: Economics and Policy
40. The farm employment in the United States amounts to about what percentage of the total
employment?
41. In the last five decades the farm employment has been:
42. Which of the following countries has the highest percentage of its labor force still in
agriculture?
Chapter 19 – Agriculture: Economics and Policy
43. What has been the effect of the outmigration of people from farming and the consolidation
of smaller farms into larger ones on net farm income per farm household?
44. U.S. farm household income in 2008 was:
45. Farm policy in the United States over the last half-century has been designed primarily to:
Chapter 19 – Agriculture: Economics and Policy
46. Between 2000 and 2008, U.S. farmers received yearly direct subsidy from the Federal
government averaging at about:
47. Which of the following is a major justification for public aid to agriculture in the United
States?
48. Since the 1930s, the U.S. government has supported agriculture with a “farm program”
that includes the following, except:
Chapter 19 – Agriculture: Economics and Policy
49. Which statement is correct?
50. Which expresses the basic idea of “parity”?
Chapter 19 – Agriculture: Economics and Policy
51. Parity prices for agricultural products are based on the relative purchasing power of farm
products during the period of:
52. The price parity concept, which is a cornerstone of U.S. agricultural policy, was
established by the:
53. A declining parity ratio implies that the: